VQA: Visual Question Answering
VQA: Visual Question Answering
VQA: 视觉问答
Aishwarya Agrawal*, Jiasen Lu*, Stanislaw Antol*,
Margaret Mitchell, C. Lawrence Zitnick, Dhruv Batra, Devi Parikh
*The first three authors contributed equally.
A. Agrawal, J. Lu and S. Antol are with Virginia Tech.
M. Mitchell is with Microsoft Research, Redmond.
C. L. Zitnick is with Facebook AI Research.
D. Batra and D. Parikh are with Georgia Institute of Technology.
Abstract
摘要
We propose the task of free-form and open-ended Visual Question Answering (VQA). Given an image and a natural language question about the image, the task is to provide an accurate natural language answer. Mirroring real-world scenarios, such as helping the visually impaired, both the questions and answers are open-ended. Visual questions selectively target different areas of an image, including background details and underlying context. As a result, a system that succeeds at VQA typically needs a more detailed understanding of the image and complex reasoning than a system producing generic image captions. Moreover, VQA is amenable to automatic evaluation, since many open-ended answers contain only a few words or a closed set of answers that can be provided in a multiple-choice format. We provide a dataset containing 0.25M images, 0.76M questions, and 10M answers (www.visualqa.org), and discuss the information it provides. Numerous baselines and methods for VQA are provided and compared with human performance. Our VQA demo is available on CloudCV (http://cloudcv.org/vqa).
我们提出自由形式、开放式的视觉问答(Visual Question Answering,VQA)任务。给定一张图像和一句关于该图像的自然语言问题,任务是给出准确的自然语言答案。与帮助视障人士等真实场景相对应,问题和答案都是开放的。视觉问题会有选择地指向图像的不同区域,也包括背景细节和潜在语境。因此,要在 VQA 上成功,系统通常需要比生成通用图像描述更细致的图像理解,以及更复杂的推理。此外,VQA 适合自动评测,因为许多开放式答案只有几个词,或者可以做成有封闭答案集合的选择题。我们提供了一个包含约 25 万张图像、约 76 万个问题和约 1000 万条答案的数据集(www.visualqa.org),并讨论它所提供的信息。文中给出了多种 VQA 基线与方法,并与人类表现加以比较。我们的 VQA 演示可在 CloudCV(http://cloudcv.org/vqa)上使用。
I Introduction
I 引言
We are witnessing a renewed excitement in multi-discipline Artificial Intelligence (AI) research problems. In particular, research in image and video captioning that combines Computer Vision (CV), Natural Language Processing (NLP), and Knowledge Representation & Reasoning (KR) has dramatically increased in the past year [16, 9, 12, 38, 26, 24, 53]. Part of this excitement stems from a belief that multi-discipline tasks like image captioning are a step towards solving AI. However, the current state of the art demonstrates that a coarse scene-level understanding of an image paired with word -gram statistics suffices to generate reasonable image captions, which suggests image captioning may not be as “AI-complete” as desired.
我们正在看到,跨学科的人工智能(AI)研究问题重新热起来。尤其是把计算机视觉(CV)、自然语言处理(NLP)以及知识表示与推理(KR)结合起来的图像和视频描述研究,在过去一年里大幅增加 [16, 9, 12, 38, 26, 24, 53]。这种热情,部分来自一种信念:像图像描述这样的跨学科任务,是迈向解决 AI 的一步。然而,当前的最先进结果表明,只需对图像做粗粒度的场景级理解,再配上词的 -gram 统计,就足以生成还过得去的图像描述,这暗示图像描述或许并不像人们所希望的那样“AI-complete”。
What makes for a compelling “AI-complete” task? We believe that in order to spawn the next generation of AI algorithms, an ideal task should (i) require multi-modal knowledge beyond a single sub-domain (such as CV) and (ii) have a well-defined quantitative evaluation metric to track progress.
怎样才算一项有说服力的“AI-complete”任务?我们认为,要催生下一代 AI 算法,理想的任务应当 (i) 需要超出单一子领域(例如 CV)的多模态知识,并且 (ii) 具有明确的定量评测指标,以便跟踪进展。
For some tasks, such as image captioning, automatic evaluation is still a difficult and open research problem [51, 13, 22].
对某些任务,例如图像描述,自动评测仍然是一个困难而开放的研究问题 [51, 13, 22]。
In this paper, we introduce the task of free-form and open-ended Visual Question Answering (VQA). A VQA system takes as input an image and a free-form, open-ended, natural-language question about the image and produces a natural-language answer as the output. This goal-driven task is applicable to scenarios encountered when visually-impaired users [3] or intelligence analysts actively elicit visual information. Example questions are shown in Fig. 1.
在本文中,我们引入自由形式、开放式的视觉问答(VQA)任务。VQA 系统以一张图像和一句关于该图像的、自由形式、开放式的自然语言问题作为输入,并产出一句自然语言答案作为输出。这一目标驱动的任务,适用于视障用户 [3] 或情报分析人员主动获取视觉信息时所遇到的场景。示例问题见图 1。
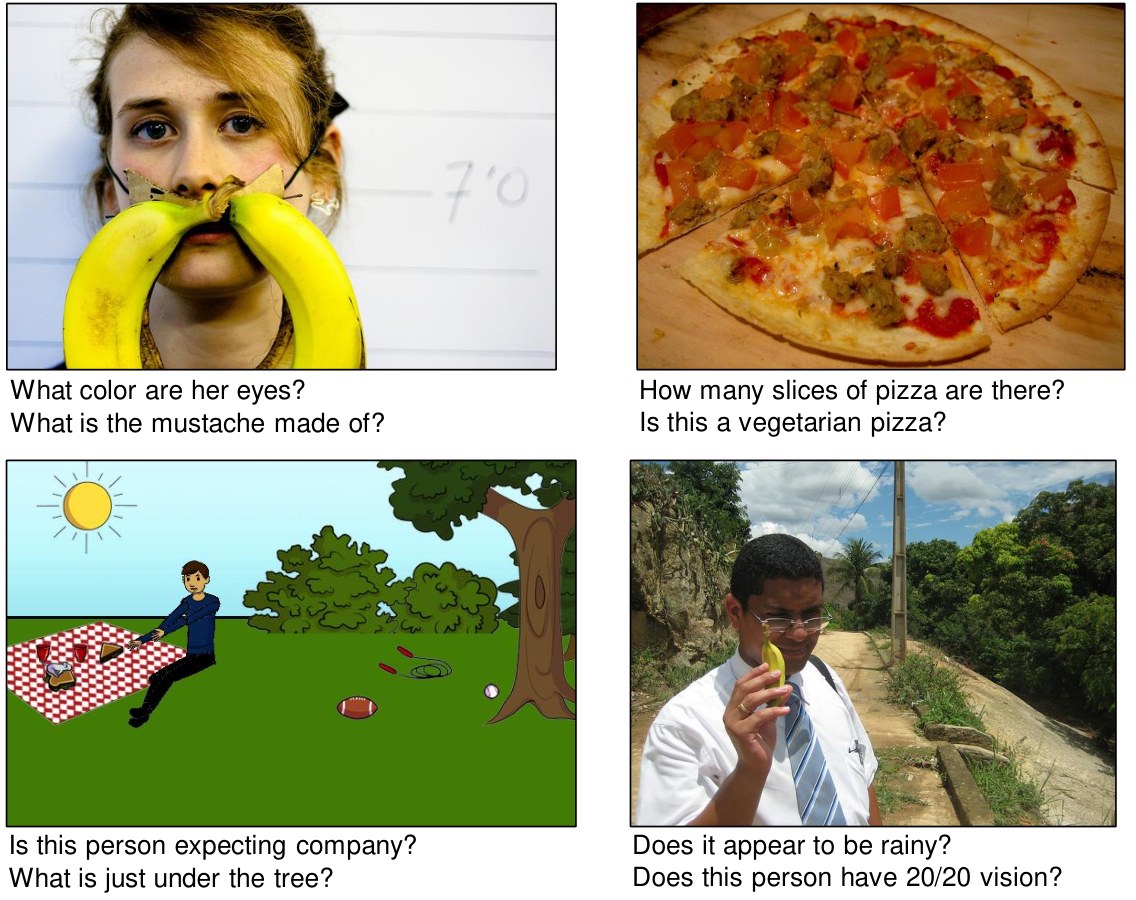
Fig. 1: Examples of free-form, open-ended questions collected for images via Amazon Mechanical Turk. Note that commonsense knowledge is needed along with a visual understanding of the scene to answer many questions.
图 1:通过 Amazon Mechanical Turk 为图像收集的自由形式、开放式问题示例。请注意,要回答其中许多问题,除了对场景的视觉理解,还需要常识。
Open-ended questions require a potentially vast set of AI capabilities to answer – fine-grained recognition (e.g., “What kind of cheese is on the pizza?”), object detection (e.g., “How many bikes are there?”), activity recognition (e.g., “Is this man crying?”), knowledge base reasoning (e.g., “Is this a vegetarian pizza?”), and commonsense reasoning (e.g., “Does this person have 20/20 vision?”, “Is this person expecting company?”). VQA [19, 36, 50, 3] is also amenable to automatic quantitative evaluation, making it possible to effectively track progress on this task. While the answer to many questions is simply “yes” or “no”, the process for determining a correct answer is typically far from trivial (e.g. in Fig. 1, “Does this person have 20/20 vision?”). Moreover, since questions about images often tend to seek specific information, simple one-to-three word answers are sufficient for many questions. In such scenarios, we can easily evaluate a proposed algorithm by the number of questions it answers correctly. In this paper, we present both an open-ended answering task and a multiple-choice task [45, 33]. Unlike the open-ended task that requires a free-form response, the multiple-choice task only requires an algorithm to pick from a predefined list of possible answers.
开放式问题要答对,可能需要一整套范围很广的 AI 能力——细粒度识别(例如,“披萨上是哪种奶酪?”)、物体检测(例如,“有多少辆自行车?”)、活动识别(例如,“这个人在哭吗?”)、知识库推理(例如,“这是素披萨吗?”)以及常识推理(例如,“这个人视力是 2.0 吗?”“这个人在等客人吗?”)。VQA [19, 36, 50, 3] 也适合自动定量评测,从而可以有效跟踪这一任务上的进展。虽然许多问题的答案只是“是”或“否”,但判断正确答案的过程通常远非平凡(例如图 1 中的“这个人视力是 2.0 吗?”)。此外,关于图像的问题往往在寻找具体信息,对许多问题来说,一到三个词的简单答案就足够了。在这种情形下,我们很容易用答对的问题数来评测所提出的算法。在本文中,我们同时给出开放式作答任务和选择题任务 [45, 33]。开放式任务需要自由形式的回答,而选择题任务只要求算法从预先给定的可能答案列表中挑选。
We present a large dataset that contains 204,721 images from the MS COCO dataset [32] and a newly created abstract scene dataset [57, 2] that contains 50,000 scenes. The MS COCO dataset has images depicting diverse and complex scenes that are effective at eliciting compelling and diverse questions. We collected a new dataset of “realistic” abstract scenes to enable research focused only on the high-level reasoning required for VQA by removing the need to parse real images. Three questions were collected for each image or scene. Each question was answered by ten subjects along with their confidence. The dataset contains over 760K questions with around 10M answers.
我们给出一个大规模数据集,其中包含来自 MS COCO 数据集 [32] 的 204,721 张图像,以及一个新创建的、包含 50,000 个场景的抽象场景数据集 [57, 2]。MS COCO 数据集中的图像描绘多样而复杂的场景,能够有效引出有吸引力、多样化的问题。我们收集了一个新的“逼真”抽象场景数据集,以便研究可以只关注 VQA 所需的高层推理,而不必再解析真实图像。每张图像或每个场景收集了三个问题。每个问题由十名受试者作答,并给出自信度。该数据集包含超过 76 万个问题,以及约 1000 万条答案。
While the use of open-ended questions offers many benefits, it is still useful to understand the types of questions that are being asked and which types various algorithms may be good at answering. To this end, we analyze the types of questions asked and the types of answers provided. Through several visualizations, we demonstrate the astonishing diversity of the questions asked. We also explore how the information content of questions and their answers differs from image captions. For baselines, we offer several approaches that use a combination of both text and state-of-the-art visual features [29]. As part of the VQA initiative, we will organize an annual challenge and associated workshop to discuss state-of-the-art methods and best practices.
虽然使用开放式问题有许多好处,了解人们在问哪些类型的问题、以及各类算法可能擅长回答哪些类型,仍然是有用的。为此,我们分析了所提出的问题类型和所给出的答案类型。通过若干可视化,我们展示了所提问题惊人的多样性。我们也探讨了问题及其答案的信息内容如何不同于图像描述。作为基线,我们给出若干把文本和先进视觉特征 [29] 结合起来的方法。作为 VQA 计划的一部分,我们将组织年度挑战赛和配套研讨会,讨论最先进的方法和最佳实践。
VQA poses a rich set of challenges, many of which have been viewed as the holy grail of automatic image understanding and AI in general. However, it includes as building blocks several components that the CV, NLP, and KR [5, 8, 31, 35, 4] communities have made significant progress on during the past few decades. VQA provides an attractive balance between pushing the state of the art, while being accessible enough for the communities to start making progress on the task.
VQA 提出了一组丰富的挑战,其中许多曾被看作自动图像理解和一般 AI 的圣杯。然而,它也把 CV、NLP 和 KR [5, 8, 31, 35, 4] 社区在过去几十年里已经取得显著进展的若干组件作为构建模块。VQA 在推动最先进水平与让各个社区能够着手取得进展之间,提供了一个有吸引力的平衡。
II Related Work
II 相关工作
VQA Efforts. Several recent papers have begun to study visual question answering [19, 36, 50, 3]. However, unlike our work, these are fairly restricted (sometimes synthetic) settings with small datasets. For instance, [36] only considers questions whose answers come from a predefined closed world of 16 basic colors or 894 object categories. [19] also considers questions generated from templates from a fixed vocabulary of objects, attributes, relationships between objects, etc. In contrast, our proposed task involves open-ended, free-form questions and answers provided by humans. Our goal is to increase the diversity of knowledge and kinds of reasoning needed to provide correct answers. Critical to achieving success on this more difficult and unconstrained task, our VQA dataset is two orders of magnitude larger than [19, 36] (250,000 vs. 2,591 and 1,449 images respectively). The proposed VQA task has connections to other related work: [50] has studied joint parsing of videos and corresponding text to answer queries on two datasets containing 15 video clips each. [3] uses crowdsourced workers to answer questions about visual content asked by visually-impaired users. In concurrent work, [37] proposed combining an LSTM for the question with a CNN for the image to generate an answer. In their model, the LSTM question representation is conditioned on the CNN image features at each time step, and the final LSTM hidden state is used to sequentially decode the answer phrase. In contrast, the model developed in this paper explores “late fusion” – i.e., the LSTM question representation and the CNN image features are computed independently, fused via an element-wise multiplication, and then passed through fully-connected layers to generate a softmax distribution over output answer classes. [34] generates abstract scenes to capture visual common sense relevant to answering (purely textual) fill-in-the-blank and visual paraphrasing questions. [47] and [52] use visual information to assess the plausibility of common sense assertions. [55] introduced a dataset of 10k images and prompted captions that describe specific aspects of a scene (e.g., individual objects, what will happen next). Concurrent with our work, [18] collected questions & answers in Chinese (later translated to English by humans) for COCO images. [44] automatically generated four types of questions (object, count, color, location) using COCO captions.
VQA 方面的工作。 若干近期论文已经开始研究视觉问答 [19, 36, 50, 3]。然而与我们的工作不同,这些工作多在相当受限(有时还是合成的)设定下使用小型数据集。例如,[36] 只考虑答案来自预先给定的封闭世界的问题,该世界只有 16 种基本颜色或 894 个物体类别。[19] 也考虑由模板生成的问题,词汇表固定为物体、属性、物体之间的关系等。相比之下,我们提出的任务涉及由人提供的开放式、自由形式的问题和答案。我们的目标是增加给出正确答案所需的知识多样性和推理种类。要在这一更困难、更少约束的任务上取得成功,一个关键是我们的 VQA 数据集比 [19, 36] 大两个数量级(超过 250,000 张图像,而后者分别只有 2,591 和 1,449 张)。所提出的 VQA 任务与其他相关工作也有联系:[50] 研究了对视频及其对应文本做联合解析,以在两个各含 15 段视频的数据集上回答查询。[3] 使用众包工人来回答视障用户提出的、关于视觉内容的问题。在并行的工作中,[37] 提出把用于问题的 LSTM 与用于图像的 CNN 结合起来生成答案。在他们的模型里,LSTM 的问题表示在每一步都以 CNN 图像特征为条件,最后的 LSTM 隐状态再被用来依次解码答案短语。相比之下,本文发展的模型探索的是“晚融合”——也就是说,LSTM 问题表示和 CNN 图像特征被独立计算,再通过逐元素相乘融合,然后送入全连接层,在输出答案类别上产生 softmax 分布。[34] 生成抽象场景,以捕捉与回答(纯文本的)填空和视觉复述问题相关的视觉常识。[47] 和 [52] 用视觉信息来评估常识断言的可信度。[55] 引入了一个含 1 万张图像和提示性描述的数据集,这些描述针对场景的特定方面(例如个别物体、接下来会发生什么)。与我们工作同时,[18] 为 COCO 图像收集了中文问题与答案(随后由人译成英文)。[44] 利用 COCO 描述自动生成了四类问题(物体、计数、颜色、位置)。
Text-based Q&A is a well studied problem in the NLP and text processing communities (recent examples being [15, 14, 54, 45]). Other related textual tasks include sentence completion (e.g., [45] with multiple-choice answers). These approaches provide inspiration for VQA techniques. One key concern in text is the grounding of questions. For instance, [54] synthesized textual descriptions and QA-pairs grounded in a simulation of actors and objects in a fixed set of locations. VQA is naturally grounded in images – requiring the understanding of both text (questions) and vision (images). Our questions are generated by humans, making the need for commonsense knowledge and complex reasoning more essential.
基于文本的问答 是 NLP 和文本处理社区中研究得很充分的问题(近期例子包括 [15, 14, 54, 45])。其他相关的文本任务还包括句子补全(例如 [45] 中带选择题答案的设定)。这些方法为 VQA 技术提供了启发。文本中的一个关键问题是问题的接地(grounding)。例如,[54] 在一个演员与物体位于固定地点集合的仿真中,合成了有根基的文本描述和问答对。VQA 自然地扎根于图像——既需要理解文本(问题),也需要理解视觉(图像)。我们的问题由人生成,因此对常识和复杂推理的需求更加本质。
Describing Visual Content. Related to VQA are the tasks of image tagging [11, 29], image captioning [30, 17, 40, 9, 16, 53, 12, 24, 38, 26] and video captioning [46, 21], where words or sentences are generated to describe visual content. While these tasks require both visual and semantic knowledge, captions can often be non-specific (e.g., observed by [53]). The questions in VQA require detailed specific information about the image for which generic image captions are of little use [3].
描述视觉内容。 与 VQA 相关的任务包括图像标注 [11, 29]、图像描述 [30, 17, 40, 9, 16, 53, 12, 24, 38, 26] 和视频描述 [46, 21],这些任务生成词或句子来描述视觉内容。虽然这些任务既需要视觉知识也需要语义知识,描述却常常并不具体(例如 [53] 所观察到的)。VQA 中的问题需要关于图像的细致、具体的信息,通用的图像描述对此用处不大 [3]。
Other Vision+Language Tasks. Several recent papers have explored tasks at the intersection of vision and language that are easier to evaluate than image captioning, such as coreference resolution [28, 43] or generating referring expressions [25, 42] for a particular object in an image that would allow a human to identify which object is being referred to (e.g., “the one in a red shirt”, “the dog on the left”). While task-driven and concrete, a limited set of visual concepts (e.g., color, location) tend to be captured by referring expressions. As we demonstrate, a richer variety of visual concepts emerge from visual questions and their answers.
其他视觉加语言任务。 若干近期论文探索了视觉与语言交叉处、比图像描述更容易评测的任务,例如共指消解 [28, 43],或为图像中某一特定物体生成指称表达式 [25, 42],使人能够识别所指的是哪个物体(例如,“穿红衬衫的那个”,“左边的狗”)。虽然这些任务是目标驱动且具体的,指称表达式往往只捕捉到有限的一组视觉概念(例如颜色、位置)。正如我们将展示的,视觉问题及其答案会涌现出更丰富多样的视觉概念。
III VQA Dataset Collection
III VQA 数据集的收集
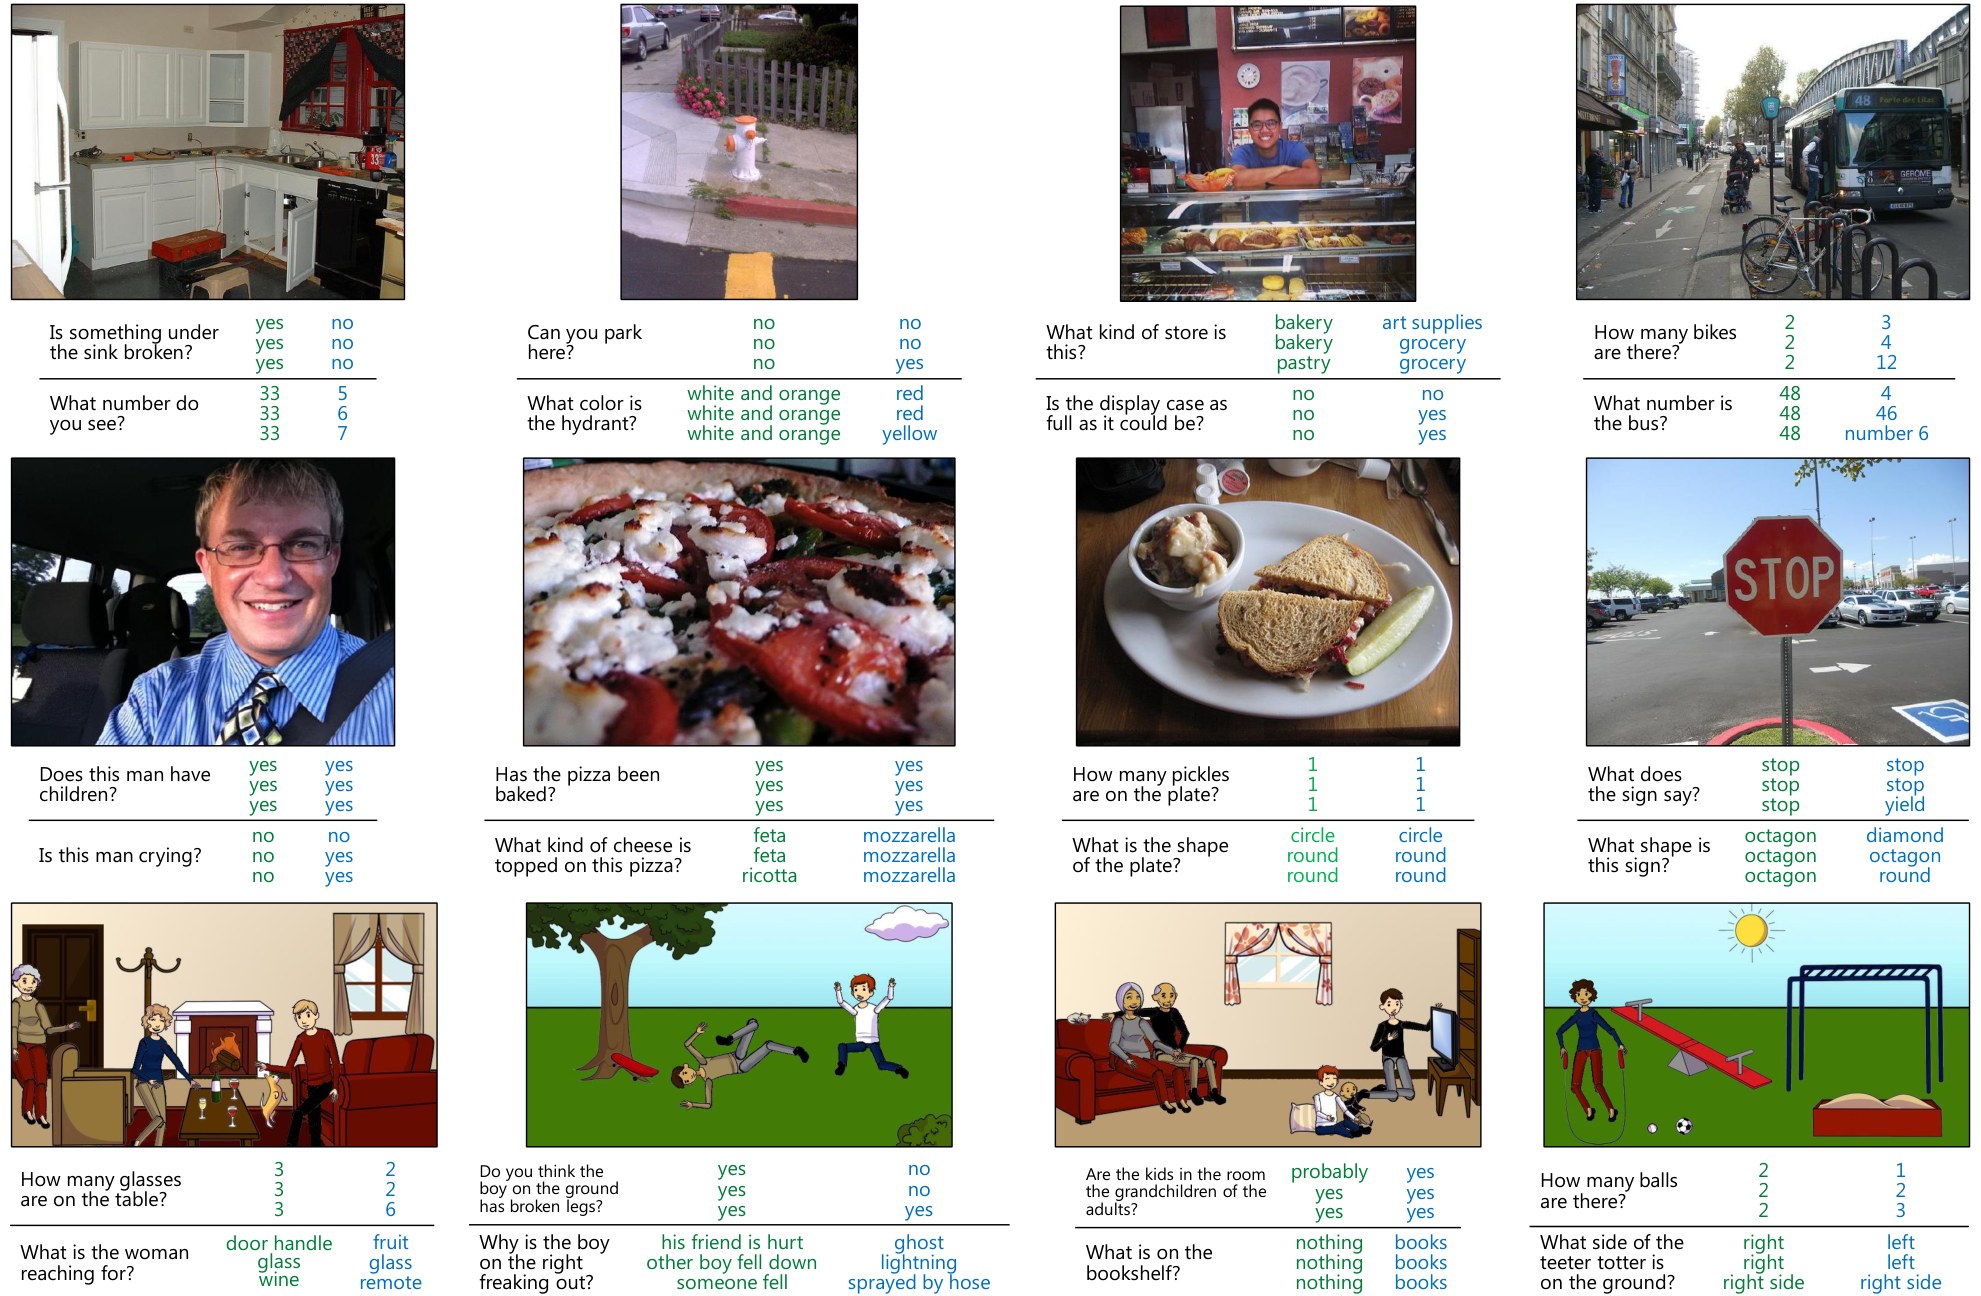
Fig. 2: Examples of questions (black), (a subset of the) answers given when looking at the image (green), and answers given when not looking at the image (blue) for numerous representative examples of the dataset. See the appendix for more examples.
图 2:数据集中大量有代表性的例子:问题(黑色),看见图像时给出的(一部分)答案(绿色),以及不看图像时给出的答案(蓝色)。更多例子见附录。
We now describe the Visual Question Answering (VQA) dataset. We begin by describing the real images and abstract scenes used to collect the questions. Next, we describe our process of collecting questions and their corresponding answers. Analysis of the questions and answers gathered as well as baselines’ & methods’ results are provided in following sections.
我们现在描述视觉问答(VQA)数据集。先说明用来收集问题的真实图像和抽象场景,再说明收集问题及其对应答案的过程。对所收集问题与答案的分析,以及基线与方法的结果,在后面几节给出。
Real Images. We use the 123,287 training and validation images and 81,434 test images from the newly-released Microsoft Common Objects in Context (MS COCO) [32] dataset. The MS COCO dataset was gathered to find images containing multiple objects and rich contextual information. Given the visual complexity of these images, they are well-suited for our VQA task. The more diverse our collection of images, the more diverse, comprehensive, and interesting the resultant set of questions and their answers.
真实图像。 我们使用新发布的 Microsoft Common Objects in Context(MS COCO)[32] 数据集中的 123,287 张训练与验证图像,以及 81,434 张测试图像。MS COCO 数据集的收集目标,是找到包含多个物体和丰富语境信息的图像。鉴于这些图像的视觉复杂性,它们很适合我们的 VQA 任务。图像集合越多样,由此产生的问题及其答案也会越多样、全面、有趣。
Abstract Scenes. The VQA task with real images requires the use of complex and often noisy visual recognizers. To attract researchers interested in exploring the high-level reasoning required for VQA, but not the low-level vision tasks, we create a new abstract scenes dataset [2, 57, 58, 59] containing 50K scenes. The dataset contains 20 “paperdoll” human models [2] spanning genders, races, and ages with 8 different expressions. The limbs are adjustable to allow for continuous pose variations. The clipart may be used to depict both indoor and outdoor scenes. The set contains over 100 objects and 31 animals in various poses. The use of this clipart enables the creation of more realistic scenes (see bottom row of Fig. 2) that more closely mirror real images than previous papers [57, 58, 59]. See the appendix for the user interface, additional details, and examples.
抽象场景。 在真实图像上做 VQA,需要使用复杂且往往有噪声的视觉识别器。为了吸引那些希望探索 VQA 所需高层推理、但不想处理底层视觉任务的研究者,我们创建了一个包含 5 万个场景的新抽象场景数据集 [2, 57, 58, 59]。该数据集包含 20 个“纸娃娃”人体模型 [2],覆盖不同性别、种族和年龄,并有 8 种不同表情。肢体可调,以允许连续的姿势变化。这些剪贴画既可用来描绘室内场景,也可描绘室外场景。集合中有一百多种物体,以及 31 种处于各种姿势的动物。使用这些剪贴画,可以创建比以往论文 [57, 58, 59] 更接近真实图像的逼真场景(见图 2 底行)。用户界面、更多细节和示例见附录。
Splits. For real images, we follow the same train/val/test split strategy as the MC COCO dataset [32] (including test-dev, test-standard, test-challenge, test-reserve). For the VQA challenge (see section VI), test-dev is used for debugging and validation experiments and allows for unlimited submission to the evaluation server. Test-standard is the ‘default’ test data for the VQA competition. When comparing to the state of the art (e.g., in papers), results should be reported on test-standard. Test-standard is also used to maintain a public leaderboard that is updated upon submission. Test-reserve is used to protect against possible overfitting. If there are substantial differences between a method’s scores on test-standard and test-reserve, this raises a red-flag and prompts further investigation. Results on test-reserve are not publicly revealed. Finally, test-challenge is used to determine the winners of the challenge.
划分。 对真实图像,我们沿用与 MS COCO 数据集 [32] 相同的训练/验证/测试划分策略(包括 test-dev、test-standard、test-challenge、test-reserve)。对 VQA 挑战赛(见第 VI 节),test-dev 用于调试和验证实验,并允许向评测服务器无限次提交。Test-standard 是 VQA 竞赛的“默认”测试数据。与最先进方法比较时(例如在论文中),结果应在 test-standard 上报告。Test-standard 也用于维护一个在提交后更新的公开排行榜。Test-reserve 用来防范可能的过拟合。如果一种方法在 test-standard 和 test-reserve 上的分数有实质性差异,这就会拉响警报并促使进一步调查。Test-reserve 上的结果不对外公开。最后,test-challenge 用来决定挑战赛的优胜者。
For abstract scenes, we created splits for standardization, separating the scenes into 20K/10K/20K for train/val/test splits, respectively. There are no subsplits (test-dev, test-standard, test-challenge, test-reserve) for abstract scenes.
对抽象场景,我们为了标准化创建了划分,把场景分别分成 20K/10K/20K 作为训练/验证/测试集。抽象场景没有再分子划分(test-dev、test-standard、test-challenge、test-reserve)。
Captions. The MS COCO dataset [32, 7] already contains five single-sentence captions for all images. We also collected five single-captions for all abstract scenes using the same user interface[^1] for collection.
描述。 MS COCO 数据集 [32, 7] 已经为所有图像提供了五条单句描述。我们也用相同的收集用户界面[^1],为所有抽象场景收集了五条单句描述。
Questions. Collecting interesting, diverse, and well-posed questions is a significant challenge. Many simple questions may only require low-level computer vision knowledge, such as “What color is the cat?” or “How many chairs are present in the scene?”. However, we also want questions that require commonsense knowledge about the scene, such as “What sound does the pictured animal make?”. Importantly, questions should also require the image to correctly answer and not be answerable using just commonsense information, e.g., in Fig. 1, “What is the mustache made of?”. By having a wide variety of question types and difficulty, we may be able to measure the continual progress of both visual understanding and commonsense reasoning.
问题。 收集有趣、多样且措辞得当的问题,本身就是一项重要挑战。许多简单问题可能只需要底层计算机视觉知识,例如“猫是什么颜色?”或“场景中有几把椅子?”。然而,我们也希望有需要关于场景的常识的问题,例如“图中的动物会发出什么声音?”。重要的是,问题还应当必须借助图像才能正确回答,而不能仅凭常识作答,例如图 1 中的“胡子是用什么做的?”。通过拥有种类和难度都很广的问题,我们也许能够衡量视觉理解和常识推理的持续进展。
We tested and evaluated a number of user interfaces for collecting such “interesting” questions. Specifically, we ran pilot studies asking human subjects to ask questions about a given image that they believe a “toddler”, “alien”, or “smart robot” would have trouble answering. We found the “smart robot” interface to elicit the most interesting and diverse questions. As shown in the appendix, our final interface stated:
我们测试并评估了多种用于收集这类“有趣”问题的用户界面。具体来说,我们做了预实验,请人类受试者针对给定图像提问,这些问题是他们相信“幼儿”、“外星人”或“聪明机器人”会难以回答的。我们发现,“聪明机器人”界面引出的问题最有趣、也最多样。如附录所示,我们最终的界面写道:
“We have built a smart robot. It understands a lot about images. It can recognize and name all the objects, it knows where the objects are, it can recognize the scene (e.g., kitchen, beach), people’s expressions and poses, and properties of objects (e.g., color of objects, their texture). Your task is to stump this smart robot! Ask a question about this scene that this smart robot probably can not answer, but any human can easily answer while looking at the scene in the image.”
“我们建造了一个聪明机器人。它对图像了解很多。它能识别并说出所有物体的名字,知道物体在哪里,能识别场景(例如厨房、海滩)、人的表情和姿势,以及物体的属性(例如物体的颜色、质地)。你的任务是难倒这个聪明机器人!请就这一场景提一个问题:这个聪明机器人很可能答不上来,但任何人看着图像中的场景都能轻松回答。”
To bias against generic image-independent questions, subjects were instructed to ask questions that require the image to answer.
为了抑制与图像无关的一般性问题,受试者被要求提出必须借助图像才能回答的问题。
The same user interface was used for both the real images and abstract scenes. In total, three questions from unique workers were gathered for each image/scene. When writing a question, the subjects were shown the previous questions already asked for that image to increase the question diversity. In total, the dataset contains over 0.76M questions.
真实图像和抽象场景使用了相同的用户界面。每张图像/每个场景总共由不同工人收集了三个问题。在写问题时,会向受试者展示该图像上已经提出的先前问题,以增加问题的多样性。总计,该数据集包含超过约 76 万个问题。
Answers. Open-ended questions result in a diverse set of possible answers. For many questions, a simple “yes” or “no” response is sufficient. However, other questions may require a short phrase. Multiple different answers may also be correct. For instance, the answers “white”, “tan”, or “off-white” may all be correct answers to the same question. Human subjects may also disagree on the “correct” answer, e.g., some saying “yes” while others say “no”. To handle these discrepancies, we gather 10 answers for each question from unique workers, while also ensuring that the worker answering a question did not ask it. We ask the subjects to provide answers that are “a brief phrase and not a complete sentence. Respond matter-of-factly and avoid using conversational language or inserting your opinion.” In addition to answering the questions, the subjects were asked “Do you think you were able to answer the question correctly?” and given the choices of “no”, “maybe”, and “yes”. See the appendix for more details about the user interface to collect answers. See Section IV for an analysis of the answers provided.
答案。 开放式问题会带来多样的可能答案。对许多问题,简单的“是”或“否”就足够了。然而,其他问题可能需要一个短短语。多个不同答案也可能都正确。例如,“白色”、“茶色”或“灰白”都可能是同一问题的正确答案。人类受试者也可能在“正确”答案上意见不一,例如有人说“是”,有人说“否”。为处理这些差异,我们为每个问题从不同工人那里收集10 条答案,并确保回答某一问题的工人不是提出该问题的人。我们请受试者给出“简短短语而不是完整句子。如实回答,避免使用口语,也不要插入你的意见。”除了回答问题,受试者还被问到“你认为自己答对了吗?”,并给出“否”、“也许”和“是”三个选项。收集答案的用户界面的更多细节见附录。对所给答案的分析见第 IV 节。
For testing, we offer two modalities for answering the questions: (i) open-ended and (ii) multiple-choice.
在测试时,我们提供两种作答方式:(i) 开放式 和 (ii) 选择题。
For the open-ended task, the generated answers are evaluated using the following accuracy metric:
对开放式任务,生成的答案用下面的准确率指标来评测:
i.e., an answer is deemed 100% accurate if at least 3 workers provided that exact answer.[^2] Before comparison, all responses are made lowercase, numbers converted to digits, and punctuation & articles removed. We avoid using soft metrics such as Word2Vec [39], since they often group together words that we wish to distinguish, such as “left” and “right”. We also avoid using evaluation metrics from machine translation such as BLEU and ROUGE because such metrics are typically applicable and reliable for sentences containing multiple words. In VQA, most answers (89.32%) are single word; thus there no high-order n-gram matches between predicted answers and ground-truth answers, and low-order n-gram matches degenerate to exact-string matching. Moreover, these automatic metrics such as BLEU and ROUGE have been found to poorly correlate with human judgement for tasks such as image caption evaluation [6].
也就是说,如果至少有 3 名工人给出了那个完全相同的答案,该答案就被视为 100% 准确。[^2] 在比较之前,所有回答都转为小写,数字转为数码,标点与冠词被去掉。我们避免使用 Word2Vec [39] 这类软指标,因为它们常常把我们希望区分的词归到一起,例如“左”和“右”。我们也避免使用 BLEU 和 ROUGE 这类机器翻译评测指标,因为这类指标通常适用于、并且在含有多个词的句子上才比较可靠。在 VQA 中,大多数答案(89.32%)都是单词;因此预测答案与标准答案之间没有高阶 n-gram 匹配,而低阶 n-gram 匹配会退化成精确字符串匹配。此外,BLEU 和 ROUGE 这类自动指标,在图像描述评测等任务上已被发现与人类判断相关很差 [6]。
For multiple-choice task, 18 candidate answers are created for each question. As with the open-ended task, the accuracy of a chosen option is computed based on the number of human subjects who provided that answer (divided by 3 and clipped at 1). We generate a candidate set of correct and incorrect answers from four sets of answers: Correct: The most common (out of ten) correct answer. Plausible: To generate incorrect, but still plausible answers we ask three subjects to answer the questions without seeing the image. See the appendix for more details about the user interface to collect these answers. If three unique answers are not found, we gather additional answers from nearest neighbor questions using a bag-of-words model. The use of these answers helps ensure the image, and not just commonsense knowledge, is necessary to answer the question. Popular: These are the 10 most popular answers. For instance, these are “yes”, “no”, “2”, “1”, “white”, “3”, “red”, “blue”, “4”, “green” for real images. The inclusion of the most popular answers makes it more difficult for algorithms to infer the type of question from the set of answers provided, i.e., learning that it is a “yes or no” question just because “yes” and “no” are present in the answers. Random: Correct answers from random questions in the dataset. To generate a total of 18 candidate answers, we first find the union of the correct, plausible, and popular answers. We include random answers until 18 unique answers are found. The order of the answers is randomized. Example multiple choice questions are in the appendix.
对选择题任务,每个问题创建 18 个候选答案。与开放式任务一样,所选选项的准确率根据给出该答案的人类受试者人数来计算(除以 3 并在 1 处截断)。我们从四组答案中生成正确与错误候选集合:正确: 十个正确答案中最常见的那个。似是而非: 为了生成错误但仍合理的答案,我们请三名受试者在不看图像的情况下回答问题。收集这些答案的用户界面的更多细节见附录。如果找不到三个互不相同的答案,我们就用词袋模型,从近邻问题中再收集额外答案。使用这些答案有助于确保必须借助图像、而不能只靠常识来回答问题。流行: 这是 10 个最常见的答案。例如,对真实图像,它们是 “yes”、“no”、“2”、“1”、“white”、“3”、“red”、“blue”、“4”、“green”。纳入最流行的答案,会让算法更难从所给答案集合推断问题类型,也就是说,不能仅仅因为答案里有 “yes” 和 “no”,就学会这是一道“是否”题。随机: 来自数据集中随机问题的正确答案。为了生成总共 18 个候选答案,我们先取正确、似是而非和流行答案的并集。再加入随机答案,直到找到 18 个互不相同的答案。答案顺序是随机打乱的。选择题示例见附录。
Note that all 18 candidate answers are unique. But since 10 different subjects answered every question, it is possible that more than one of those 10 answers be present in the 18 choices. In such cases, according to the accuracy metric, multiple options could have a non-zero accuracy.
请注意,全部 18 个候选答案都是互不相同的。但由于每个问题都有 10 名不同受试者作答,这 10 个答案中有可能不止一个出现在 18 个选项里。在这种情形下,按准确率指标,多个选项都可能有非零准确率。
IV VQA Dataset Analysis
IV VQA 数据集分析
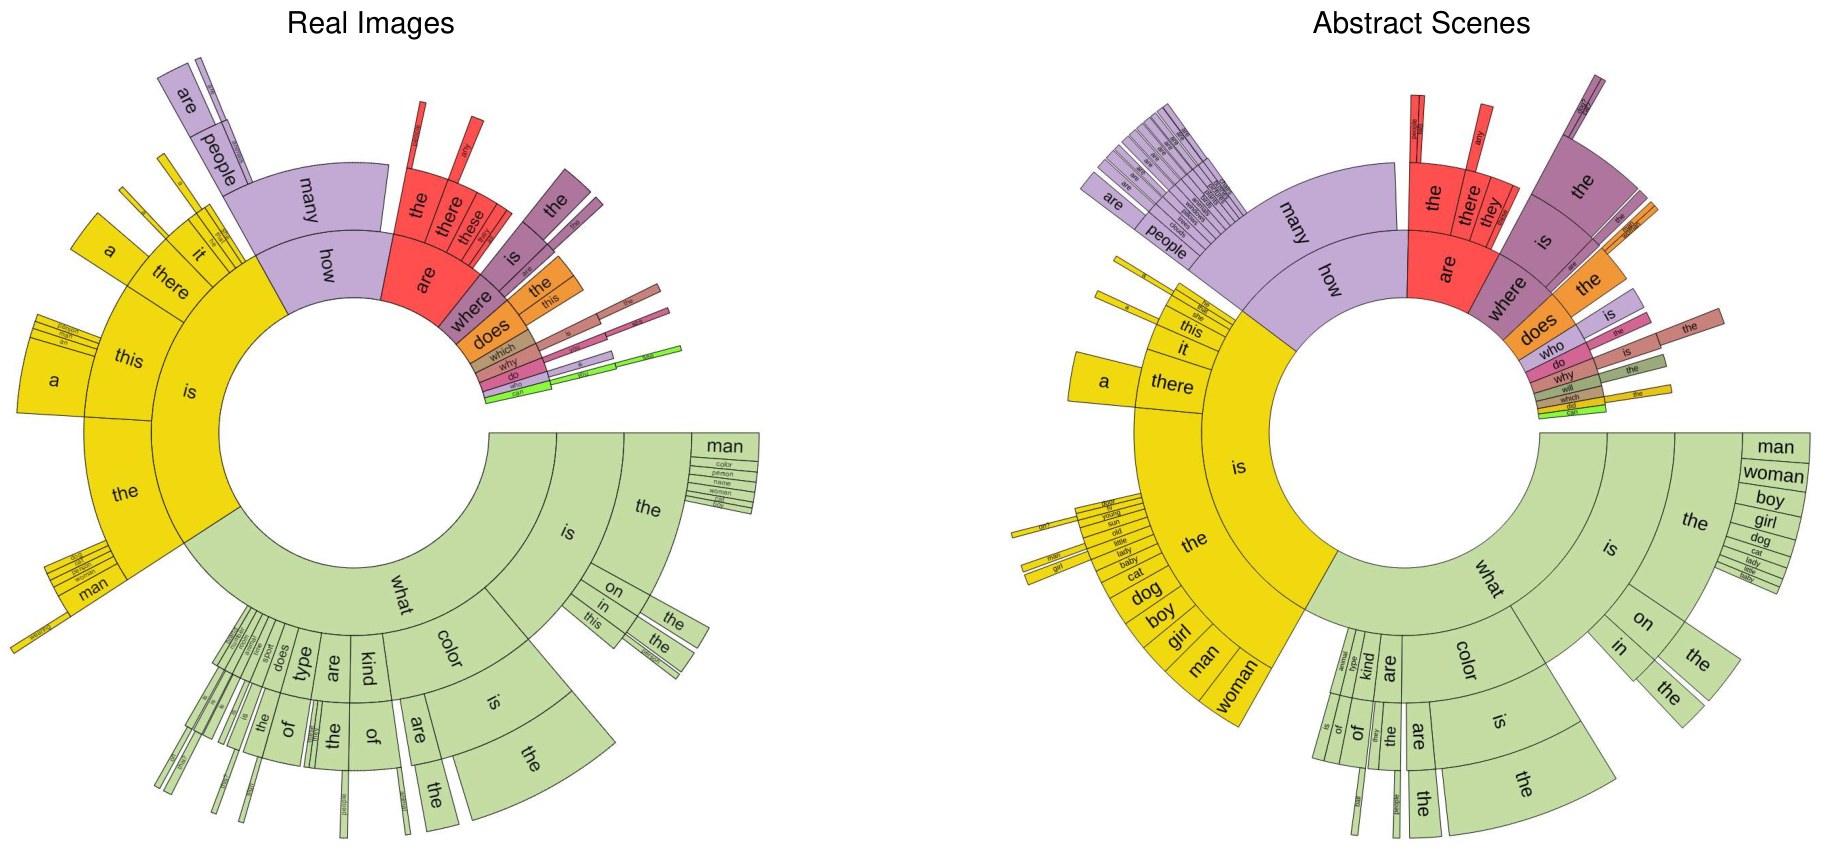
Fig. 3: Distribution of questions by their first four words for a random sample of 60K questions for real images (left) and all questions for abstract scenes (right). The ordering of the words starts towards the center and radiates outwards. The arc length is proportional to the number of questions containing the word. White areas are words with contributions too small to show.
图 3:按问题前四个词划分的问题分布。左边是真实图像上随机抽取的 6 万个问题,右边是抽象场景的全部问题。词的顺序从中心开始向外辐射。弧长与包含该词的问题数成正比。白色区域是贡献太小、无法显示的词。
In this section, we provide an analysis of the questions and answers in the VQA train dataset. To gain an understanding of the types of questions asked and answers provided, we visualize the distribution of question types and answers. We also explore how often the questions may be answered without the image using just commonsense information. Finally, we analyze whether the information contained in an image caption is sufficient to answer the questions.
在这一节中,我们对 VQA 训练数据集中的问题和答案进行分析。为了理解所提问题的类型和所给答案的类型,我们可视化了问题类型和答案的分布。我们也探讨了仅凭常识、不看图像就能回答问题的频率。最后,我们分析一张图像描述中所含的信息是否足以回答这些问题。
The dataset includes 614,163 questions and 7,984,119 answers (including answers provided by workers with and without looking at the image) for 204,721 images from the MS COCO dataset [32] and 150,000 questions with 1,950,000 answers for abstract scenes.
该数据集包括来自 MS COCO 数据集 [32] 的 204,721 张图像上的 614,163 个问题和 7,984,119 条答案(包括工人在看图和不看图时给出的答案),以及 50,000 个抽象场景上的 150,000 个问题和 1,950,000 条答案。
IV-A Questions
IV-A 问题
Types of Question. Given the structure of questions generated in the English language, we can cluster questions into different types based on the words that start the question. Fig. 3 shows the distribution of questions based on the first four words of the questions for both the real images (left) and abstract scenes (right). Interestingly, the distribution of questions is quite similar for both real images and abstract scenes. This helps demonstrate that the type of questions elicited by the abstract scenes is similar to those elicited by the real images. There exists a surprising variety of question types, including “What is”, “Is there”, “How many”, and “Does the”. Quantitatively, the percentage of questions for different types is shown in Table III. Several example questions and answers are shown in Fig. 2. A particularly interesting type of question is the “What is” questions, since they have a diverse set of possible answers. See the appendix for visualizations for “What is” questions.
问题类型。 鉴于英语中生成问题的结构,我们可以根据问题开头的词,把问题聚类成不同类型。图 3 给出了真实图像(左)和抽象场景(右)上,按问题前四个词划分的问题分布。有意思的是,真实图像和抽象场景的问题分布相当相似。这有助于说明,抽象场景引出的问题类型与真实图像引出的问题类型是相近的。问题类型出人意料地多样,包括 “What is…”、“Is there…”、“How many…” 和 “Does the…”。表 III 定量给出了不同类型问题的百分比。若干问题和答案的示例见图 2。一类特别有意思的问题是 “What is…” 问题,因为它们有多种多样的可能答案。“What is…” 问题的可视化见附录。
Lengths. Fig. 4 shows the distribution of question lengths. We see that most questions range from four to ten words.
长度。 图 4 给出了问题长度的分布。可以看到,大多数问题在四个词到十个词之间。
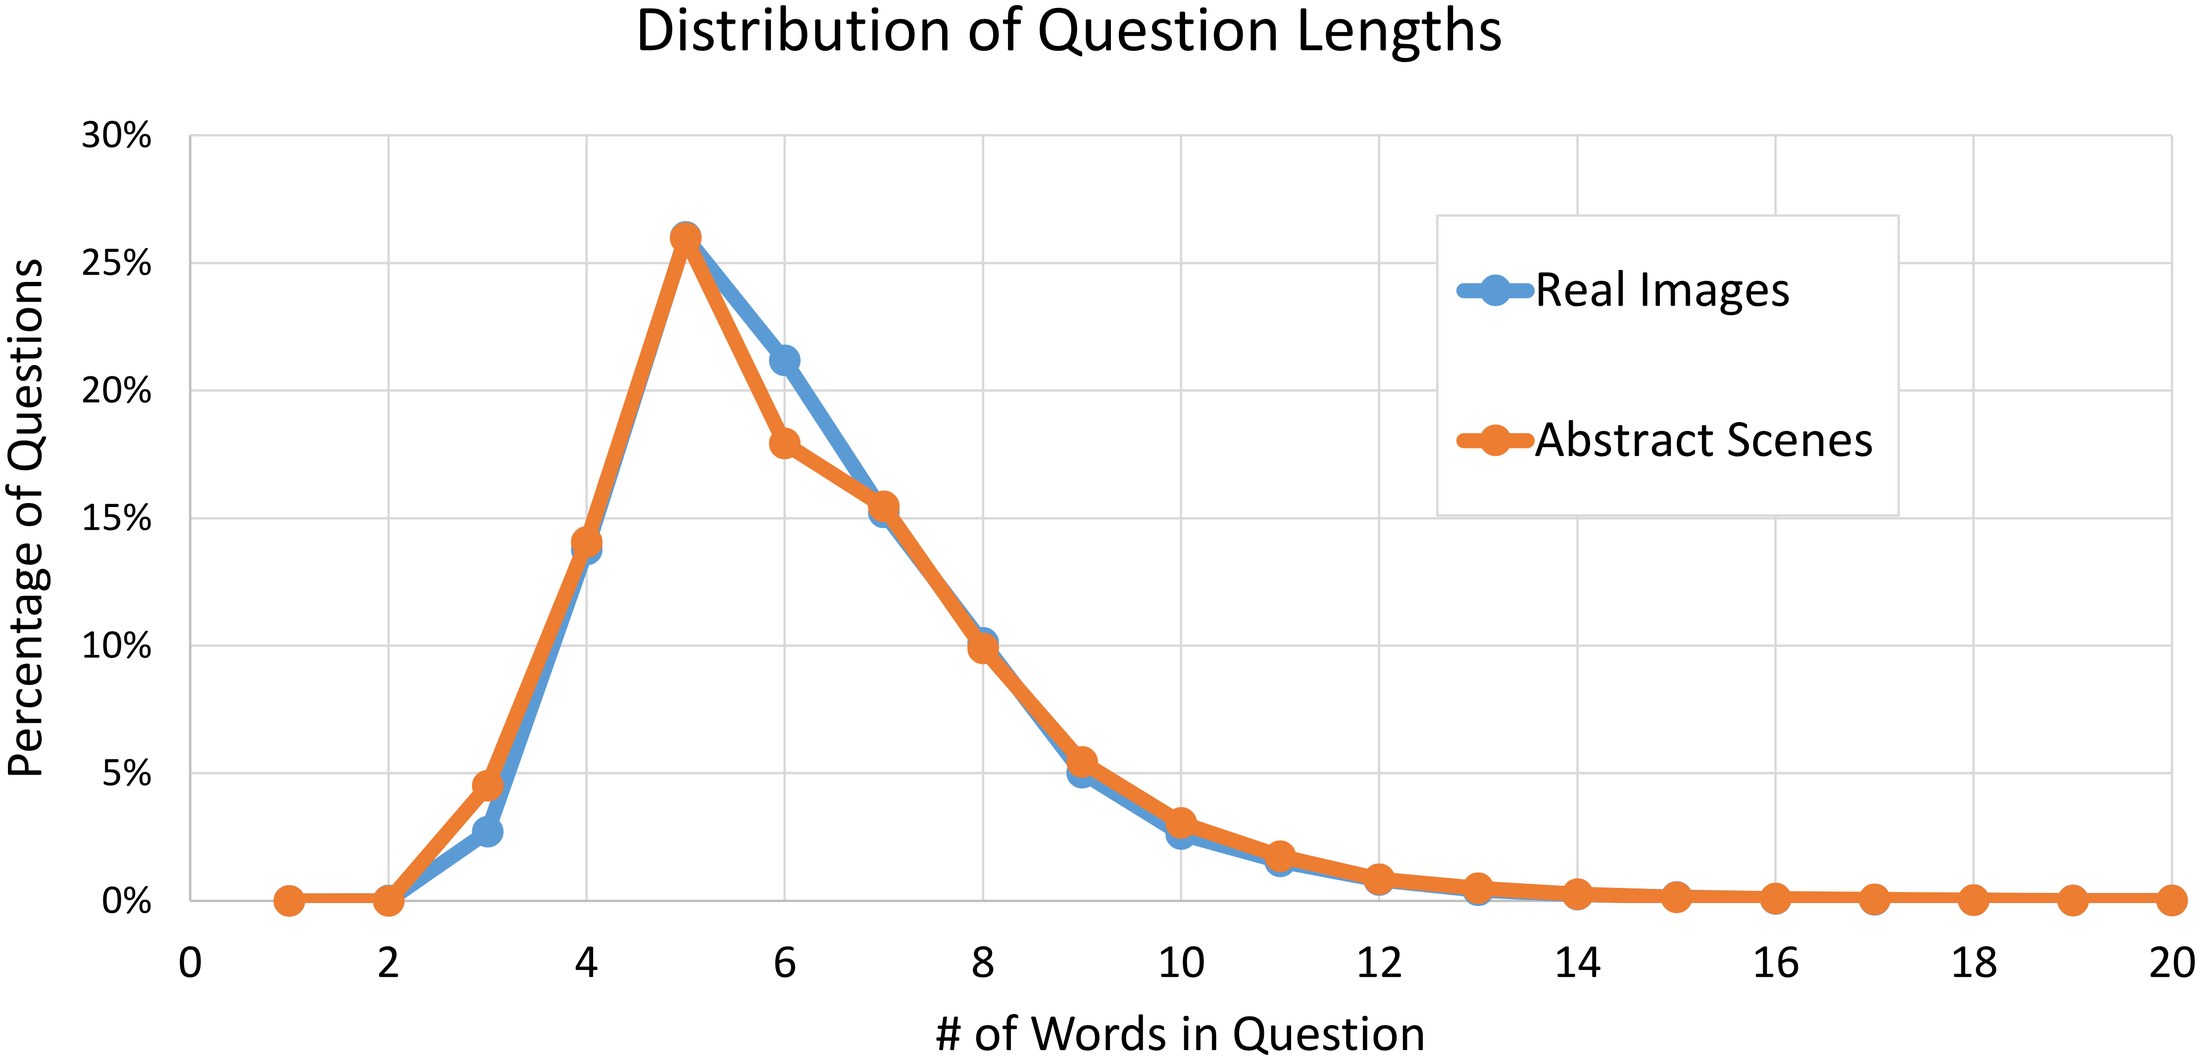
Fig. 4: Percentage of questions with different word lengths for real images and abstract scenes.
图 4:真实图像和抽象场景中,不同词长的问题所占百分比。
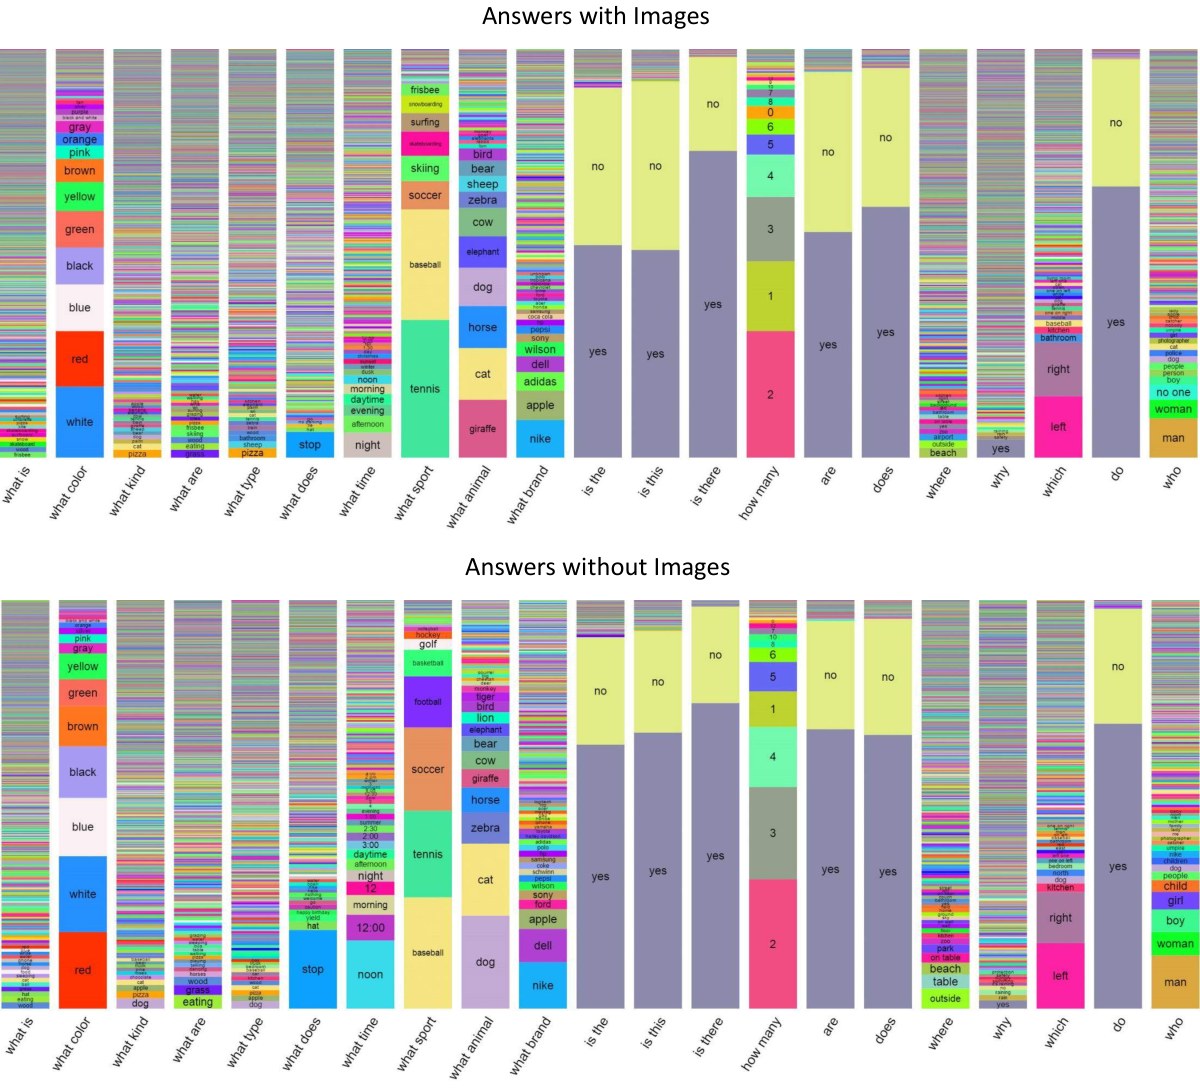
Fig. 5: Distribution of answers per question type for a random sample of 60K questions for real images when subjects provide answers when given the image (top) and when not given the image (bottom).
图 5:真实图像上随机抽取的 6 万个问题中,按问题类型划分的答案分布。上图是受试者在看到图像时给出的答案,下图是未看到图像时给出的答案。
IV-B Answers
IV-B 答案
Typical Answers. Fig. 5 (top) shows the distribution of answers for several question types. We can see that a number of question types, such as “Is the…”, “Are…”, and “Does…” are typically answered using “yes” and “no” as answers. Other questions such as “What is…” and “What type…” have a rich diversity of responses. Other question types such as “What color…” or “Which…” have more specialized responses, such as colors, or “left” and “right”. See the appendix for a list of the most popular answers.
典型答案。 图 5(上)给出了若干问题类型的答案分布。可以看到,一些类型的问题,例如 “Is the…”、“Are…” 和 “Does…”,通常用 “yes” 和 “no” 来回答。其他问题,例如 “What is…” 和 “What type…”,则有丰富多样的回答。还有一些类型,例如 “What color…” 或 “Which…”,回答更为专门,例如颜色,或 “left” 和 “right”。最流行的答案列表见附录。
Lengths. Most answers consist of a single word, with the distribution of answers containing one, two, or three words, respectively being , , and for real images and , , and for abstract scenes. The brevity of answers is not surprising, since the questions tend to elicit specific information from the images. This is in contrast with image captions that generically describe the entire image and hence tend to be longer. The brevity of our answers makes automatic evaluation feasible. While it may be tempting to believe the brevity of the answers makes the problem easier, recall that they are human-provided open-ended answers to open-ended questions. The questions typically require complex reasoning to arrive at these deceptively simple answers (see Fig. 2). There are currently 23,234 unique one-word answers in our dataset for real images and 3,770 for abstract scenes.
长度。 大多数答案由一个词组成:含有一个、两个或三个词的答案比例,在真实图像上分别是 、 和 ,在抽象场景上分别是 、 和 。答案简短并不令人惊讶,因为这些问题往往是在向图像索取具体信息。这与泛泛描述整张图像、因而往往更长的图像描述形成对照。答案简短,使自动评测变得可行。虽然人们也许会倾向于认为答案简短让问题更容易,但请记住,它们是人对开放式问题给出的开放式答案。这些问题通常需要复杂推理,才能得到这些看似简单的答案(见图 2)。目前,我们的数据集中真实图像有 23,234 个互不相同的单词答案,抽象场景有 3,770 个。
‘Yes/No’ and ‘Number’ Answers. Many questions are answered using either “yes” or “no” (or sometimes “maybe”) – and of the questions on real images and abstract scenes respectively. Among these ‘yes/no’ questions, there is a bias towards “yes” – and of ‘yes/no’ answers are “yes” for real images and abstract scenes. Question types such as “How many…” are answered using numbers – and of the questions on real images and abstract scenes are ‘number’ questions. “2” is the most popular answer among the ‘number’ questions, making up of the ‘number’ answers for real images and for abstract scenes.
“是否”与“数字”答案。 许多问题用 “yes” 或 “no”(有时是 “maybe”)来回答——在真实图像和抽象场景上分别占问题的 和 。在这些“是否”问题中,存在偏向 “yes” 的倾向——真实图像和抽象场景上,“是否”答案中分别有 和 是 “yes”。像 “How many…” 这类问题用数字来回答——真实图像和抽象场景上分别有 和 的问题是“数字”问题。在“数字”问题中,最流行的答案是 “2”,在真实图像和抽象场景的“数字”答案中分别占 和 。
Subject Confidence. When the subjects answered the questions, we asked “Do you think you were able to answer the question correctly?”. Fig. 6 shows the distribution of responses. A majority of the answers were labeled as confident for both real images and abstract scenes.
受试者自信度。 受试者回答问题时,我们问“你认为自己答对了吗?”。图 6 给出了回答的分布。对真实图像和抽象场景,大多数答案都被标为自信。
Inter-human Agreement. Does the self-judgment of confidence correspond to the answer agreement between subjects? Fig. 6 shows the percentage of questions in which (i) or more, (ii) , or (iii) less than subjects agree on the answers given their average confidence score (0 = not confident, 1 = confident). As expected, the agreement between subjects increases with confidence. However, even if all of the subjects are confident the answers may still vary. This is not surprising since some answers may vary, yet have very similar meaning, such as “happy” and “joyful”.
人与人之间的一致。 自信度的自我判断,是否对应于受试者之间的答案一致?图 6 给出了在给定平均自信分数(0 = 不自信,1 = 自信)时,(i) 7 人或以上、(ii) 3–7 人、或 (iii) 少于 3 人在答案上一致的问题百分比。正如所预期的,受试者之间的一致性随自信度上升。然而,即便所有受试者都很自信,答案仍可能不同。这并不奇怪,因为有些答案可能不同,但含义非常接近,例如 “happy” 和 “joyful”。
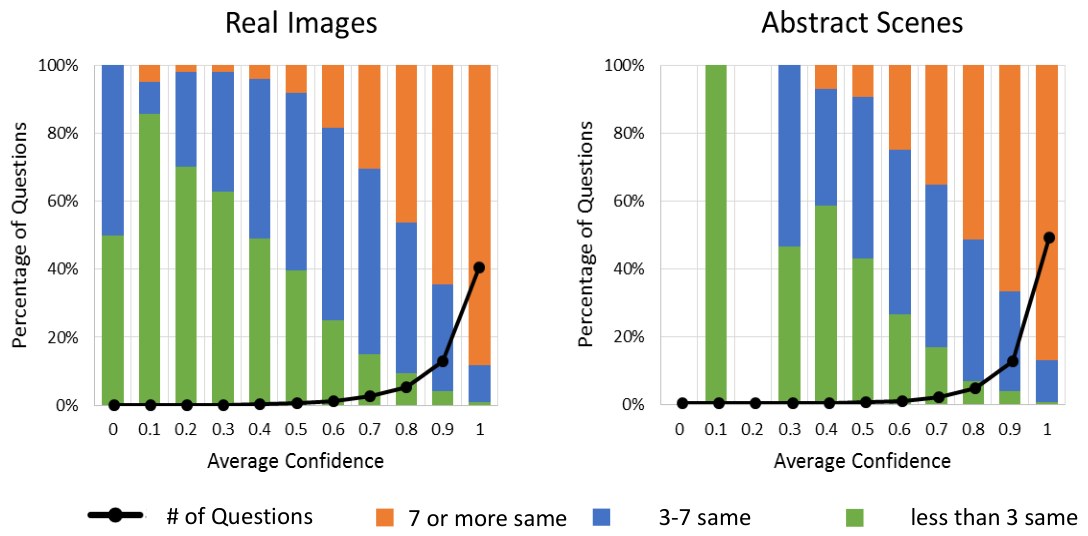
Fig. 6: Number of questions per average confidence score (0 = not confident, 1 = confident) for real images and abstract scenes (black lines). Percentage of questions where 7 or more answers are same, 3-7 are same, less than 3 are same (color bars).
图 6:真实图像和抽象场景上,按平均自信分数(0 = 不自信,1 = 自信)统计的问题数(黑线)。以及 7 个或更多答案相同、3–7 个相同、少于 3 个相同的问题百分比(彩色条)。
As shown in Table I (Question + Image), there is significant inter-human agreement in the answers for both real images () and abstract scenes (). Note that on average each question has unique answers for real images and for abstract scenes. The agreement is significantly higher () for “yes/no” questions and lower for other questions (), possibly due to the fact that we perform exact string matching and do not account for synonyms, plurality, etc. Note that the automatic determination of synonyms is a difficult problem, since the level of answer granularity can vary across questions.
如表 I(问题 + 图像)所示,真实图像()和抽象场景()上的答案都有显著的人与人一致。注意,平均每个问题在真实图像上有 个互不相同的答案,在抽象场景上有 个。对“是否”问题,一致性显著更高(),对其他问题则较低(),这可能是因为我们做精确字符串匹配,没有考虑同义词、单复数等。需要注意,自动判定同义词是一个困难问题,因为不同问题的答案粒度可能不同。
IV-C Commonsense Knowledge
IV-C 常识
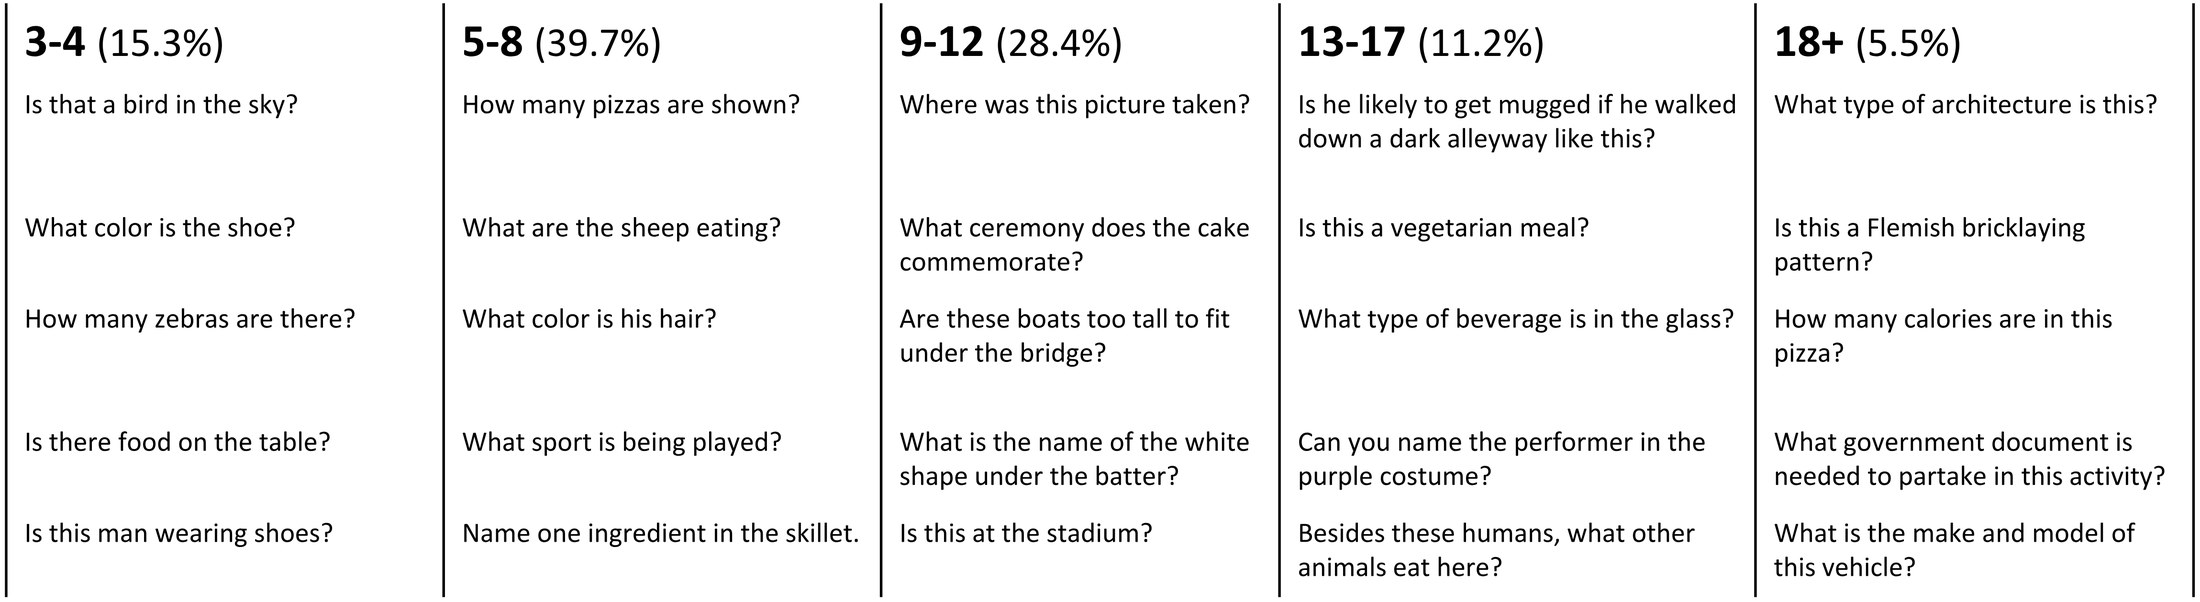
Fig. 7: Example questions judged by Mturk workers to be answerable by different age groups. The percentage of questions falling into each age group is shown in parentheses.
图 7:被 Mechanical Turk 工人判定为可由不同年龄组回答的问题示例。落入每个年龄组的问题百分比在括号中给出。
Is the Image Necessary? Clearly, some questions can sometimes be answered correctly using commonsense knowledge alone without the need for an image, e.g., “What is the color of the fire hydrant?”. We explore this issue by asking three subjects to answer the questions without seeing the image (see the examples in blue in Fig. 2). In Table I (Question), we show the percentage of questions for which the correct answer is provided over all questions, “yes/no” questions, and the other questions that are not “yes/no”. For “yes/no” questions, the human subjects respond better than chance. For other questions, humans are only correct about of the time. This demonstrates that understanding the visual information is critical to VQA and that commonsense information alone is not sufficient.
图像是必要的吗? 显然,有些问题有时可以只靠常识、不必看图就答对,例如“消防栓是什么颜色?”。我们通过请三名受试者在不看图像的情况下回答问题来探讨这一点(见图 2 中蓝色的例子)。在表 I(问题)中,我们给出了在全部问题、“是否”问题、以及其他非“是否”问题上提供正确答案的百分比。对“是否”问题,人类受试者的回答好于随机。对其他问题,人类大约只有 的时候是正确的。这说明理解视觉信息对 VQA 至关重要,仅靠常识是不够的。
To show the qualitative difference in answers provided with and without images, we show the distribution of answers for various question types in Fig. 5 (bottom). The distribution of colors, numbers, and even “yes/no” responses is surprisingly different for answers with and without images.
为了展示有图和无图时给出的答案在性质上的差别,我们在图 5(下)中给出了各种问题类型的答案分布。颜色、数字、甚至“是否”回答的分布,在有图和无图时出人意料地不同。
Which Questions Require Common Sense? In order to identify questions that require commonsense reasoning to answer, we conducted two AMT studies (on a subset 10K questions from the real images of VQA trainval) asking subjects –
哪些问题需要常识? 为了识别需要常识推理才能回答的问题,我们做了两项 AMT 研究(在 VQA trainval 真实图像的 1 万个问题子集上),请受试者:
- Whether or not they believed a question required commonsense to answer the question, and
- 他们认为一个问题是否需要常识才能回答,以及
- The youngest age group that they believe a person must be in order to be able to correctly answer the question – toddler (3-4), younger child (5-8), older child (9-12), teenager (13-17), adult (18+).
- 他们认为一个人必须属于哪个最小年龄组,才能正确回答该问题——幼儿(3–4 岁)、年幼儿童(5–8 岁)、年长儿童(9–12 岁)、青少年(13–17 岁)、成人(18 岁以上)。
Each question was shown to 10 subjects. We found that for of questions 3 or more subjects voted ‘yes’ to commonsense, (: 6 or more). In the ‘perceived human age required to answer question’ study, we found the following distribution of responses: toddler: , younger child: , older child: , teenager: , adult: . In Figure 7 we show several questions for which a majority of subjects picked the specified age range. Surprisingly the perceived age needed to answer the questions is fairly well distributed across the different age ranges. As expected the questions that were judged answerable by an adult (18+) generally need specialized knowledge, whereas those answerable by a toddler (3-4) are more generic.
每个问题展示给 10 名受试者。我们发现,对 的问题,有 3 名或更多受试者对常识投了“是”(:6 名或更多)。在“感知到的、正确回答问题所需的人类年龄”研究中,我们得到如下回答分布:幼儿:,年幼儿童:,年长儿童:,青少年:,成人:。在图 7 中,我们给出了若干多数受试者选定特定年龄段的问题。令人惊讶的是,感知到的回答问题所需年龄,在不同年龄段上分布得相当均匀。正如所预期的,被判定为成人(18 岁以上)可答的问题一般需要专门知识,而被判定为幼儿(3–4 岁)可答的问题则更为一般。
We measure the degree of commonsense required to answer a question as the percentage of subjects (out of 10) who voted “yes” in our “whether or not a question requires commonsense” study. A fine-grained breakdown of average age and average degree of common sense (on a scale of ) required to answer a question is shown in Table III. The average age and the average degree of commonsense across all questions is and respectively.
我们把回答一个问题所需的常识程度,度量为我们“一个问题是否需要常识”研究中投“是”的受试者百分比(共 10 人)。表 III 给出了回答一个问题所需的平均年龄和平均常识程度( 分)的细粒度分解。所有问题上的平均年龄和平均常识程度分别是 和 。
It is important to distinguish between:
有必要区分:
- How old someone needs to be to be able to answer a question correctly, and
- 一个人要多大才能正确回答一个问题,以及
- How old people think someone needs to be to be able to answer a question correctly.
- 人们认为一个人要多大才能正确回答一个问题。
Our age annotations capture the latter – perceptions of MTurk workers in an uncontrolled environment. As such, the relative ordering of question types in Table III is more important than absolute age numbers. The two rankings of questions in terms of common sense required according to the two studies were largely correlated (Pearson’s rank correlation: 0.58).
我们的年龄标注捕捉的是后者——未经控制环境下 Mechanical Turk 工人的观感。因此,表 III 中问题类型的相对排序比绝对年龄数字更重要。两项研究按所需常识对问题的两种排序大体相关(Pearson 等级相关:0.58)。
| Dataset | Input | All | Yes/No | Number | Other |
|---|---|---|---|---|---|
| Question | 40.81 | 67.60 | 25.77 | 21.22 | |
| Real | Question + Caption* | 57.47 | 78.97 | 39.68 | 44.41 |
| Question + Image | 83.30 | 95.77 | 83.39 | 72.67 | |
| Question | 43.27 | 66.65 | 28.52 | 23.66 | |
| Abstract | Question + Caption* | 54.34 | 74.70 | 41.19 | 40.18 |
| Question + Image | 87.49 | 95.96 | 95.04 | 75.33 |
TABLE I: Test-standard accuracy of human subjects when asked to answer the question without seeing the image (Question), seeing just a caption of the image and not the image itself (Question + Caption), and seeing the image (Question + Image). Results are shown for all questions, “yes/no” & “number” questions, and other questions that are neither answered “yes/no” nor number. All answers are free-form and not multiple-choice. * These accuracies are evaluated on a subset of 3K train questions (1K images).
| 数据集 | 输入 | 全部 | 是否 | 数字 | 其他 |
|---|---|---|---|---|---|
| 问题 | 40.81 | 67.60 | 25.77 | 21.22 | |
| 真实 | 问题 + 描述* | 57.47 | 78.97 | 39.68 | 44.41 |
| 问题 + 图像 | 83.30 | 95.77 | 83.39 | 72.67 | |
| 问题 | 43.27 | 66.65 | 28.52 | 23.66 | |
| 抽象 | 问题 + 描述* | 54.34 | 74.70 | 41.19 | 40.18 |
| 问题 + 图像 | 87.49 | 95.96 | 95.04 | 75.33 |
表 I:人类受试者在不看图像(问题)、只看图像描述而不看图像本身(问题 + 描述)、以及看见图像(问题 + 图像)时回答问题的 test-standard 准确率。结果分别针对全部问题、“是否”与“数字”问题,以及既不是“是否”也不是数字的其他问题。所有答案都是开放式的,不是选择题。*这些准确率是在 3,000 个训练问题(1,000 张图像)的子集上评测的。
IV-D Captions vs. Questions
IV-D 描述与问题
Do generic image captions provide enough information to answer the questions? Table I (Question + Caption) shows the percentage of questions answered correctly when human subjects are given the question and a human-provided caption describing the image, but not the image. As expected, the results are better than when humans are shown the questions alone. However, the accuracies are significantly lower than when subjects are shown the actual image. This demonstrates that in order to answer the questions correctly, deeper image understanding (beyond what image captions typically capture) is necessary. In fact, we find that the distributions of nouns, verbs, and adjectives mentioned in captions is statistically significantly different from those mentioned in our questions + answers (Kolmogorov-Smirnov test, ) for both real images and abstract scenes. See the appendix for details.
通用的图像描述是否提供了足够的信息来回答这些问题?表 I(问题 + 描述)给出了在人类受试者拿到问题和一条由人提供的、描述该图像的说明、但看不到图像时,正确回答问题的百分比。正如所预期的,结果好于只向人展示问题。然而,这些准确率显著低于向受试者展示实际图像时的结果。这说明,要正确回答这些问题,需要比图像描述通常所捕捉的更深的图像理解。事实上,我们发现描述中提到的名词、动词和形容词的分布,与我们的问题加答案中提到的分布,在统计上有显著差异(Kolmogorov-Smirnov 检验,),真实图像和抽象场景都是如此。细节见附录。
V VQA Baselines and Methods
V VQA 基线与方法
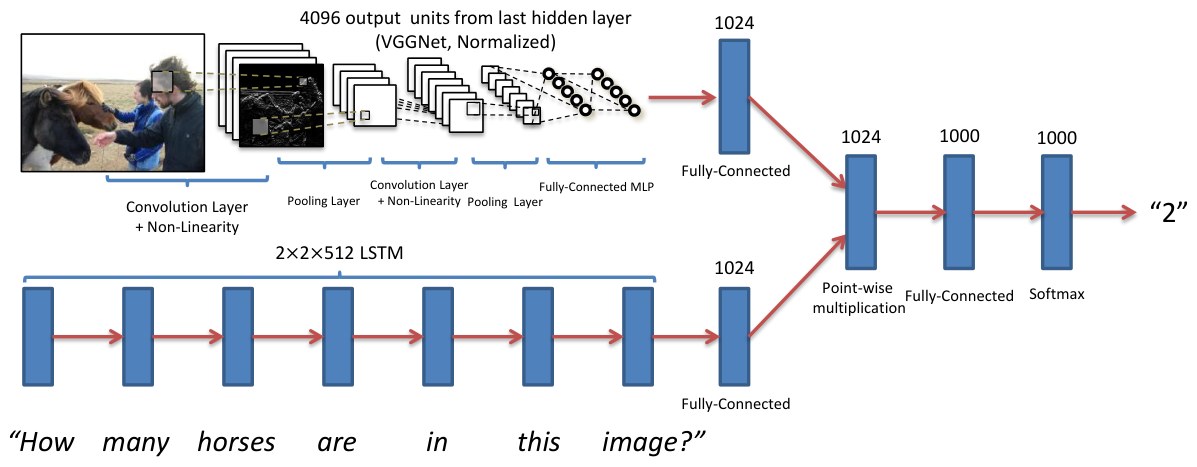
Fig. 8: Our best performing model (deeper LSTM Q + norm I). This model uses a two layer LSTM to encode the questions and the last hidden layer of VGGNet [48] to encode the images. The image features are then normalized. Both the question and image features are transformed to a common space and fused via element-wise multiplication, which is then passed through a fully connected layer followed by a softmax layer to obtain a distribution over answers.
图 8:我们表现最好的模型(更深的 LSTM Q + 归一化 I)。该模型用两层 LSTM 编码问题,用 VGGNet [48] 的最后一个隐层编码图像。图像特征随后做 归一化。问题和图像特征都被变换到同一个空间,再通过逐元素相乘融合,然后经过一个全连接层,再接一个 softmax 层,得到答案上的分布。
In this section, we explore the difficulty of the VQA dataset for the MS COCO images using several baselines and novel methods. We train on VQA train+val. Unless stated otherwise, all human accuracies are on test-standard, machine accuracies are on test-dev, and results involving human captions (in gray font) are trained on train and tested on val (because captions are not available for test).
在这一节中,我们用若干基线和新方法,探讨 VQA 数据集在 MS COCO 图像上的难度。我们在 VQA train+val 上训练。除非另有说明,所有人类准确率都在 test-standard 上,机器准确率都在 test-dev 上;涉及人类描述的结果(灰色字体)在 train 上训练、在 val 上测试(因为 test 没有描述)。
V-A Baselines
V-A 基线
We implemented the following baselines:
我们实现了以下基线:
- random: We randomly choose an answer from the top 1K answers of the VQA train/val dataset.
- 随机: 我们从 VQA train/val 数据集最常见的 1,000 个答案中随机选一个答案。
- prior (“yes”): We always select the most popular answer (“yes”) for both the open-ended and multiple-choice tasks. Note that “yes” is always one of the choices for the multiple-choice questions.
- 先验(“yes”): 对开放式和选择题任务,我们始终选择最流行的答案(“yes”)。注意,“yes” 始终是选择题的选项之一。
- per Q-type prior: For the open-ended task, we pick the most popular answer per question type (see the appendix for details). For the multiple-choice task, we pick the answer (from the provided choices) that is most similar to the picked answer for the open-ended task using cosine similarity in Word2Vec[39] feature space.
- 按问题类型的先验: 对开放式任务,我们按问题类型选取最流行的答案(细节见附录)。对选择题任务,我们在所给选项中,选取与开放式任务所选答案在 Word2Vec [39] 特征空间中余弦相似度最高的那个答案。
- nearest neighbor: Given a test image, question pair, we first find the nearest neighbor questions and associated images from the training set. See appendix for details on how neighbors are found. Next, for the open-ended task, we pick the most frequent ground truth answer from this set of nearest neighbor question, image pairs. Similar to the “per Q-type prior” baseline, for the multiple-choice task, we pick the answer (from the provided choices) that is most similar to the picked answer for the open-ended task using cosine similarity in Word2Vec[39] feature space.
- 最近邻: 给定一个测试图像–问题对,我们先从训练集中找出 个最近邻问题及其关联图像。邻居如何查找见附录。接下来,对开放式任务,我们从这个最近邻问题–图像对集合中选取最频繁的标准答案。与“按问题类型的先验”基线类似,对选择题任务,我们在所给选项中,选取与开放式任务所选答案在 Word2Vec [39] 特征空间中余弦相似度最高的那个答案。
V-B Methods
V-B 方法
For our methods, we develop a 2-channel vision (image) + language (question) model that culminates with a softmax over possible outputs. We choose the top most frequent answers as possible outputs. This set of answers covers of the train+val answers. We describe the different components of our model below:
对我们的方法,我们构建了一个双通道视觉(图像)+ 语言(问题)模型,最后以 个可能输出上的 softmax 结束。我们选取出现频率最高的 个答案作为可能输出。这组答案覆盖了 train+val 答案的 。下面描述我们模型的各个组成部分:
Image Channel: This channel provides an embedding for the image. We experiment with two embeddings –
图像通道: 该通道为图像提供嵌入。我们实验了两种嵌入——
- I: The activations from the last hidden layer of VGGNet [48] are used as 4096-dim image embedding.
- I: 使用 VGGNet [48] 最后一个隐层的激活,作为 4096 维图像嵌入。
- norm I: These are normalized activations from the last hidden layer of VGGNet [48].
- 归一化 I: 这些是对 VGGNet [48] 最后一个隐层激活做 归一化后的结果。
Question Channel: This channel provides an embedding for the question. We experiment with three embeddings –
问题通道: 该通道为问题提供嵌入。我们实验了三种嵌入——
- Bag-of-Words Question (BoW Q): The top 1,000 words in the questions are used to create a bag-of-words representation. Since there is a strong correlation between the words that start a question and the answer (see Fig. 5), we find the top 10 first, second, and third words of the questions and create a 30 dimensional bag-of-words representation. These features are concatenated to get a 1,030-dim embedding for the question.
- 词袋问题(BoW Q): 用问题中出现最多的 1,000 个词构造词袋表示。由于问题开头的词与答案有很强的相关性(见图 5),我们找出问题中最常见的 10 个首词、次词和第三词,构造一个 30 维的词袋表示。这些特征再拼接起来,得到问题的 1,030 维嵌入。
- LSTM Q: An LSTM with one hidden layer is used to obtain 1024-dim embedding for the question. The embedding obtained from the LSTM is a concatenation of last cell state and last hidden state representations (each being 512-dim) from the hidden layer of the LSTM. Each question word is encoded with 300-dim embedding by a fully-connected layer + tanh non-linearity which is then fed to the LSTM. The input vocabulary to the embedding layer consists of all the question words seen in the training dataset.
- LSTM Q: 用一个隐层的 LSTM 得到问题的 1024 维嵌入。从 LSTM 得到的嵌入,是该隐层最后细胞状态和最后隐状态表示(各为 512 维)的拼接。每个问题词先经一个全连接层加 tanh 非线性编码成 300 维嵌入,再送入 LSTM。嵌入层的输入词表包含训练数据集中出现过的全部问题词。
- deeper LSTM Q: An LSTM with two hidden layers is used to obtain 2048-dim embedding for the question. The embedding obtained from the LSTM is a concatenation of last cell state and last hidden state representations (each being 512-dim) from each of the two hidden layers of the LSTM. Hence 2 (hidden layers) x 2 (cell state and hidden state) x 512 (dimensionality of each of the cell states, as well as hidden states) in Fig. 8. This is followed by a fully-connected layer + tanh non-linearity to transform 2048-dim embedding to 1024-dim. The question words are encoded in the same way as in LSTM Q.
- 更深的 LSTM Q: 用两个隐层的 LSTM 得到问题的 2048 维嵌入。从 LSTM 得到的嵌入,是两个隐层各自最后细胞状态和最后隐状态表示(各为 512 维)的拼接。因此如图 8 所示,为 2(隐层)× 2(细胞状态和隐状态)× 512(每个细胞状态以及隐状态的维数)。随后再接一个全连接层加 tanh 非线性,把 2048 维嵌入变换到 1024 维。问题词的编码方式与 LSTM Q 相同。
Multi-Layer Perceptron (MLP): The image and question embeddings are combined to obtain a single embedding.
多层感知机(MLP): 图像嵌入和问题嵌入被组合,得到一个单一嵌入。
- For BoW Q + I method, we simply concatenate the BoW Q and I embeddings.
- 对 BoW Q + I 方法,我们直接拼接 BoW Q 和 I 嵌入。
- For LSTM Q + I, and deeper LSTM Q + norm I (Fig. 8) methods, the image embedding is first transformed to 1024-dim by a fully-connected layer + tanh non-linearity to match the LSTM embedding of the question. The transformed image and LSTM embeddings (being in a common space) are then fused via element-wise multiplication.
- 对 LSTM Q + I 和 更深的 LSTM Q + 归一化 I(图 8)方法,图像嵌入先经一个全连接层加 tanh 非线性变换到 1024 维,以与问题的 LSTM 嵌入对齐。变换后的图像嵌入和 LSTM 嵌入(已在同一空间)再通过逐元素相乘融合。
This combined image + question embedding is then passed to an MLP – a fully connected neural network classifier with 2 hidden layers and 1000 hidden units (dropout 0.5) in each layer with tanh non-linearity, followed by a softmax layer to obtain a distribution over answers. The entire model is learned end-to-end with a cross-entropy loss. VGGNet parameters are frozen to those learned for ImageNet classification and not fine-tuned in the image channel.
这个组合后的图像 + 问题嵌入再送入一个 MLP——一个有 2 个隐层、每层 1000 个隐单元(dropout 0.5)、使用 tanh 非线性的全连接神经网络分类器,再接一个 softmax 层,得到 个答案上的分布。整个模型用交叉熵损失端到端学习。VGGNet 的参数固定为在 ImageNet 分类上所学到的参数,在图像通道中不做微调。
We also experimented with providing captions as input to our model. Similar to Table I, we assume that a human-generated caption is given as input. We use a bag-of-words representation containing the 1,000 most popular words in the captions as the caption embedding (Caption). For BoW Question + Caption (BoW Q + C) method, we simply concatenate the BoW Q and C embeddings.
我们也实验过把描述作为输入提供给模型。与表 I 类似,我们假定输入是一条由人生成的描述。我们用包含描述中最流行的 1,000 个词的词袋表示作为描述嵌入(Caption)。对 词袋问题 + 描述(BoW Q + C) 方法,我们直接拼接 BoW Q 和 C 嵌入。
For testing, we report the result on two different tasks: open-ended selects the answer with highest activation from all possible answers and multiple-choice picks the answer that has the highest activation from the potential answers.
测试时,我们报告两项不同任务的结果:开放式任务从全部 个可能答案中选取激活最高的答案,选择题任务从候选答案中选取激活最高的答案。
V-C Results
V-C 结果
| Open-Ended | Multiple-Choice | |||||||
|---|---|---|---|---|---|---|---|---|
| All | Yes/No | Number | Other | All | Yes/No | Number | Other | |
| prior (“yes”) | 29.66 | 70.81 | 00.39 | 01.15 | 29.66 | 70.81 | 00.39 | 01.15 |
| per Q-type prior | 37.54 | 71.03 | 35.77 | 09.38 | 39.45 | 71.02 | 35.86 | 13.34 |
| nearest neighbor | 42.70 | 71.89 | 24.36 | 21.94 | 48.49 | 71.94 | 26.00 | 33.56 |
| BoW Q | 48.09 | 75.66 | 36.70 | 27.14 | 53.68 | 75.71 | 37.05 | 38.64 |
| I | 28.13 | 64.01 | 00.42 | 03.77 | 30.53 | 69.87 | 00.45 | 03.76 |
| BoW Q + I | 52.64 | 75.55 | 33.67 | 37.37 | 58.97 | 75.59 | 34.35 | 50.33 |
| LSTM Q | 48.76 | 78.20 | 35.68 | 26.59 | 54.75 | 78.22 | 36.82 | 38.78 |
| LSTM Q + I | 53.74 | 78.94 | 35.24 | 36.42 | 57.17 | 78.95 | 35.80 | 43.41 |
| deeper LSTM Q | 50.39 | 78.41 | 34.68 | 30.03 | 55.88 | 78.45 | 35.91 | 41.13 |
| deeper LSTM Q + norm I | 57.75 | 80.50 | 36.77 | 43.08 | 62.70 | 80.52 | 38.22 | 53.01 |
| Caption | 26.70 | 65.50 | 02.03 | 03.86 | 28.29 | 69.79 | 02.06 | 03.82 |
| BoW Q + C | 54.70 | 75.82 | 40.12 | 42.56 | 59.85 | 75.89 | 41.16 | 52.53 |
TABLE II: Accuracy of our methods for the open-ended and multiple-choice tasks on the VQA test-dev for real images. Q = Question, I = Image, C = Caption. (Caption and BoW Q + C results are on val). See text for details.
| 开放式 | 选择题 | |||||||
|---|---|---|---|---|---|---|---|---|
| 全部 | 是否 | 数字 | 其他 | 全部 | 是否 | 数字 | 其他 | |
| 先验(“yes”) | 29.66 | 70.81 | 00.39 | 01.15 | 29.66 | 70.81 | 00.39 | 01.15 |
| 按问题类型的先验 | 37.54 | 71.03 | 35.77 | 09.38 | 39.45 | 71.02 | 35.86 | 13.34 |
| 最近邻 | 42.70 | 71.89 | 24.36 | 21.94 | 48.49 | 71.94 | 26.00 | 33.56 |
| BoW Q | 48.09 | 75.66 | 36.70 | 27.14 | 53.68 | 75.71 | 37.05 | 38.64 |
| I | 28.13 | 64.01 | 00.42 | 03.77 | 30.53 | 69.87 | 00.45 | 03.76 |
| BoW Q + I | 52.64 | 75.55 | 33.67 | 37.37 | 58.97 | 75.59 | 34.35 | 50.33 |
| LSTM Q | 48.76 | 78.20 | 35.68 | 26.59 | 54.75 | 78.22 | 36.82 | 38.78 |
| LSTM Q + I | 53.74 | 78.94 | 35.24 | 36.42 | 57.17 | 78.95 | 35.80 | 43.41 |
| 更深的 LSTM Q | 50.39 | 78.41 | 34.68 | 30.03 | 55.88 | 78.45 | 35.91 | 41.13 |
| 更深的 LSTM Q + 归一化 I | 57.75 | 80.50 | 36.77 | 43.08 | 62.70 | 80.52 | 38.22 | 53.01 |
| 描述 | 26.70 | 65.50 | 02.03 | 03.86 | 28.29 | 69.79 | 02.06 | 03.82 |
| BoW Q + C | 54.70 | 75.82 | 40.12 | 42.56 | 59.85 | 75.89 | 41.16 | 52.53 |
表 II:我们的方法在真实图像 VQA test-dev 上开放式和选择题任务的准确率。Q = 问题,I = 图像,C = 描述。(描述和 BoW Q + C 的结果在 val 上。)细节见正文。
Table II shows the accuracy of our baselines and methods for both the open-ended and multiple-choice tasks on the VQA test-dev for real images.
表 II 给出了我们的基线和方法在真实图像 VQA test-dev 上开放式和选择题两项任务的准确率。
As expected, the vision-alone model (I) that completely ignores the question performs rather poorly (open-ended: 28.13% / multiple-choice: 30.53%). In fact, on open-ended task, the vision-alone model (I) performs worse than the prior (“yes”) baseline, which ignores both the image and question (responding to every question with a “yes”).
正如所预期的,完全忽略问题的纯视觉模型(I)表现相当差(开放式:28.13% / 选择题:30.53%)。事实上,在开放式任务上,纯视觉模型(I)甚至不如同时忽略图像和问题、对每个问题都回答“yes”的先验(“yes”)基线。
Interestingly, the language-alone methods (per Q-type prior, BoW Q, LSTM Q) that ignore the image perform surprisingly well, with BoW Q achieving 48.09% on open-ended (53.68% on multiple-choice) and LSTM Q achieving 48.76% on open-ended (54.75% on multiple-choice); both outperforming the nearest neighbor baseline (open-ended: 42.70%, multiple-choice: 48.49%). Our quantitative results and analyses suggest that this might be due to the language-model exploiting subtle statistical priors about the question types (e.g. “What color is the banana?” can be answered with “yellow” without looking at the image). For a detailed discussion of the subtle biases in the questions, please see [56].
有意思的是,忽略图像的纯语言模型(按问题类型的先验、BoW Q、LSTM Q)表现得出人意料地好:BoW Q 在开放式上达到 48.09%(选择题 53.68%),LSTM Q 在开放式上达到 48.76%(选择题 54.75%);二者都超过了最近邻基线(开放式:42.70%,选择题:48.49%)。我们的定量结果和分析表明,这可能是因为语言模型利用了关于问题类型的细微统计先验(例如,“香蕉是什么颜色?”不必看图就可以答“黄色”)。关于问题中细微偏差的详细讨论,请见 [56]。
The accuracy of our best model (deeper LSTM Q + norm I (Fig. 8), selected using VQA test-dev accuracies) on VQA test-standard is 58.16% (open-ended) / 63.09% (multiple-choice). We can see that our model is able to significantly outperform both the vision-alone and language-alone baselines. As a general trend, results on multiple-choice are better than open-ended. All methods are significantly worse than human performance.
我们的最佳模型(更深的 LSTM Q + 归一化 I(图 8),按 VQA test-dev 准确率选定)在 VQA test-standard 上的准确率是 58.16%(开放式)/ 63.09%(选择题)。可以看到,我们的模型能够显著超过纯视觉和纯语言基线。作为一般趋势,选择题上的结果好于开放式。所有方法都显著差于人类表现。
Our VQA demo is available on CloudCV [1] – http://cloudcv.org/vqa. This will be updated with newer models as we develop them.
我们的 VQA 演示可在 CloudCV [1] 上使用——http://cloudcv.org/vqa。随着我们开发更新的模型,该演示会随之更新。
To gain further insights into these results, we computed accuracies by question type in Table III. Interestingly, for question types that require more reasoning, such as “Is the” or “How many”, the scene-level image features do not provide any additional information. However, for questions that can be answered using scene-level information, such as “What sport,” we do see an improvement. Similarly, for questions whose answer may be contained in a generic caption we see improvement, such as “What animal”. For all question types, the results are worse than human accuracies.
为了进一步理解这些结果,我们在表 III 中按问题类型计算了准确率。有意思的是,对需要更多推理的问题类型,例如 “Is the” 或 “How many”,场景级图像特征并不提供额外信息。然而,对可以用场景级信息回答的问题,例如 “What sport”,我们确实看到了提升。类似地,对答案可能包含在通用描述中的问题,例如 “What animal”,我们也看到了提升。对所有问题类型,结果都差于人类准确率。
We also analyzed the accuracies of our best model (deeper LSTM Q + norm I) on a subset of questions with certain specific (ground truth) answers. In Fig. 9, we show the average accuracy of the model on questions with 50 most frequent ground truth answers on the VQA validation set (plot is sorted by accuracy, not frequency). We can see that the model performs well for answers that are common visual objects such as “wii”, “tennis”, “bathroom” while the performance is somewhat underwhelming for counts (e.g., “2”, “1”, “3”), and particularly poor for higher counts (e.g., “5”, “6”, “10”, “8”, “7”).
我们也分析了我们最佳模型(更深的 LSTM Q + 归一化 I)在具有某些特定(标准)答案的问题子集上的准确率。在图 9 中,我们给出了该模型在 VQA 验证集上、针对出现频率最高的 50 个标准答案所对应问题上的平均准确率(图按准确率排序,不按频率)。可以看到,模型对常见视觉对象类答案表现较好,例如 “wii”、“tennis”、“bathroom”,而对计数(例如 “2”、“1”、“3”)的表现则有些不尽如人意,对更大的计数(例如 “5”、“6”、“10”、“8”、“7”)尤其差。
In Fig. 10, we show the distribution of 50 most frequently predicted answers when the system is correct on the VQA validation set (plot is sorted by prediction frequency, not accuracy). In this analysis, “system is correct” implies that it has VQA accuracy (see section III for accuracy metric). We can see that the frequent ground truth answers (e.g., “yes”, “no”, “2”, “white”, “red”, “blue”, “1”, “green”) are more frequently predicted than others when the model is correct.
在图 10 中,我们给出了系统在 VQA 验证集上答对时、预测频率最高的 50 个答案的分布(图按预测频率排序,不按准确率)。在这项分析中,“系统答对”意味着它的 VQA 准确率为 (准确率度量见第 III 节)。可以看到,当模型答对时,频繁的标准答案(例如 “yes”、“no”、“2”、“white”、“red”、“blue”、“1”、“green”)比其他答案被更频繁地预测出来。
| Open-Ended | Human Age | Commonsense | |||||
|---|---|---|---|---|---|---|---|
| Question | K = 1000 | Human | To Be Able | To Be Able | |||
| Type | Q | Q + I | Q + C | Q | Q + I | To Answer | To Answer (%) |
| what is (13.84) | 23.57 | 34.28 | 43.88 | 16.86 | 73.68 | 09.07 | 27.52 |
| what color (08.98) | 33.37 | 43.53 | 48.61 | 28.71 | 86.06 | 06.60 | 13.22 |
| what kind (02.49) | 27.78 | 42.72 | 43.88 | 19.10 | 70.11 | 10.55 | 40.34 |
| what are (02.32) | 25.47 | 39.10 | 47.27 | 17.72 | 69.49 | 09.03 | 28.72 |
| what type (01.78) | 27.68 | 42.62 | 44.32 | 19.53 | 70.65 | 11.04 | 38.92 |
| is the (10.16) | 70.76 | 69.87 | 70.50 | 65.24 | 95.67 | 08.51 | 30.30 |
| is this (08.26) | 70.34 | 70.79 | 71.54 | 63.35 | 95.43 | 10.13 | 45.32 |
| how many (10.28) | 43.78 | 40.33 | 47.52 | 30.45 | 86.32 | 07.67 | 15.93 |
| are (07.57) | 73.96 | 73.58 | 72.43 | 67.10 | 95.24 | 08.65 | 30.63 |
| does (02.75) | 76.81 | 75.81 | 75.88 | 69.96 | 95.70 | 09.29 | 38.97 |
| where (02.90) | 16.21 | 23.49 | 29.47 | 11.09 | 43.56 | 09.54 | 36.51 |
| is there (03.60) | 86.50 | 86.37 | 85.88 | 72.48 | 96.43 | 08.25 | 19.88 |
| why (01.20) | 16.24 | 13.94 | 14.54 | 11.80 | 21.50 | 11.18 | 73.56 |
| which (01.21) | 29.50 | 34.83 | 40.84 | 25.64 | 67.44 | 09.27 | 30.00 |
| do (01.15) | 77.73 | 79.31 | 74.63 | 71.33 | 95.44 | 09.23 | 37.68 |
| what does (01.12) | 19.58 | 20.00 | 23.19 | 11.12 | 75.88 | 10.02 | 33.27 |
| what time (00.67) | 8.35 | 14.00 | 18.28 | 07.64 | 58.98 | 09.81 | 31.83 |
| who (00.77) | 19.75 | 20.43 | 27.28 | 14.69 | 56.93 | 09.49 | 43.82 |
| what sport (00.81) | 37.96 | 81.12 | 93.87 | 17.86 | 95.59 | 08.07 | 31.87 |
| what animal (00.53) | 23.12 | 59.70 | 71.02 | 17.67 | 92.51 | 06.75 | 18.04 |
| what brand (00.36) | 40.13 | 36.84 | 32.19 | 25.34 | 80.95 | 12.50 | 41.33 |
TABLE III: Open-ended test-dev results for different question types on real images (Q+C is reported on val). Machine performance is reported using the bag-of-words representation for questions. Questions types are determined by the one or two words that start the question. The percentage of questions for each type is shown in parentheses. Last and second last columns respectively show the average human age and average degree of commonsense required to answer the questions (as reported by AMT workers), respectively. See text for details.
| 问题类型 | 开放式 K=1000 Q | Q + I | Q + C | 人类 Q | 人类 Q + I | 能够回答所需年龄 | 能够回答所需常识(%) |
|---|---|---|---|---|---|---|---|
| what is (13.84) | 23.57 | 34.28 | 43.88 | 16.86 | 73.68 | 09.07 | 27.52 |
| what color (08.98) | 33.37 | 43.53 | 48.61 | 28.71 | 86.06 | 06.60 | 13.22 |
| what kind (02.49) | 27.78 | 42.72 | 43.88 | 19.10 | 70.11 | 10.55 | 40.34 |
| what are (02.32) | 25.47 | 39.10 | 47.27 | 17.72 | 69.49 | 09.03 | 28.72 |
| what type (01.78) | 27.68 | 42.62 | 44.32 | 19.53 | 70.65 | 11.04 | 38.92 |
| is the (10.16) | 70.76 | 69.87 | 70.50 | 65.24 | 95.67 | 08.51 | 30.30 |
| is this (08.26) | 70.34 | 70.79 | 71.54 | 63.35 | 95.43 | 10.13 | 45.32 |
| how many (10.28) | 43.78 | 40.33 | 47.52 | 30.45 | 86.32 | 07.67 | 15.93 |
| are (07.57) | 73.96 | 73.58 | 72.43 | 67.10 | 95.24 | 08.65 | 30.63 |
| does (02.75) | 76.81 | 75.81 | 75.88 | 69.96 | 95.70 | 09.29 | 38.97 |
| where (02.90) | 16.21 | 23.49 | 29.47 | 11.09 | 43.56 | 09.54 | 36.51 |
| is there (03.60) | 86.50 | 86.37 | 85.88 | 72.48 | 96.43 | 08.25 | 19.88 |
| why (01.20) | 16.24 | 13.94 | 14.54 | 11.80 | 21.50 | 11.18 | 73.56 |
| which (01.21) | 29.50 | 34.83 | 40.84 | 25.64 | 67.44 | 09.27 | 30.00 |
| do (01.15) | 77.73 | 79.31 | 74.63 | 71.33 | 95.44 | 09.23 | 37.68 |
| what does (01.12) | 19.58 | 20.00 | 23.19 | 11.12 | 75.88 | 10.02 | 33.27 |
| what time (00.67) | 8.35 | 14.00 | 18.28 | 07.64 | 58.98 | 09.81 | 31.83 |
| who (00.77) | 19.75 | 20.43 | 27.28 | 14.69 | 56.93 | 09.49 | 43.82 |
| what sport (00.81) | 37.96 | 81.12 | 93.87 | 17.86 | 95.59 | 08.07 | 31.87 |
| what animal (00.53) | 23.12 | 59.70 | 71.02 | 17.67 | 92.51 | 06.75 | 18.04 |
| what brand (00.36) | 40.13 | 36.84 | 32.19 | 25.34 | 80.95 | 12.50 | 41.33 |
表 III:真实图像上不同问题类型的开放式 test-dev 结果(Q+C 在 val 上报告)。机器表现用问题的词袋表示报告。问题类型由问题开头的一个或两个词确定。各类型问题的百分比在括号中给出。最后一列和倒数第二列分别给出回答这些问题所需的平均人类年龄和平均常识程度(由 AMT 工人报告)。细节见正文。
Finally, evaluating our best model (deeper LSTM Q + norm I) on the validation questions for which we have age annotations (how old a human needs to be to answer the question correctly), we estimate that our model performs as well as a year old child! The average age required on the same set of questions is . Evaluating the same model on the validation questions for which we have commonsense annotations (whether the question requires commonsense to answer it), we estimate that it has degree of commonsense of . The average degree of commonsense required on same set of questions is . Again, these estimates reflect the age and commonsense perceived by MTurk workers that would be required to answer the question. See the appendix for details.
最后,在我们有年龄标注(一个人要多大才能正确回答该问题)的验证问题上评估我们的最佳模型(更深的 LSTM Q + 归一化 I),我们估计该模型的表现相当于一个 岁的儿童!同一组问题上所需的平均年龄是 。在我们有常识标注(该问题是否需要常识才能回答)的验证问题上评估同一模型,我们估计它的常识程度为 。同一组问题上所需的平均常识程度是 。再次强调,这些估计反映的是 Mechanical Turk 工人所感知的、回答该问题所需的年龄和常识。细节见附录。
We further analyzed the performance of the model for different age groups on the validation questions for which we have age annotations. In Fig. 11, we computed the average accuracy of the predictions made by the model for questions belonging to different age groups. Perhaps as expected, the accuracy of the model decreases as the age of the question increases (from at age group to at age group).
我们进一步分析了该模型在有年龄标注的验证问题上、对不同年龄组的表现。在图 11 中,我们计算了模型对属于不同年龄组的问题所做预测的平均准确率。或许正如所预期的,模型的准确率随着问题年龄的上升而下降(从 岁组的 降到 岁组的 )。
In Fig. 12, we show the distribution of age of questions for different levels of accuracies achieved by our system on the validation questions for which we have age annotations. It is interesting to see that the relative proportions of different age groups is consistent across all accuracy bins with questions belonging to the age group 5-8 comprising the majority of the predictions which is expected because 5-8 is the most common age group in the dataset (see Fig. 7).
在图 12 中,我们给出了系统在有年龄标注的验证问题上达到不同准确率水平时,问题年龄的分布。有意思的是,不同年龄组的相对比例在所有准确率分箱中都保持一致,属于 5–8 岁组的问题构成了预测的主体;这是预期之中的,因为 5–8 是数据集中最常见的年龄组(见图 7)。
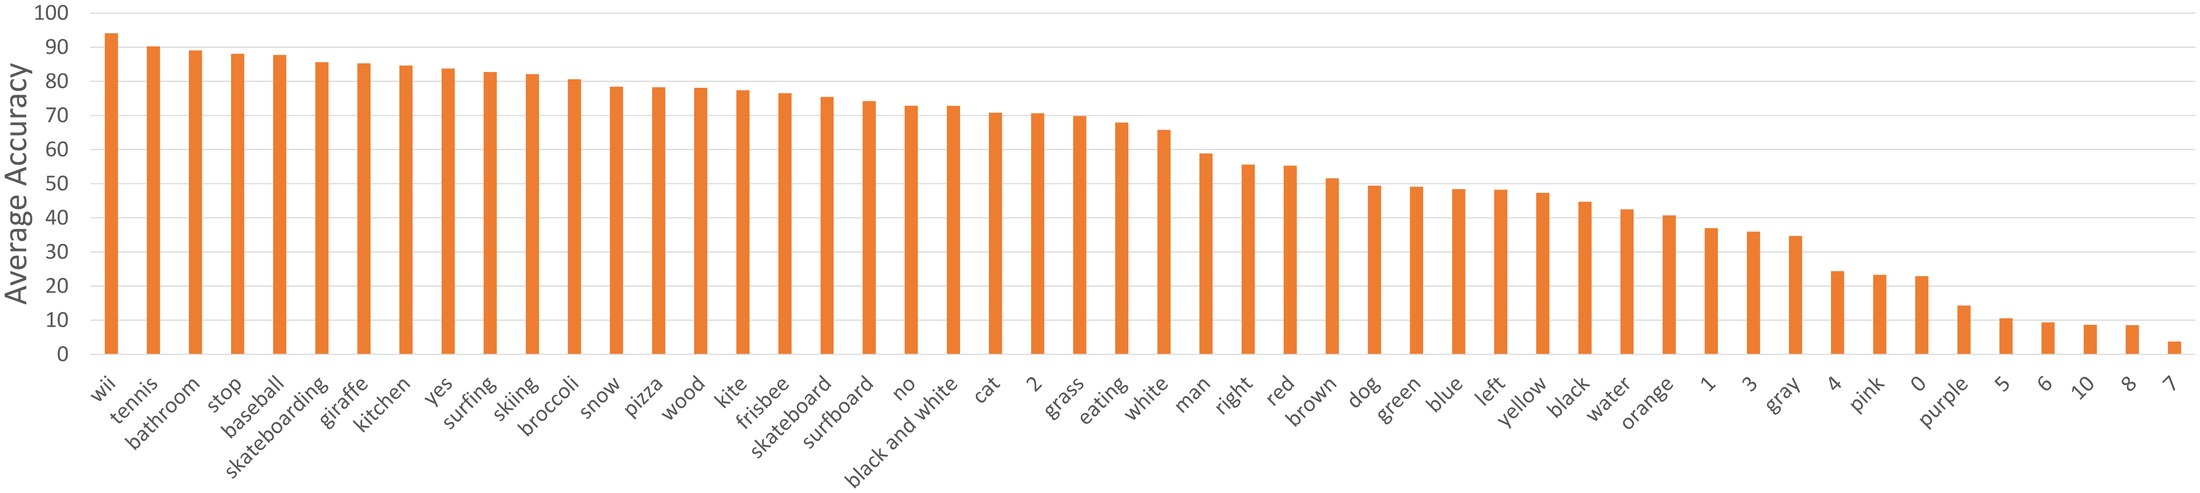
Fig. 9: for 50 most frequent ground truth answers on the VQA validation set (plot is sorted by accuracy, not frequency). System refers to our best model (deeper LSTM Q + norm I).
图 9:VQA 验证集上出现频率最高的 50 个标准答案的 (图按准确率排序,不按频率)。系统指我们的最佳模型(更深的 LSTM Q + 归一化 I)。
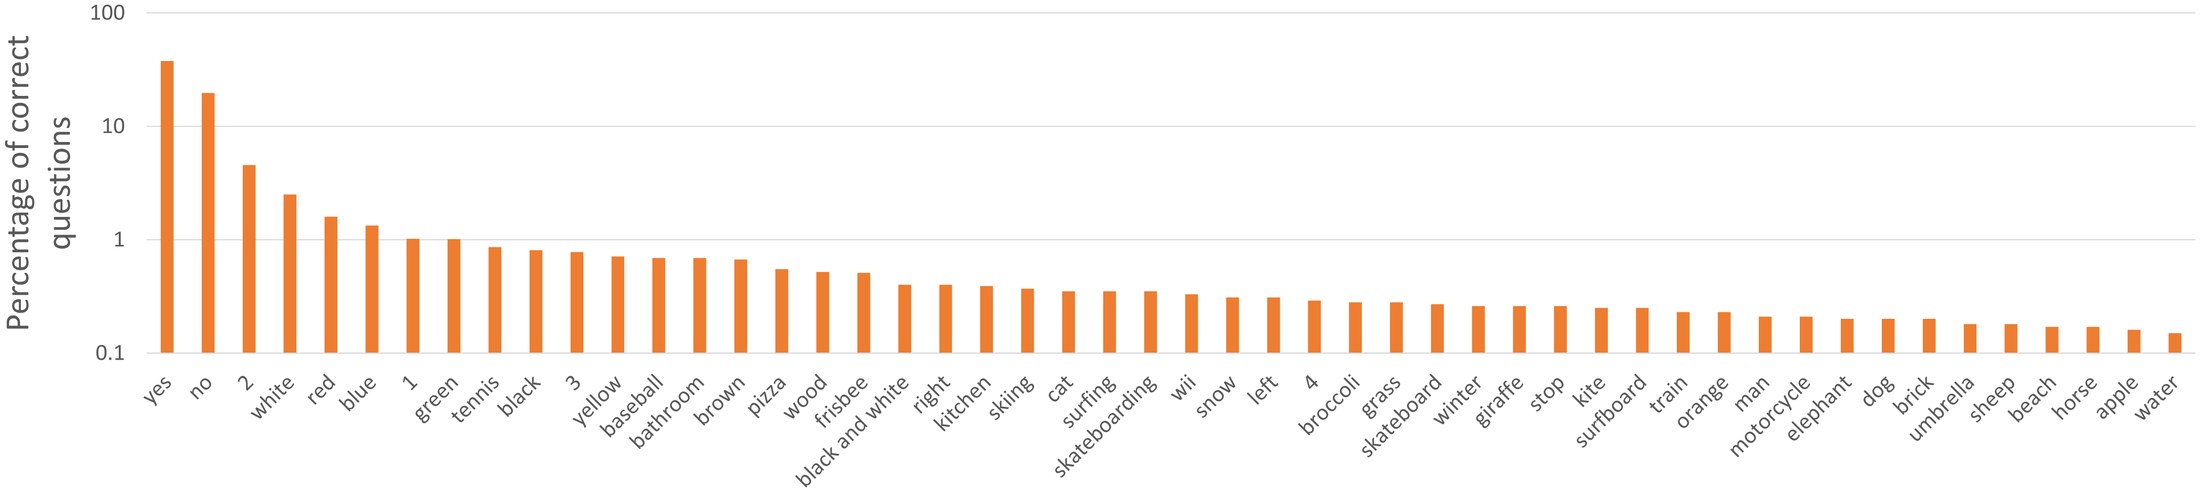
Fig. 10: for 50 most frequently predicted answers on the VQA validation set (plot is sorted by prediction frequency, not accuracy). System refers to our best model (deeper LSTM Q + norm I).
图 10:VQA 验证集上预测频率最高的 50 个答案的 (图按预测频率排序,不按准确率)。系统指我们的最佳模型(更深的 LSTM Q + 归一化 I)。
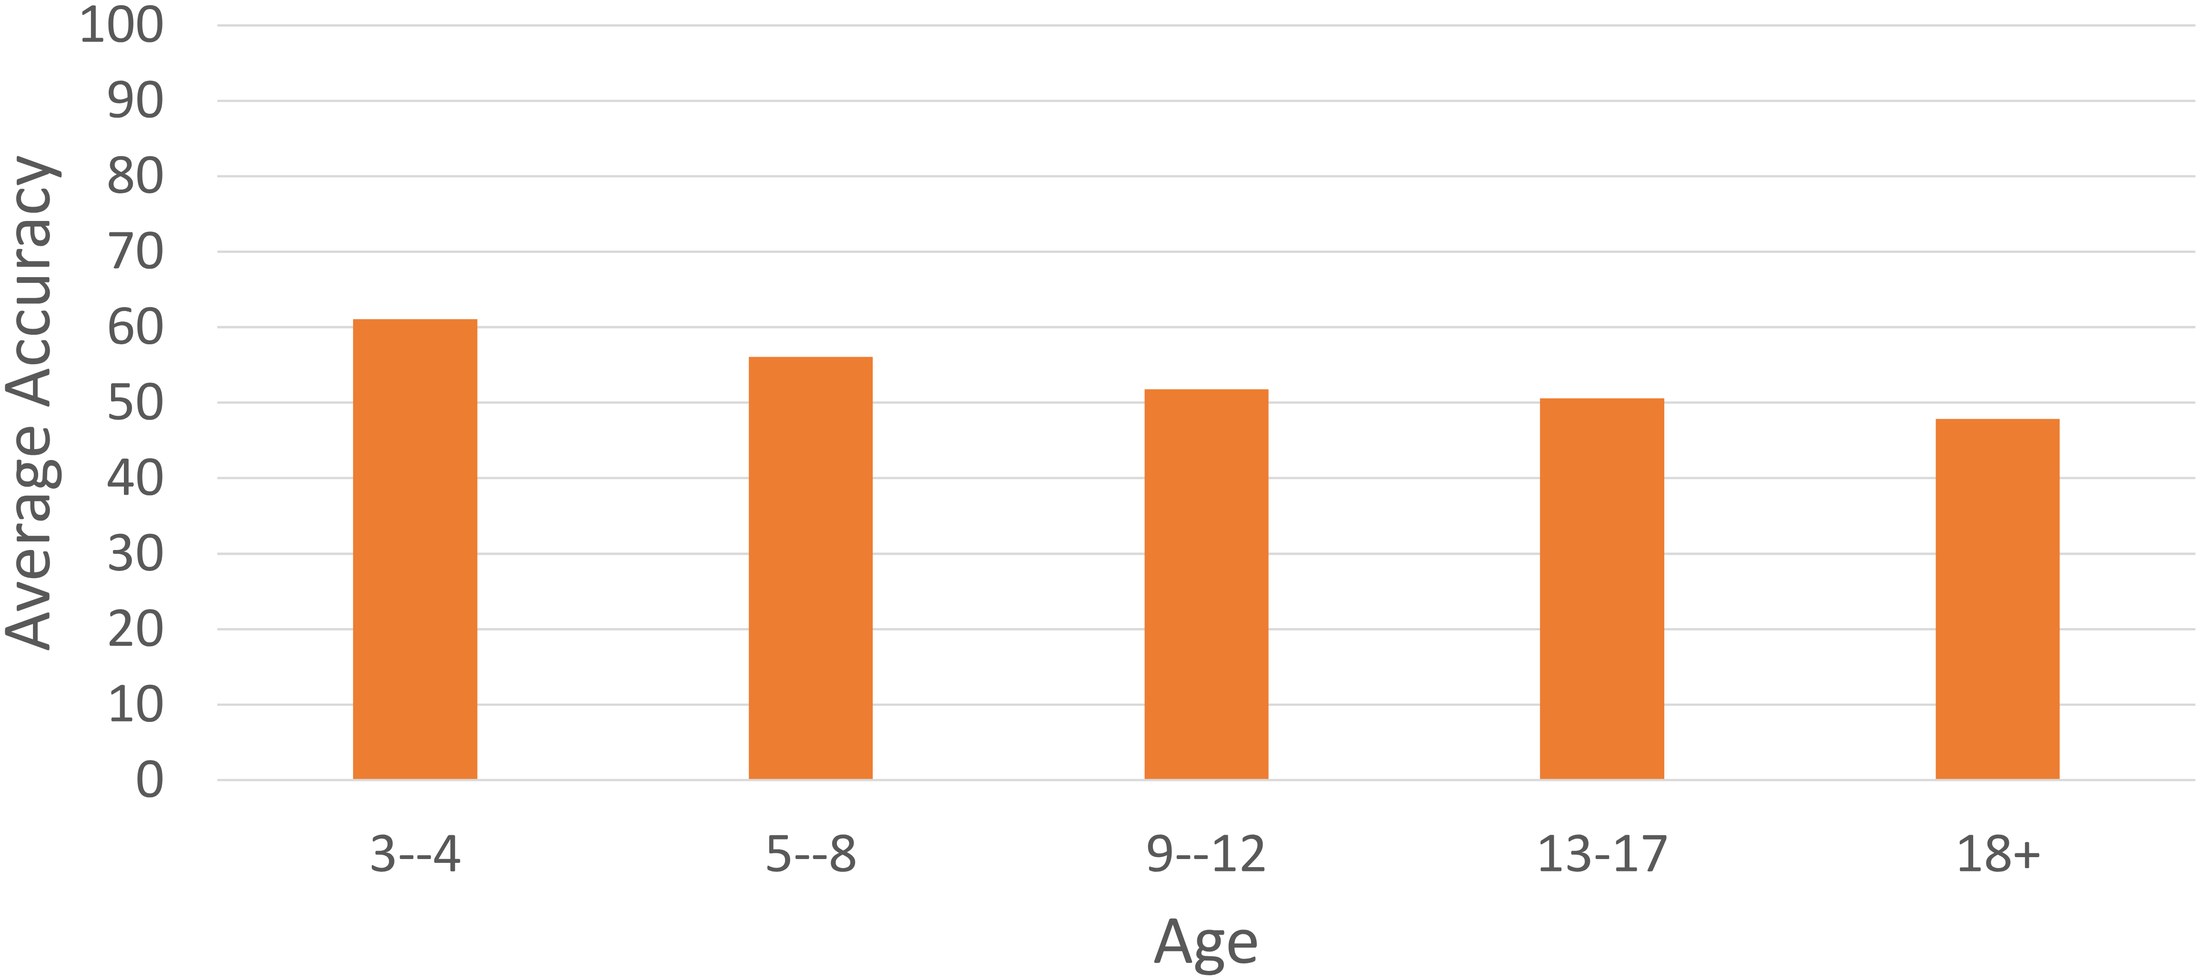
Fig. 11: on the VQA validation set. System refers to our best model (deeper LSTM Q + norm I).
图 11:VQA 验证集上的 。系统指我们的最佳模型(更深的 LSTM Q + 归一化 I)。
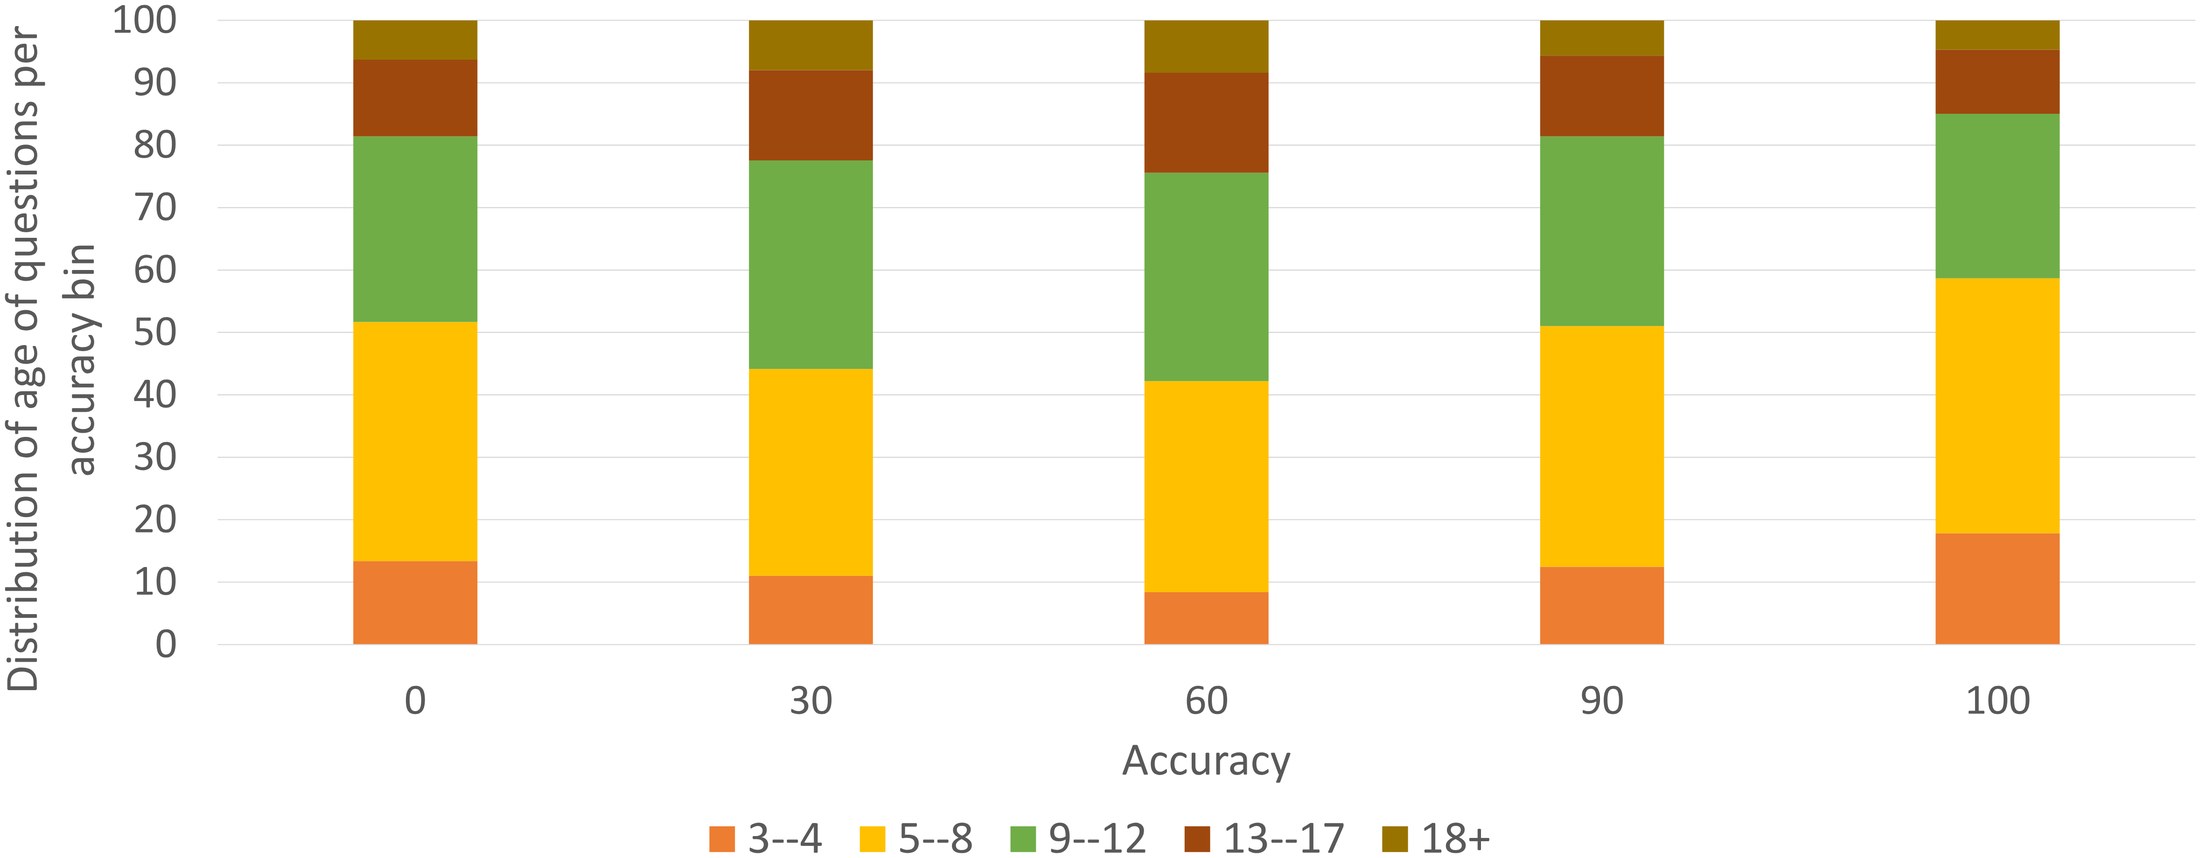
Fig. 12: on the VQA validation set. System refers to our best model (deeper LSTM Q + norm I).
图 12:VQA 验证集上的 。系统指我们的最佳模型(更深的 LSTM Q + 归一化 I)。
Table IV shows the accuracy of different ablated versions of our best model (deeper LSTM Q + norm I) for both the open-ended and multiple-choice tasks on the VQA test-dev for real images. The different ablated versions are as follows –
表 IV 给出了我们最佳模型(更深的 LSTM Q + 归一化 I)的不同消融版本,在真实图像 VQA test-dev 上开放式和选择题两项任务的准确率。不同消融版本如下——
- Without I Norm: In this model, the activations from the last hidden layer of VGGNet [48] are not -normalized. Comparing the accuracies in Table IV and Table II, we can see that -normalization of image features boosts the performance by 0.16% for open-ended task and by 0.24% for multiple-choice task.
- 不做 I 归一化: 在这个模型中,VGGNet [48] 最后一个隐层的激活不做 归一化。比较表 IV 和表 II 中的准确率,可以看到图像特征的 归一化在开放式任务上提升了 0.16%,在选择题任务上提升了 0.24%。
- Concatenation: In this model, the transformed image and LSTM embeddings are concatenated (instead of element-wise multiplied), resulting in doubling the number of parameters in the following fully-connected layer. Comparing the accuracies in Table IV and Table II, we can see that element-wise fusion performs better by 0.95% for open-ended task and by 1.24% for multiple-choice task.
- 拼接: 在这个模型中,变换后的图像嵌入和 LSTM 嵌入被拼接(而不是逐元素相乘),从而使随后的全连接层参数数量翻倍。比较表 IV 和表 II 中的准确率,可以看到逐元素融合在开放式任务上好 0.95%,在选择题任务上好 1.24%。
- K = 500: In this model, we use K = 500 most frequent answers as possible outputs. Comparing the accuracies in Table IV and Table II, we can see that K = 1000 performs better than K = 500 by 0.82% for open-ended task and by 1.92% for multiple-choice task.
- K = 500: 在这个模型中,我们使用出现频率最高的 K = 500 个答案作为可能输出。比较表 IV 和表 II 中的准确率,可以看到 K = 1000 比 K = 500 在开放式任务上好 0.82%,在选择题任务上好 1.92%。
- K = 2000: In this model, we use K = 2000 most frequent answers as possible outputs. Comparing the accuracies in Table IV and Table II, we can see that K = 2000 performs better then K = 1000 by 0.40% for open-ended task and by 1.16% for multiple-choice task.
- K = 2000: 在这个模型中,我们使用出现频率最高的 K = 2000 个答案作为可能输出。比较表 IV 和表 II 中的准确率,可以看到 K = 2000 比 K = 1000 在开放式任务上好 0.40%,在选择题任务上好 1.16%。
- Truncated Q Vocab 5: In this model, the input vocabulary to the embedding layer (which encodes the question words) consists of only those question words which occur atleast 5 times in the training dataset, thus reducing the vocabulary size from 14770 (when all question words are used) to 5134 (65.24% reduction). Remaining question words are replaced with UNK (unknown) tokens. Comparing the accuracies in Table IV and Table II, we can see that truncating the question vocabulary 5 performs better than using all questions words by 0.24% for open-ended task and by 0.17% for multiple-choice task.
- 截断问题词表 5: 在这个模型中,嵌入层(编码问题词)的输入词表只包含在训练数据集中至少出现 5 次的问题词,从而把词表规模从 14770(使用全部问题词时)降到 5134(减少 65.24%)。其余问题词用 UNK(未知)标记替换。比较表 IV 和表 II 中的准确率,可以看到把问题词表截断到 5 比使用全部问题词在开放式任务上好 0.24%,在选择题任务上好 0.17%。
- Truncated Q Vocab 11: In this model, the input vocabulary to the embedding layer (which encodes the question words) consists of only those question words which occur atleast 11 times in the training dataset, thus reducing the vocabulary size from 14770 (when all question words are used) to 3561 (75.89% reduction). Remaining question words are replaced with UNK (unknown) tokens. Comparing the accuracies in Table IV and Table II, we can see that truncating the question vocabulary 11 performs better than using all questions words by 0.06% for open-ended task and by 0.02% for multiple-choice task.
- 截断问题词表 11: 在这个模型中,嵌入层(编码问题词)的输入词表只包含在训练数据集中至少出现 11 次的问题词,从而把词表规模从 14770(使用全部问题词时)降到 3561(减少 75.89%)。其余问题词用 UNK(未知)标记替换。比较表 IV 和表 II 中的准确率,可以看到把问题词表截断到 11 比使用全部问题词在开放式任务上好 0.06%,在选择题任务上好 0.02%。
- Filtered Dataset: We created a filtered version of the VQA train + val dataset in which we only keep the answers with subject confidence “yes”. Also, we keep only those questions for which at least 50% (5 out of 10) answers are annotated with subject confidence “yes”. The resulting filtered dataset consists of 344600 questions, compared to 369861 questions in the original dataset, thus leading to only 6.83% reduction in the size of the dataset. The filtered dataset has 8.77 answers per question on average. We did not filter the test set so that accuracies of the model trained on the filtered dataset can be compared with that of the model trained on the original dataset. The row “Filtered Dataset” in Table IV shows the performance of the deeper LSTM Q + norm I model when trained on the filtered dataset. Comparing these accuracies with the corresponding accuracies in Table II, we can see that the model trained on filtered version performs worse by 1.13% for open-ended task and by 1.88% for multiple-choice task.
- 过滤后的数据集: 我们创建了 VQA train + val 数据集的一个过滤版本,只保留受试者自信度为“是”的答案。同时,我们只保留至少 50%(10 个中的 5 个)答案被标注为受试者自信度“是”的问题。得到的过滤数据集包含 344600 个问题,而原始数据集有 369861 个问题,因此规模只减少了 6.83%。过滤后的数据集平均每个问题有 8.77 个答案。我们没有过滤测试集,以便把在过滤数据集上训练的模型准确率与在原始数据集上训练的模型准确率相比较。表 IV 中“过滤后的数据集”一行给出了更深的 LSTM Q + 归一化 I 模型在过滤数据集上训练时的表现。将这些准确率与表 II 中相应的准确率相比较,可以看到在过滤版本上训练的模型在开放式任务上差 1.13%,在选择题任务上差 1.88%。
| Open-Ended | Multiple-Choice | |||||||
|---|---|---|---|---|---|---|---|---|
| All | Yes/No | Number | Other | All | Yes/No | Number | Other | |
| Without I Norm | 57.59 | 80.41 | 36.63 | 42.84 | 62.46 | 80.43 | 38.10 | 52.62 |
| Concatenation | 56.80 | 78.49 | 35.08 | 43.19 | 61.46 | 78.52 | 36.43 | 52.54 |
| K = 500 | 56.93 | 80.61 | 36.24 | 41.39 | 60.78 | 80.64 | 37.44 | 49.10 |
| K = 2000 | 58.15 | 80.56 | 37.04 | 43.79 | 63.86 | 80.59 | 38.97 | 55.20 |
| Truncated Q Vocab 5 | 57.99 | 80.67 | 36.99 | 43.38 | 62.87 | 80.71 | 38.22 | 53.20 |
| Truncated Q Vocab 11 | 57.81 | 80.42 | 36.97 | 43.22 | 62.72 | 80.45 | 38.30 | 53.09 |
| Filtered Dataset | 56.62 | 80.19 | 37.48 | 40.95 | 60.82 | 80.19 | 37.48 | 49.57 |
TABLE IV: Accuracy of ablated versions of our best model (deeper LSTM Q + norm I) for the open-ended and multiple-choice tasks on the VQA test-dev for real images. Q = Question, I = Image. See text for details.
| 开放式 | 选择题 | |||||||
|---|---|---|---|---|---|---|---|---|
| 全部 | 是否 | 数字 | 其他 | 全部 | 是否 | 数字 | 其他 | |
| 不做 I 归一化 | 57.59 | 80.41 | 36.63 | 42.84 | 62.46 | 80.43 | 38.10 | 52.62 |
| 拼接 | 56.80 | 78.49 | 35.08 | 43.19 | 61.46 | 78.52 | 36.43 | 52.54 |
| K = 500 | 56.93 | 80.61 | 36.24 | 41.39 | 60.78 | 80.64 | 37.44 | 49.10 |
| K = 2000 | 58.15 | 80.56 | 37.04 | 43.79 | 63.86 | 80.59 | 38.97 | 55.20 |
| 截断问题词表 5 | 57.99 | 80.67 | 36.99 | 43.38 | 62.87 | 80.71 | 38.22 | 53.20 |
| 截断问题词表 11 | 57.81 | 80.42 | 36.97 | 43.22 | 62.72 | 80.45 | 38.30 | 53.09 |
| 过滤后的数据集 | 56.62 | 80.19 | 37.48 | 40.95 | 60.82 | 80.19 | 37.48 | 49.57 |
表 IV:我们最佳模型(更深的 LSTM Q + 归一化 I)的消融版本在真实图像 VQA test-dev 上开放式和选择题任务的准确率。Q = 问题,I = 图像。细节见正文。
VI VQA Challenge and Workshop
VI VQA 挑战赛与研讨会
We have set up an evaluation server[^3] where results may be uploaded for the test set and it returns an accuracy breakdown. We are organizing an annual challenge and workshop to facilitate systematic progress in this area; the first instance of the workshop will be held at CVPR 2016[^4]. We suggest that papers reporting results on the VQA dataset –
我们搭建了一个评测服务器[^3],可以上传测试集结果,并返回准确率分解。我们正在组织年度挑战赛和研讨会,以便推动这一领域的系统进展;研讨会的第一届将在 CVPR 2016 举行[^4]。我们建议在 VQA 数据集上报告结果的论文——
- Report test-standard accuracies, which can be calculated using either of the non-test-dev phases, i.e., “test2015” or “Challenge test2015” on the following links: [oe-real oe-abstract mc-real mc-abstract].
- 报告 test-standard 准确率,该准确率可以用任一非 test-dev 阶段计算,即以下链接上的 “test2015” 或 “Challenge test2015”:[oe-real oe-abstract mc-real mc-abstract]。
- Compare their test-standard accuracies with those on the corresponding test2015 leaderboards [oe-real-leaderboard oe-abstract-leaderboard mc-real-leaderboard mc-abstract-leaderboard].
- 把他们的 test-standard 准确率与相应 test2015 排行榜上的结果相比较 [oe-real-leaderboard oe-abstract-leaderboard mc-real-leaderboard mc-abstract-leaderboard]。
For more details, please see the challenge page[^5]. Screenshots of leaderboards for open-ended-real and multiple-choice-real are shown in Fig. 13. We also compare the test-standard accuracies of our best model (deeper LSTM Q + norm I) for both open-ended and multiple-choice tasks (real images) with other entries (as of October 28, 2016) on the corresponding leaderboards in Table V.
更多细节请见挑战赛页面[^5]。开放式真实图像和选择题真实图像排行榜的截图见图 13。我们还在表 V 中,把我们最佳模型(更深的 LSTM Q + 归一化 I)在开放式和选择题任务(真实图像)上的 test-standard 准确率,与相应排行榜上的其他条目(截至 2016 年 10 月 28 日)做了比较。
| Open-Ended | Multiple-Choice | |||||||
|---|---|---|---|---|---|---|---|---|
| All | Yes/No | Number | Other | All | Yes/No | Number | Other | |
| snubi-naverlabs | 60.60 | 82.23 | 38.22 | 46.99 | 64.95 | 82.25 | 39.56 | 55.68 |
| MM_PaloAlto | 60.36 | 80.43 | 36.82 | 48.33 | – | – | – | – |
| LV-NUS | 59.54 | 81.34 | 35.67 | 46.10 | 64.18 | 81.25 | 38.30 | 55.20 |
| ACVT_Adelaide | 59.44 | 81.07 | 37.12 | 45.83 | – | – | – | – |
| global_vision | 58.43 | 78.24 | 36.27 | 46.32 | – | – | – | – |
| deeper LSTM Q + norm I | 58.16 | 80.56 | 36.53 | 43.73 | 63.09 | 80.59 | 37.70 | 53.64 |
| iBOWIMG | – | – | – | – | 61.97 | 76.86 | 37.30 | 54.60 |
TABLE V: Test-standard accuracy of our best model (deeper LSTM Q + norm I) compared to test-standard accuracies of other entries for the open-ended and multiple-choice tasks in the respective VQA Real Image Challenge leaderboards (as of October 28, 2016).
| 开放式 | 选择题 | |||||||
|---|---|---|---|---|---|---|---|---|
| 全部 | 是否 | 数字 | 其他 | 全部 | 是否 | 数字 | 其他 | |
| snubi-naverlabs | 60.60 | 82.23 | 38.22 | 46.99 | 64.95 | 82.25 | 39.56 | 55.68 |
| MM_PaloAlto | 60.36 | 80.43 | 36.82 | 48.33 | – | – | – | – |
| LV-NUS | 59.54 | 81.34 | 35.67 | 46.10 | 64.18 | 81.25 | 38.30 | 55.20 |
| ACVT_Adelaide | 59.44 | 81.07 | 37.12 | 45.83 | – | – | – | – |
| global_vision | 58.43 | 78.24 | 36.27 | 46.32 | – | – | – | – |
| 更深的 LSTM Q + 归一化 I | 58.16 | 80.56 | 36.53 | 43.73 | 63.09 | 80.59 | 37.70 | 53.64 |
| iBOWIMG | – | – | – | – | 61.97 | 76.86 | 37.30 | 54.60 |
表 V:我们最佳模型(更深的 LSTM Q + 归一化 I)的 test-standard 准确率,与相应 VQA 真实图像挑战赛排行榜上其他条目在开放式和选择题任务上的 test-standard 准确率比较(截至 2016 年 10 月 28 日)。
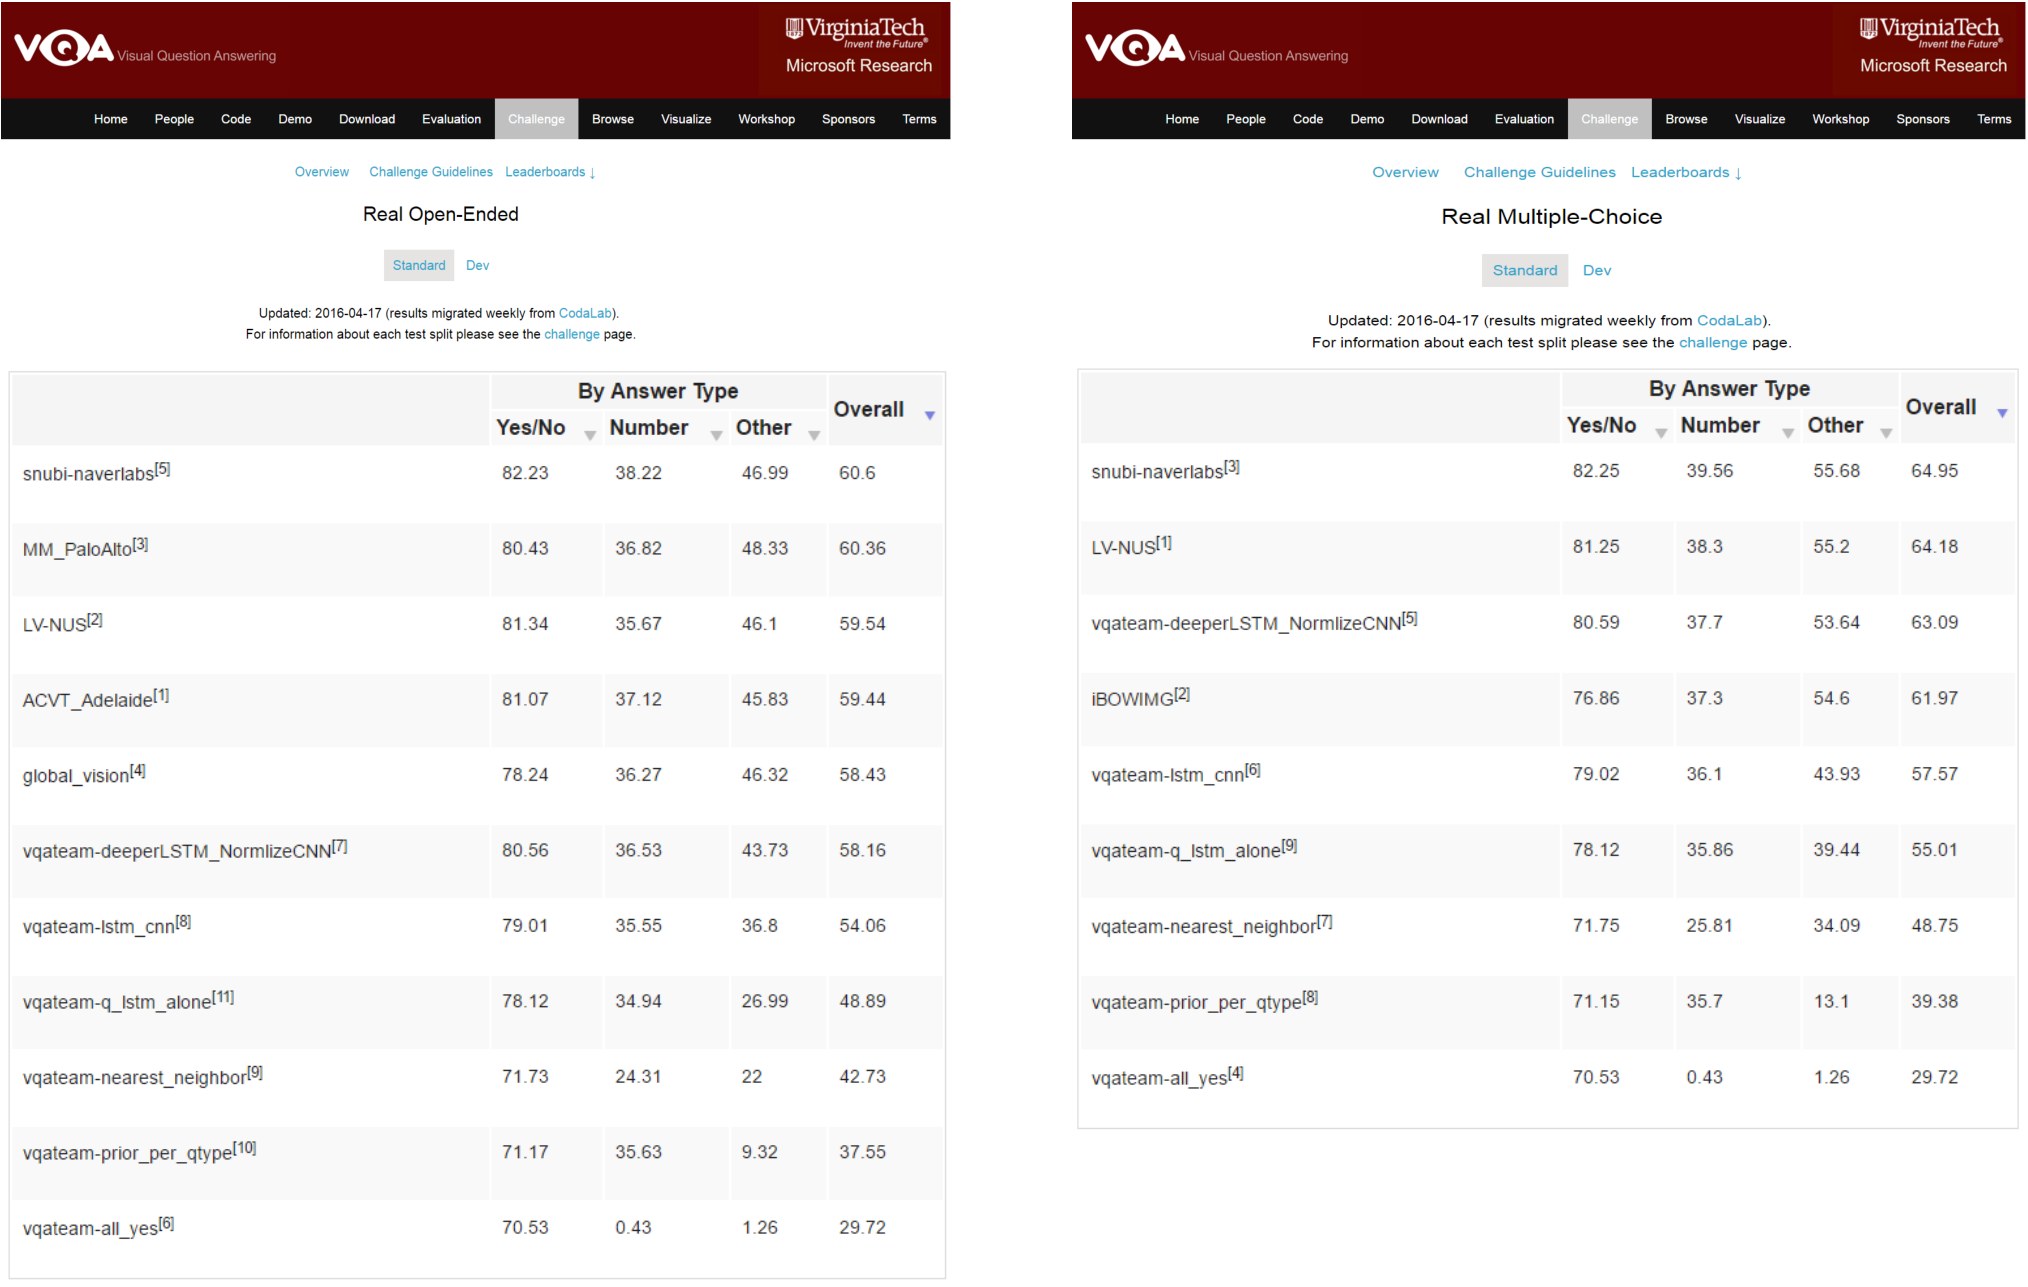
Fig. 13: Leaderboard showing test-standard accuracies for VQA Real Image Challenge (Open-Ended) on left and leaderboard showing test-standard accuracies for VQA Real Image Challenge (Multiple-Choice) on right (snapshot from October 28, 2016).
图 13:左为 VQA 真实图像挑战赛(开放式)的 test-standard 准确率排行榜,右为 VQA 真实图像挑战赛(选择题)的 test-standard 准确率排行榜(截取自 2016 年 10 月 28 日)。
VII Conclusion and Discussion
VII 结论与讨论
In conclusion, we introduce the task of Visual Question Answering (VQA). Given an image and an open-ended, natural language question about the image, the task is to provide an accurate natural language answer. We provide a dataset containing over 250K images, 760K questions, and around 10M answers. We demonstrate the wide variety of questions and answers in our dataset, as well as the diverse set of AI capabilities in computer vision, natural language processing, and commonsense reasoning required to answer these questions accurately.
总之,我们引入了视觉问答(VQA)这一任务。给定一张图像,以及一个关于该图像的开放式自然语言问题,任务是给出准确的自然语言答案。我们提供了一个包含超过 25 万张图像、76 万个问题和大约 1,000 万条答案的数据集。我们展示了数据集中问题和答案的广泛多样性,以及准确回答这些问题所需的计算机视觉、自然语言处理和常识推理方面的多样化人工智能能力。
The questions we solicited from our human subjects were open-ended and not task-specific. For some application domains, it would be useful to collect task-specific questions. For instance, questions may be gathered from subjects who are visually impaired [3], or the questions could focused on one specific domain (say sports). Bigham et al. [3] created an application that allows the visually impaired to capture images and ask open-ended questions that are answered by human subjects. Interestingly, these questions can rarely be answered using generic captions. Training on task-specific datasets may help enable practical VQA applications.
我们向人类受试者征集的问题是开放式的,并不针对特定任务。对某些应用领域,收集任务特定的问题会更有用。例如,问题可以从视障受试者那里收集 [3],或者问题可以集中在某一个特定领域(比如体育)。Bigham 等人 [3] 创建了一个应用,让视障者可以拍摄图像并提出开放式问题,再由人类受试者作答。有意思的是,这些问题很少能用通用描述来回答。在任务特定的数据集上训练,可能有助于实现实用的 VQA 应用。
We believe VQA has the distinctive advantage of pushing the frontiers on “AI-complete” problems, while being amenable to automatic evaluation. Given the recent progress in the community, we believe the time is ripe to take on such an endeavor.
我们相信,VQA 具有推进“人工智能完备”问题前沿的独特优势,同时又便于自动评测。鉴于社区近来的进展,我们认为着手这项工作的时机已经成熟。
Acknowledgements. We would like to acknowledge the countless hours of effort provided by the workers on Amazon Mechanical Turk. This work was supported in part by the The Paul G. Allen Family Foundation via an award to D.P., ICTAS at Virginia Tech via awards to D.B. and D.P., Google Faculty Research Awards to D.P. and D.B., the National Science Foundation CAREER award to D.B., the Army Research Office YIP Award to D.B., and a Office of Naval Research grant to D.B.
致谢。 我们要感谢 Amazon Mechanical Turk 上的工人所付出的无数小时劳动。本工作部分得到 The Paul G. Allen Family Foundation 对 D.P. 的资助、弗吉尼亚理工大学 ICTAS 对 D.B. 和 D.P. 的资助、Google Faculty Research Awards 对 D.P. 和 D.B. 的资助、美国国家科学基金会 CAREER 奖对 D.B. 的资助、陆军研究办公室 YIP 奖对 D.B. 的资助,以及海军研究办公室对 D.B. 的一项资助。
Appendix Overview
附录概览
In the appendix, we provide:
在附录中,我们提供:
I - Additional analysis comparing captions and Q&A data
I —— 比较描述与问答数据的补充分析
II - Qualitative visualizations for “What is” questions
II —— “What is” 问题的定性可视化
III - Human accuracy on multiple-choice questions
III —— 人类在选择题上的准确率
IV - Details on VQA baselines
IV —— VQA 基线的细节
V - “Age” and “Commonsense” of our model
V —— 我们模型的“年龄”与“常识”
VI - Details on the abstract scene dataset
VI —— 抽象场景数据集的细节
VII - User interfaces used to collect the dataset
VII —— 用来收集数据集的用户界面
VIII - List of the top answers in the dataset
VIII —— 数据集中出现最多的答案列表
IX - Additional examples from the VQA dataset
IX —— VQA 数据集中的更多示例
Appendix I: Captions vs. Questions
附录 I:描述与问题
Do questions and answers provide further information about the visual world beyond that captured by captions? One method for determining whether the information captured by questions & answers is different from the information captured by captions is to measure some of the differences in the word distributions from the two datasets. We cast this comparison in terms of nouns, verbs, and adjectives by extracting all words from the caption data (MS COCO captions for real images and captions collected by us for abstract scenes) using the Stanford part-of-speech (POS)[^6] tagger [49]. We normalize the word frequencies from captions, questions, and answers per image, and compare captions vs. questions and answers combined. Using a Kolmogorov-Smirnov test to determine whether the underlying distributions of the two datasets differ, we find a significant difference for all three parts of speech (p .001) for both real images and abstract scenes. This helps motivate the VQA task as a way to learn information about visual scenes; although both captions and questions & answers provide information about the visual world, they do it from different perspectives, with different underlying biases [20], and can function as complementary to one another.
问题和答案是否提供了描述所未捕捉的、关于视觉世界的进一步信息?判断问答所捕捉的信息是否不同于描述所捕捉的信息的一种方法,是度量这两个数据集中词分布的若干差异。我们从描述数据(真实图像用 MS COCO 描述,抽象场景用我们收集的描述)中,用斯坦福词性(POS)[^6]标注器 [49] 抽取全部词,把比较表述为名词、动词和形容词。我们按图像对描述、问题和答案中的词频做归一化,再比较描述与问题和答案的合并结果。用 Kolmogorov-Smirnov 检验判断两个数据集的底层分布是否不同,我们发现对全部三种词性,真实图像和抽象场景都存在显著差异(p .001)。这有助于把 VQA 任务论证为一种学习视觉场景信息的途径;尽管描述和问答都提供关于视觉世界的信息,它们是从不同视角出发的,带有不同的底层偏差 [20],可以互为补充。
We illustrate the similarities and differences between the word distributions in captions vs. questions & answers as Venn-style word clouds [10] with size indicating the normalized count – Fig. 15 (nouns), Fig. 16 (verbs), and Fig. 17 (adjectives) for real images and Fig. 18 (nouns), Fig. 19 (verbs), and Fig. 20 (adjectives) for abstract scenes.[^7] The left side shows the top words in questions & answers, the right the top words in captions, and the center the words common to both, with size indicating the harmonic mean of the counts.
我们用维恩风格词云 [10] 说明描述与问答中词分布的异同,词的大小表示归一化计数——真实图像见图 15(名词)、图 16(动词)和图 17(形容词),抽象场景见图 18(名词)、图 19(动词)和图 20(形容词)。[^7] 左侧是问答中出现最多的词,右侧是描述中出现最多的词,中间是二者共有的词,大小表示计数的调和平均。
We see that adjectives in captions capture some clearly visual properties discussed in previous work on vision to language [41], such as material and pattern, while the questions & answers have more adjectives that capture what is usual (e.g., “dominant”, “approximate”, “higher”) and other kinds of commonsense properties (e.g., “edible”, “possible”, “unsafe”, “acceptable”). Interestingly, we see that question & answer nouns capture information about “ethnicity” and “hairstyle”, while caption nouns capture information about pluralized visible objects (e.g., “cellphones”, “daughters”) and groups (e.g., “trio”, “some”), among other differences. “Man” and “people” are common in both captions and questions & answers.
我们看到,描述中的形容词捕捉了此前视觉到语言工作 [41] 中讨论过的一些明显视觉属性,例如材料和图案,而问答中则有更多捕捉“通常情况”的形容词(例如 “dominant”、“approximate”、“higher”)以及其他种类的常识属性(例如 “edible”、“possible”、“unsafe”、“acceptable”)。有意思的是,我们看到问答中的名词捕捉了关于 “ethnicity” 和 “hairstyle” 的信息,而描述中的名词则捕捉了关于复数可见对象(例如 “cellphones”、“daughters”)和群体(例如 “trio”、“some”)的信息,此外还有其他差别。“Man” 和 “people” 在描述和问答中都很常见。
One key piece to understanding the visual world is understanding spatial relationships, and so we additionally extract spatial prepositions and plot their proportions in the captions vs. the questions & answers data in Fig. 14 (left) for real images and Fig. 14 (right) for abstract scenes. We see that questions & answers have a higher proportion of specific spatial relations (i.e., “in”, “on”) compared to captions, which have a higher proportion of general spatial relations (i.e., “with”, “near”).
理解视觉世界的一个关键部分是理解空间关系,因此我们另外抽取了空间介词,并在图 14(左,真实图像)和图 14(右,抽象场景)中画出它们在描述与问答数据中的比例。我们看到,与描述相比,问答中具体空间关系(即 “in”、“on”)的比例更高,而描述中一般空间关系(即 “with”、“near”)的比例更高。
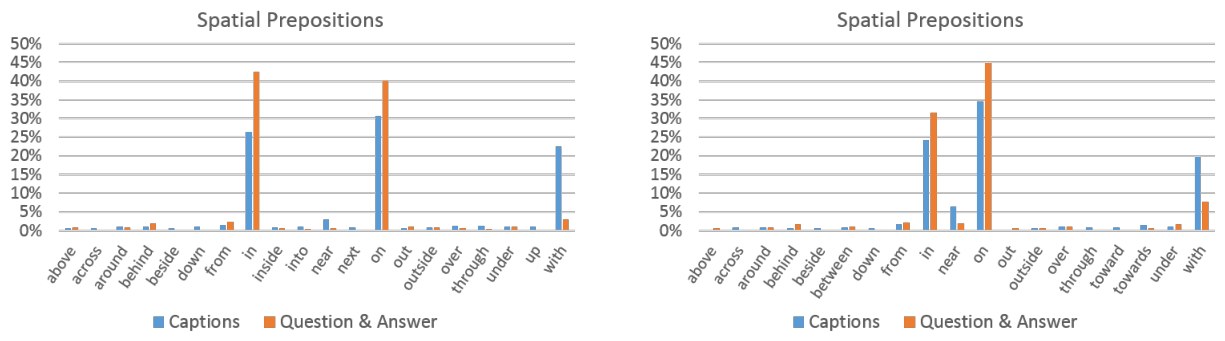
Fig. 14: Proportions of spatial prepositions in the captions and question & answers for real images (left) and abstract scenes (right).
图 14:真实图像(左)和抽象场景(右)中,描述与问答里空间介词的比例。
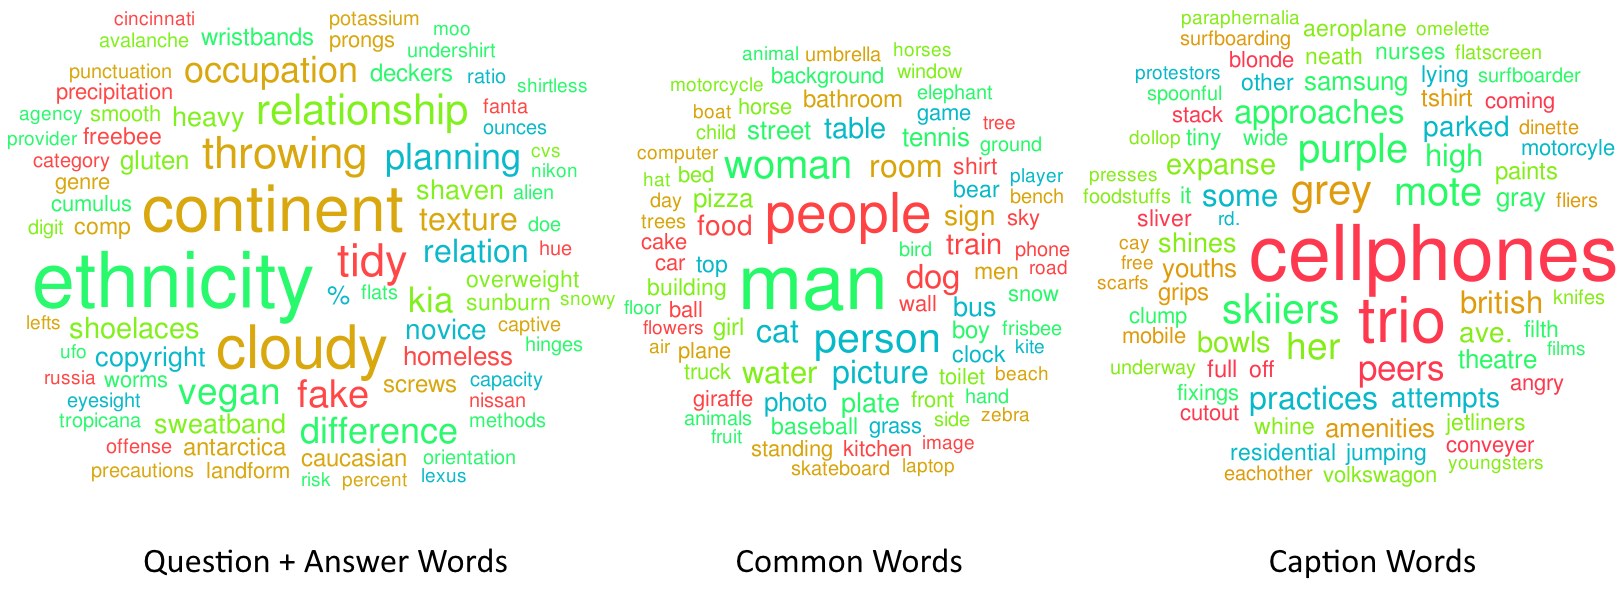
Fig. 15: Venn-style word clouds [10] for nouns with size indicating the normalized count for real images.
图 15:真实图像上名词的维恩风格词云 [10],大小表示归一化计数。
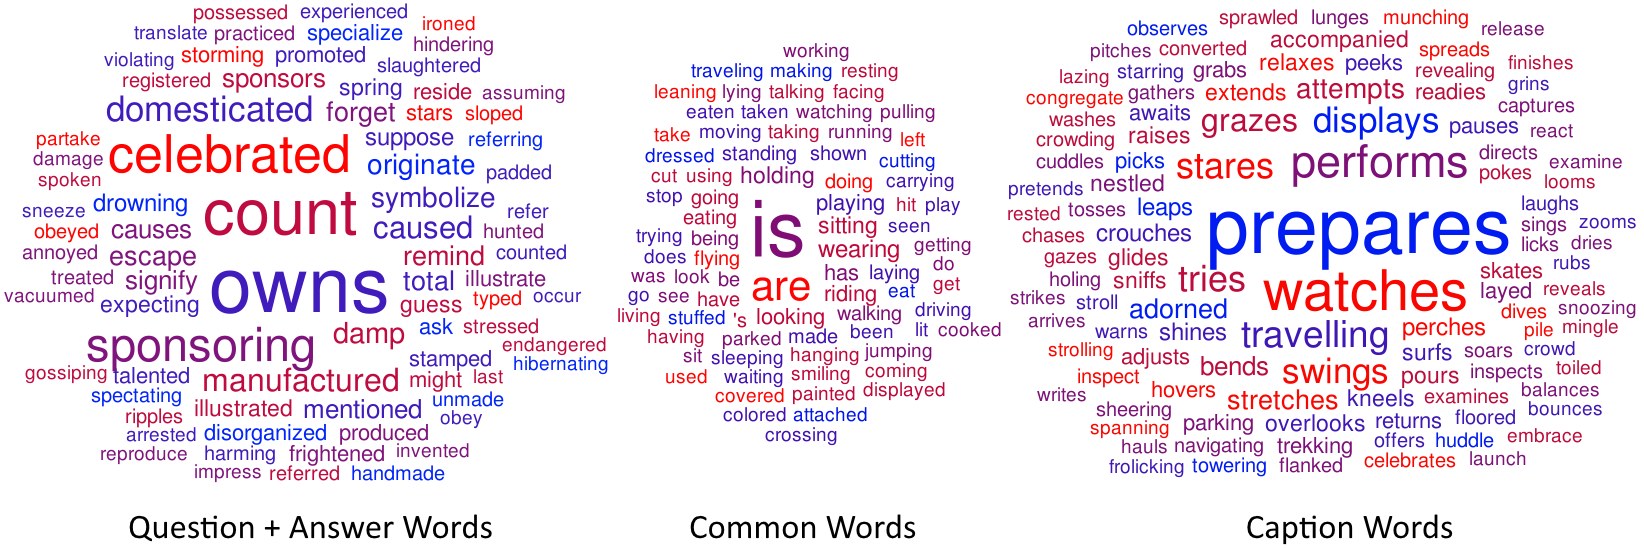
Fig. 16: Venn-style word clouds [10] for verbs with size indicating the normalized count for real images.
图 16:真实图像上动词的维恩风格词云 [10],大小表示归一化计数。
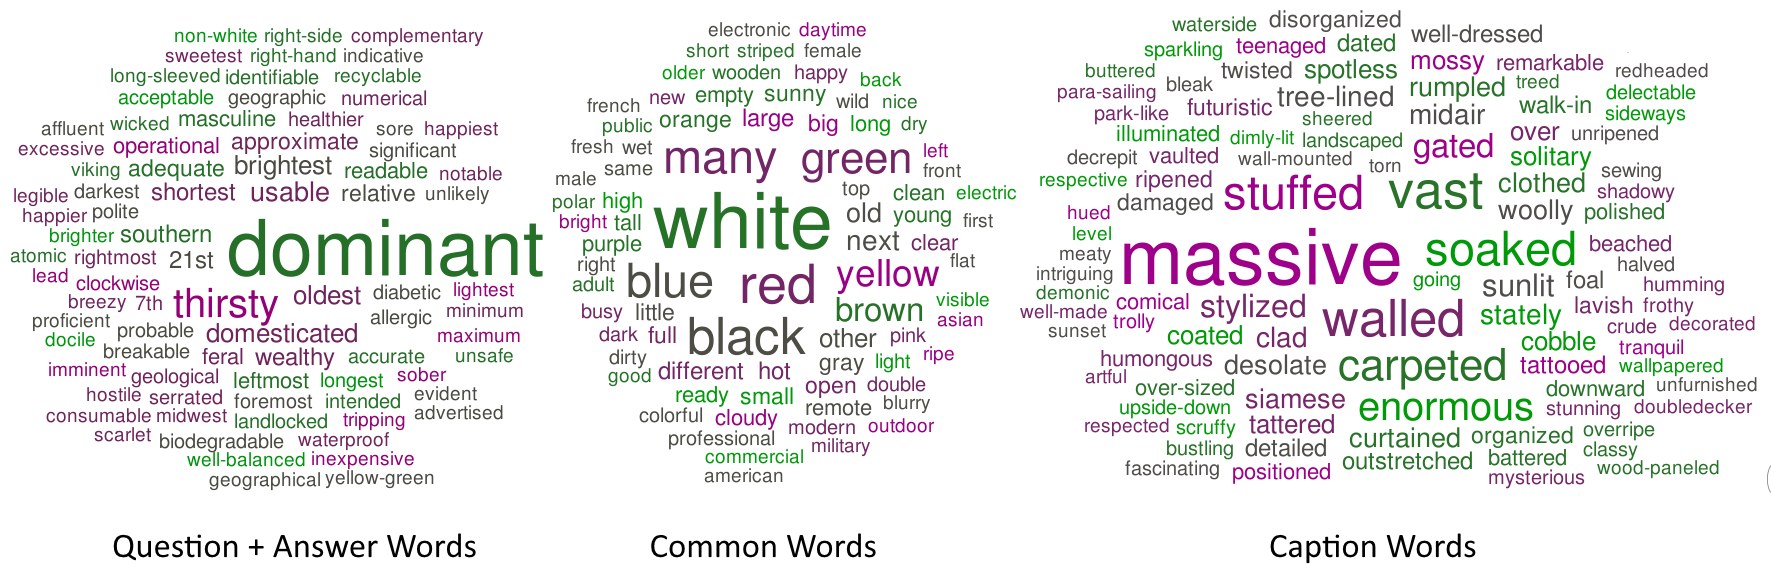
Fig. 17: Venn-style word clouds [10] for adjectives with size indicating the normalized count for real images.
图 17:真实图像上形容词的维恩风格词云 [10],大小表示归一化计数。
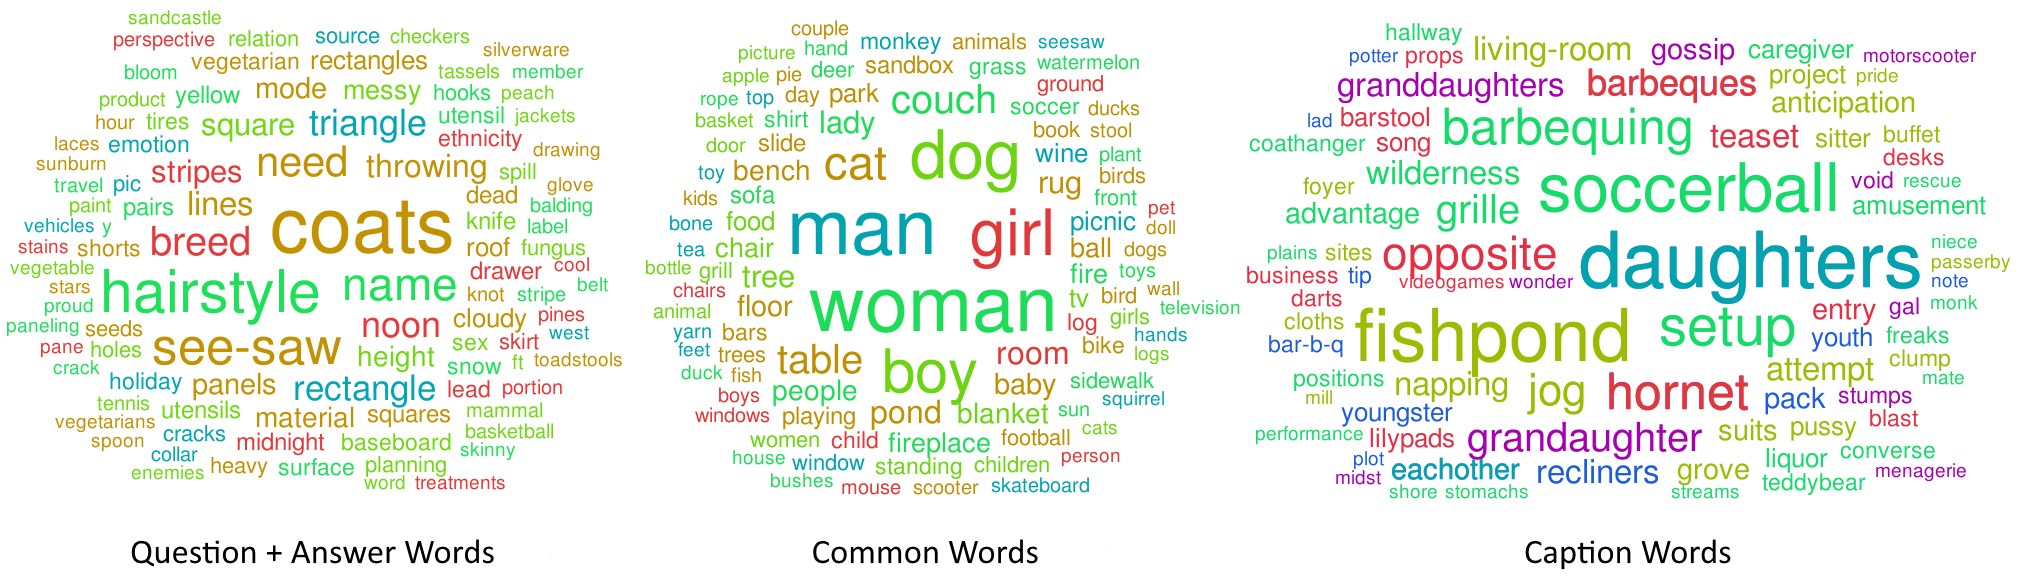
Fig. 18: Venn-style word clouds [10] for nouns with size indicating the normalized count for abstract scenes.
图 18:抽象场景上名词的维恩风格词云 [10],大小表示归一化计数。
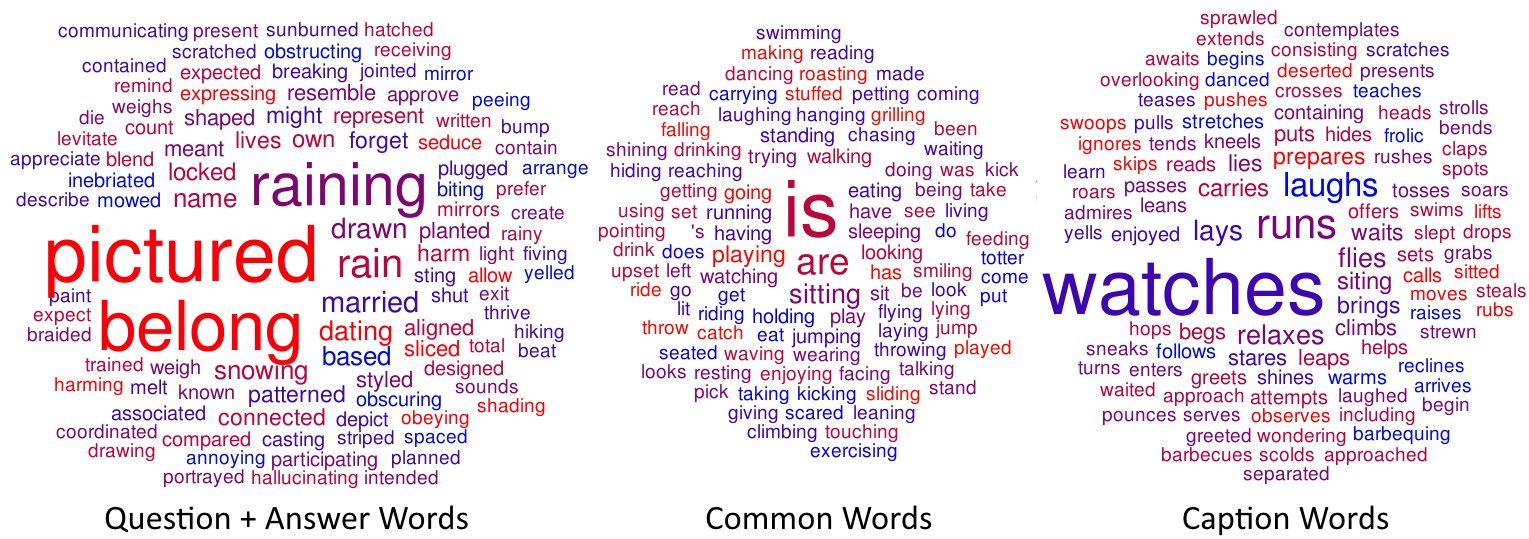
Fig. 19: Venn-style word clouds [10] for verbs with size indicating the normalized count for abstract scenes.
图 19:抽象场景上动词的维恩风格词云 [10],大小表示归一化计数。
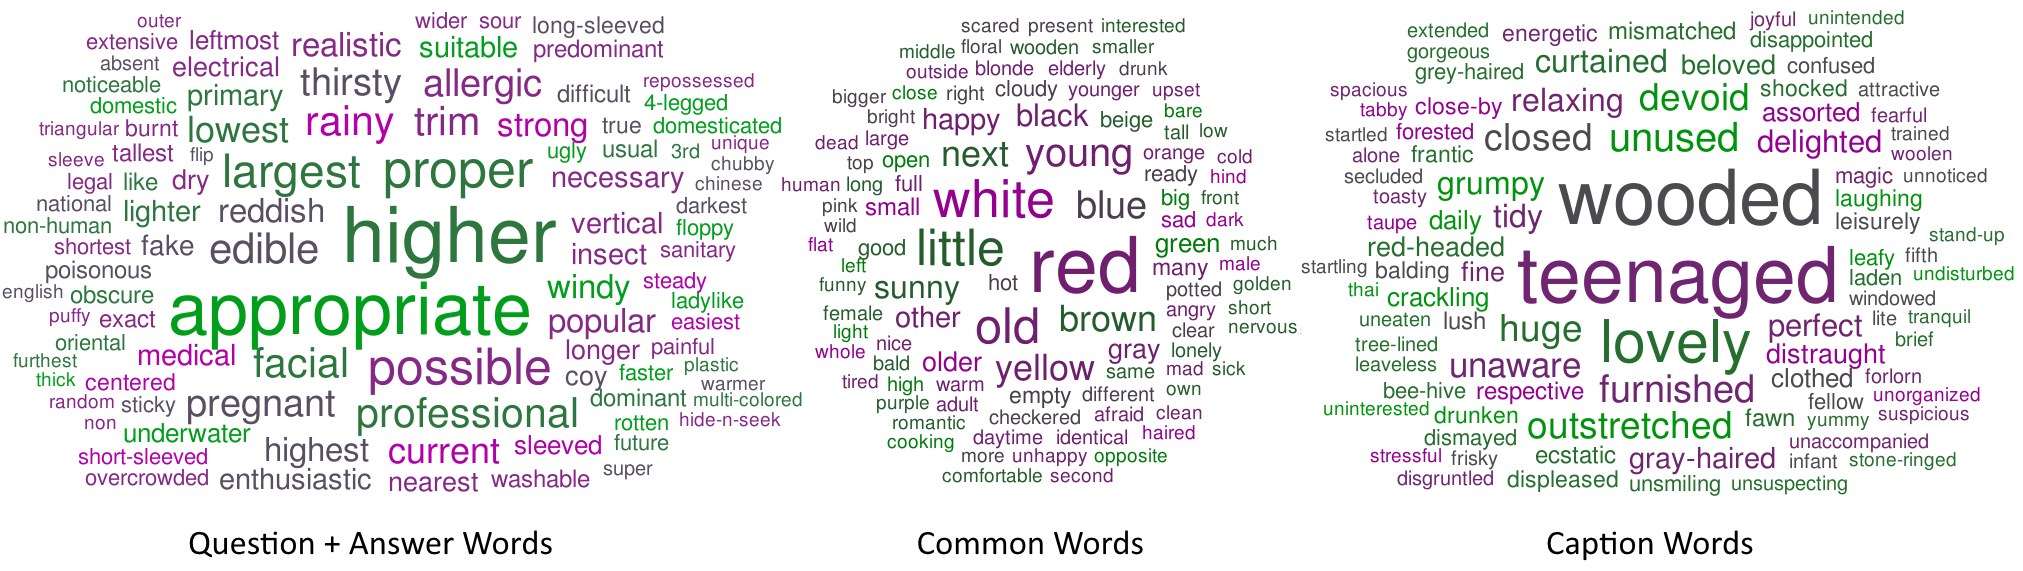
Fig. 20: Venn-style word clouds [10] for adjectives with size indicating the normalized count for abstract scenes.
图 20:抽象场景上形容词的维恩风格词云 [10],大小表示归一化计数。
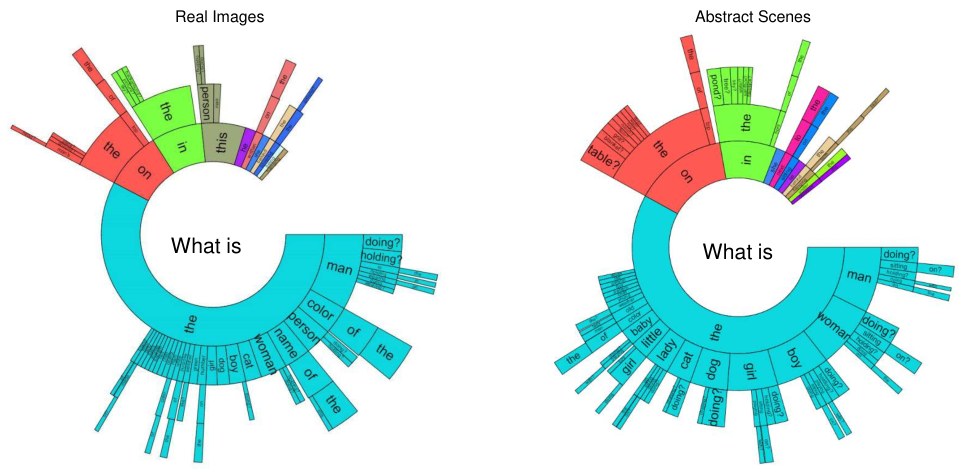
Fig. 21: Distribution of questions starting with “What is” by their first five words for a random sample of 60K questions for real images (left) and all questions for abstract scenes (right). The ordering of the words starts towards the center and radiates outwards. The arc length is proportional to the number of questions containing the word. White areas are words with contributions too small to show.
图 21:以 “What is” 开头的问题按前五个词划分的分布。左边是真实图像上随机抽取的 6 万个问题,右边是抽象场景的全部问题。词的顺序从中心开始向外辐射。弧长与包含该词的问题数成正比。白色区域是贡献太小、无法显示的词。
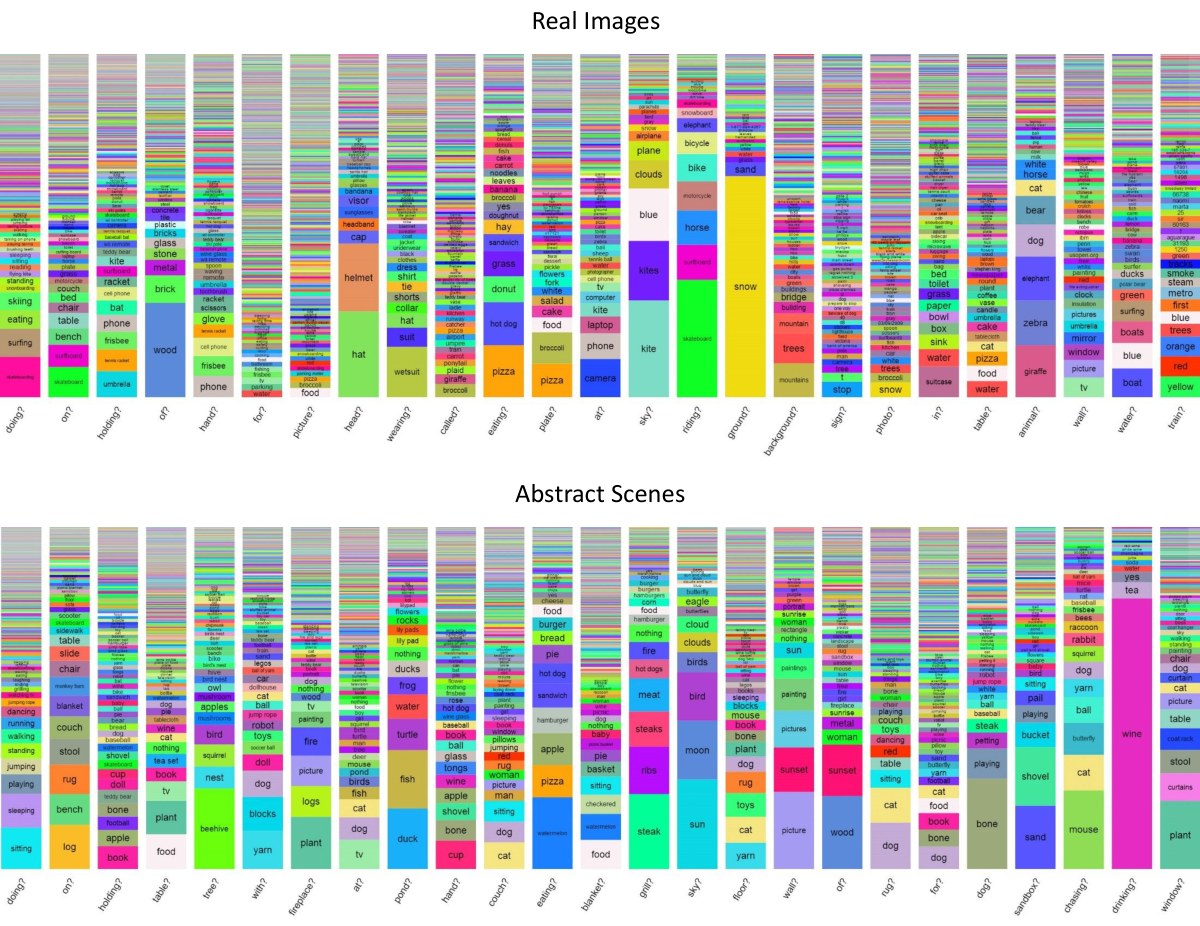
Fig. 22: Distribution of answers for questions starting with “What is” for a random sample of 60K questions for real images (top) and all questions for abstract scenes (bottom). Each column corresponds to questions ending in different words, such as “doing?”, “on?”, etc.
图 22:以 “What is” 开头的问题的答案分布。上图是真实图像上随机抽取的 6 万个问题,下图是抽象场景的全部问题。每一列对应于以不同词结尾的问题,例如 “doing?”、“on?” 等。
Appendix II: “What is” Analysis
附录 II:“What is” 分析
In Fig. 21, we show the distribution of questions starting with “What is” by their first five words for both real images and abstract scenes. Note the diversity of objects referenced in the questions, as well as, the relations between objects, such as “holding” and “sitting on”. In Fig. 22, we show the distribution of answers for “What is” questions ending in different words. For instance, questions ending in “eating” have answers such as “pizza”, “watermelon” and “hot dog”. Notice the diversity in answers for some questions, such as those that end with “for?” or “picture?”. Other questions result in intuitive responses, such as “holding?” and the response “umbrella”.
在图 21 中,我们给出了真实图像和抽象场景上以 “What is” 开头的问题按前五个词划分的分布。请注意问题中所提到对象的多样性,以及对象之间的关系,例如 “holding” 和 “sitting on”。在图 22 中,我们给出了以不同词结尾的 “What is” 问题的答案分布。例如,以 “eating” 结尾的问题,答案有 “pizza”、“watermelon” 和 “hot dog”。请注意某些问题的答案多样性,例如以 “for?” 或 “picture?” 结尾的问题。另一些问题则会引出直观的回答,例如 “holding?” 和回答 “umbrella”。
Appendix III: Multiple-Choice Human Accuracy
附录 III:选择题上的人类准确率
To compute human accuracy for multiple-choice questions, we collected three human answers per question on a random subset of 3,000 questions for both real images and abstract scenes. In Table VI, we show the human accuracies for multiple choice questions. Table VI also shows the inter-human agreement for open-ended answer task. In comparison to open-ended answer, the multiple-choice accuracies are more or less same for “yes/no” questions and significantly better ( increase for real images and increase for abstract scenes) for “other” questions. Since “other” questions may be ambiguous, the increase in accuracy using multiple choice is not surprising.
为了计算选择题的人类准确率,我们在真实图像和抽象场景上各随机抽取 3,000 个问题,每个问题收集三条人类答案。表 VI 给出了选择题的人类准确率。表 VI 也给出了开放式答题任务的人与人一致。与开放式答案相比,选择题准确率对“是否”问题大致相同,对“其他”问题则显著更好(真实图像约提高 ,抽象场景约提高 )。由于“其他”问题可能有歧义,使用选择题后准确率上升并不令人惊讶。
| Dataset | Accuracy Metric | All | Yes/No | Number | Other |
|---|---|---|---|---|---|
| MC majority vote | 91.54 | 97.40 | 86.97 | 87.91 | |
| Real | MC average | 88.53 | 94.40 | 84.99 | 84.64 |
| Open-Ended | 80.62 | 94.78 | 78.46 | 69.69 | |
| MC majority vote | 93.57 | 97.78 | 96.71 | 88.73 | |
| Abstract | MC average | 90.40 | 94.59 | 94.36 | 85.32 |
| Open-Ended | 85.66 | 95.32 | 94.17 | 74.12 |
TABLE VI: For each of the two datasets, real and abstract, first two rows are the human accuracies for multiple-choice questions when subjects were shown both the image and the question. Majority vote means we consider the answer picked by majority of the three subjects to be the predicted answer by humans and compute accuracy of that answer for each question. Average means we compute the accuracy of each of the answers picked by the subjects and record their average for each question. The last row is the inter-human agreement for open-ended answers task when subjects were shown both the image and the question. All accuracies are evaluated on a random subset of 3000 questions.
| 数据集 | 准确率度量 | 全部 | 是否 | 数字 | 其他 |
|---|---|---|---|---|---|
| 选择题多数票 | 91.54 | 97.40 | 86.97 | 87.91 | |
| 真实 | 选择题平均 | 88.53 | 94.40 | 84.99 | 84.64 |
| 开放式 | 80.62 | 94.78 | 78.46 | 69.69 | |
| 选择题多数票 | 93.57 | 97.78 | 96.71 | 88.73 | |
| 抽象 | 选择题平均 | 90.40 | 94.59 | 94.36 | 85.32 |
| 开放式 | 85.66 | 95.32 | 94.17 | 74.12 |
表 VI:对真实和抽象这两个数据集,前两行是在向受试者同时展示图像和问题时,选择题的人类准确率。多数票意味着我们把三名受试者中多数所选的答案视为人类的预测答案,并计算该答案在每个问题上的准确率。平均意味着我们计算受试者所选每个答案的准确率,并记录每个问题的平均值。最后一行是在向受试者同时展示图像和问题时,开放式答题任务的人与人一致。全部准确率都在随机抽取的 3,000 个问题子集上评测。
Appendix IV: Details on VQA baselines
附录 IV:VQA 基线的细节
“per Q-type prior” baseline. We decide on different question types based on first few words of questions in the real images training set and ensure that each question type has at least 30 questions in the training dataset. The most popular answer for each question type is also computed on real images training set.
“按问题类型的先验”基线。 我们根据真实图像训练集中问题开头的几个词来确定不同的问题类型,并确保每个问题类型在训练数据集中至少有 30 个问题。每个问题类型最流行的答案也在真实图像训练集上计算。
“nearest neighbor” baseline. For every question in the VQA test-standard set, we find its nearest neighbor questions in the training set using cosine similarity in Skip-Thought [27] feature space. We also experimented with bag of words and Word2Vec [39] feature spaces but we obtained the best performance with Skip-Thought. In this set of questions and their associated images, we find the image which is most similar to the query image using cosine similarity in fc7 feature space. We use the fc7 features from the caffenet model in BVLC Caffe [23]. The most common ground truth answer of this most similar image and question pair is the predicted answer for the query image and question pair. We pick on the test-dev set.
“最近邻”基线。 对 VQA test-standard 集中的每个问题,我们在 Skip-Thought [27] 特征空间中用余弦相似度,在训练集中找出它的 个最近邻问题。我们也实验过词袋和 Word2Vec [39] 特征空间,但 Skip-Thought 的表现最好。在这 个问题及其关联图像的集合中,我们在 fc7 特征空间中用余弦相似度找出与查询图像最相似的图像。我们使用 BVLC Caffe [23] 中 caffenet 模型的 fc7 特征。这个最相似图像–问题对最常见的标准答案,就是查询图像–问题对的预测答案。我们在 test-dev 集上选取 。
Appendix V: “Age” and “Commonsense” of our model
附录 V:我们模型的“年龄”与“常识”
We estimate the age and degree of commonsense of our best model (deeper LSTM Q + norm I), selected using VQA test-dev accuracies). To estimate the age, we compute a weighted average of the average age per question, weighted by the accuracy of the model’s predicted answer for that question, on the subset of questions in the VQA validation set for which we have age annotations (how old a human needs to be to answer the question correctly). To estimate the degree of commonsense, we compute a weighted average of the average degree of commonsense per question, weighted by the accuracy of the model’s predicted answer for that question, on the subset of questions in the VQA validation set for which we have commonsense annotations (whether the question requires commonsense to answer it).
我们估计按 VQA test-dev 准确率选定的最佳模型(更深的 LSTM Q + 归一化 I)的年龄和常识程度。为了估计年龄,我们在 VQA 验证集中有年龄标注(一个人要多大才能正确回答该问题)的问题子集上,按该问题的平均年龄做加权平均,权重为模型对该问题所预测答案的准确率。为了估计常识程度,我们在 VQA 验证集中有常识标注(该问题是否需要常识才能回答)的问题子集上,按该问题的平均常识程度做加权平均,权重为模型对该问题所预测答案的准确率。
Appendix VI: Abstract Scenes Dataset
附录 VI:抽象场景数据集
In Fig. 23 (left), we show a subset of the objects that are present in the abstract scenes dataset. For more examples of the scenes generated, please see Fig. 28. The user interface used to create the scenes is shown in Fig. 23 (right). Subjects used a drag-and-drop interface to create the scenes. Each object could be flipped horizontally and scaled. The scale of the object determined the rendering order of the objects. Many objects have different attributes corresponding to different poses or types. Most animals have five different discrete poses. Humans have eight discrete expressions and their poses may be continuously adjusted using a “paperdoll” model [2].
在图 23(左)中,我们给出了抽象场景数据集中所含对象的一个子集。关于所生成场景的更多示例,请见图 28。用于创建场景的用户界面见图 23(右)。受试者使用拖放界面来创建场景。每个对象都可以水平翻转和缩放。对象的尺度决定了对象的绘制顺序。许多对象有对应于不同姿态或类型的不同属性。大多数动物有五种不同的离散姿态。人有八种离散表情,其姿态可以用“纸娃娃”模型连续调节 [2]。
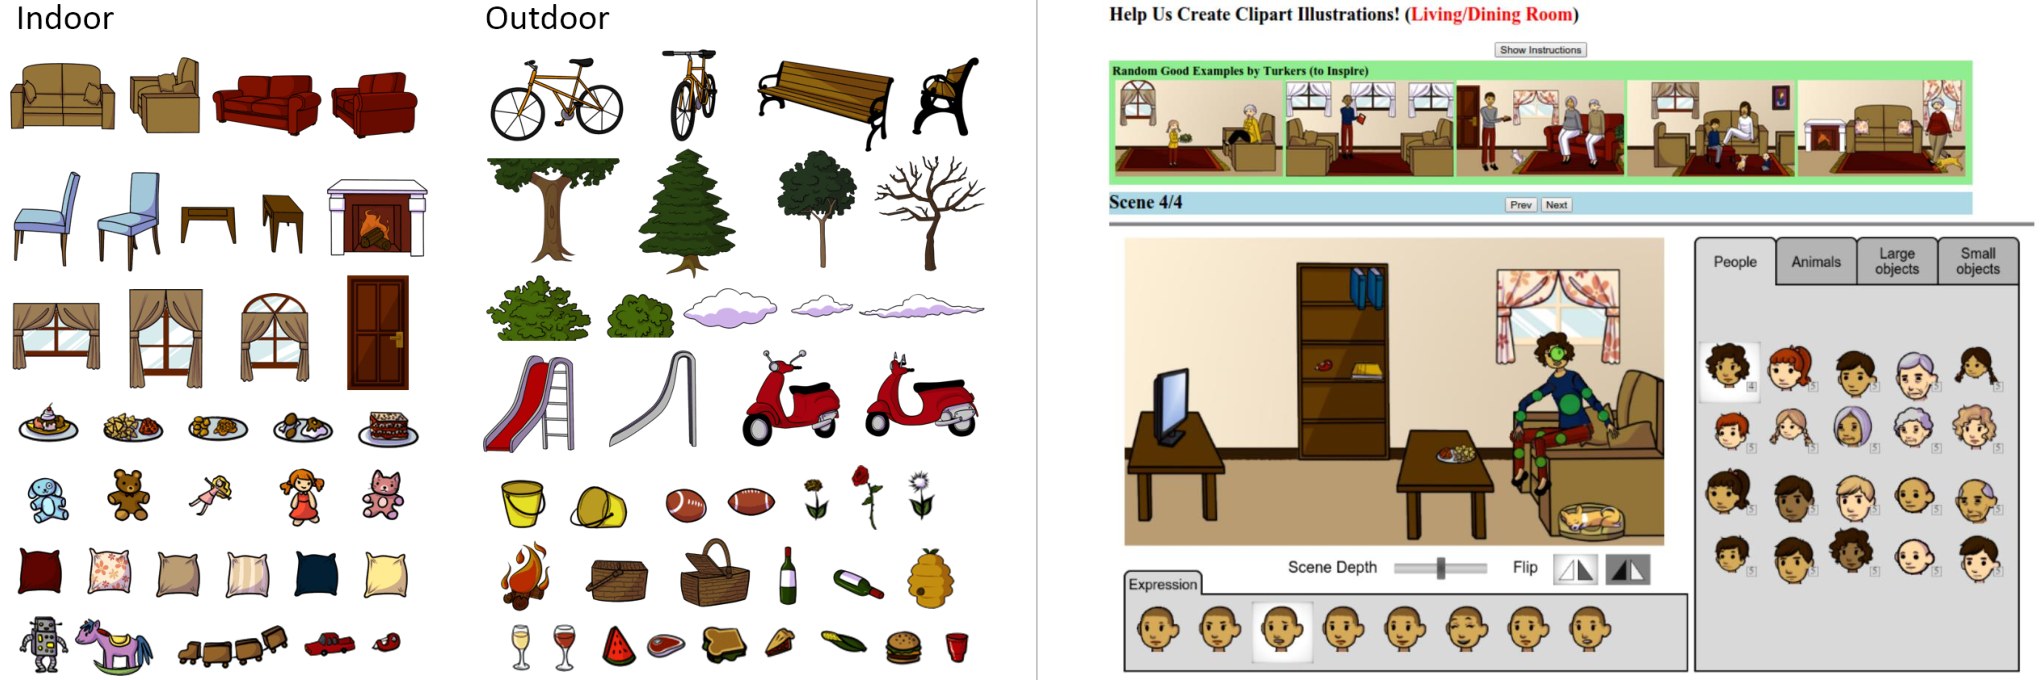
Fig. 23: Left: A small subset of the objects present in the abstract scene dataset. Right: The AMT interface for collecting abstract scenes. The light green circles indicate where users can select to manipulate a person’s pose. Different objects may be added to the scene using the folders to the right.
图 23:左:抽象场景数据集中所含对象的一个小子集。右:收集抽象场景的 AMT 界面。浅绿色圆圈标出用户可以选择以调整人物姿态的位置。可以用右侧的文件夹向场景中添加不同对象。
Appendix VII: User Interfaces
附录 VII:用户界面
In Fig. 24, we show the AMT interface that we used to collect questions for images. Note that we tell the workers that the robot already knows the answer to the previously asked question(s), inspiring them to ask different kinds of questions, thereby increasing the diversity of our dataset.
在图 24 中,我们给出了用来为图像收集问题的 AMT 界面。注意,我们告诉工人,机器人已经知道此前问过的问题的答案,以促使他们提出不同类型的问题,从而增加数据集的多样性。
Fig. 25 shows the AMT interface used for collecting answers to the previously collected questions when subjects were shown the corresponding images. Fig. 26 shows the interface that was used to collect answers to questions when subjects were not shown the corresponding image (i.e., to help in gathering incorrect, but plausible, answers for the multiple-choice task and to assess how accurately the questions can be answered using common sense knowledge alone).
图 25 给出了在向受试者展示相应图像时、用来收集此前已收集问题之答案的 AMT 界面。图 26 给出了在不向受试者展示相应图像时用来收集问题答案的界面(也就是说,用于帮助收集选择题任务中不正确但合理的答案,并评估仅凭常识能多准确地回答这些问题)。
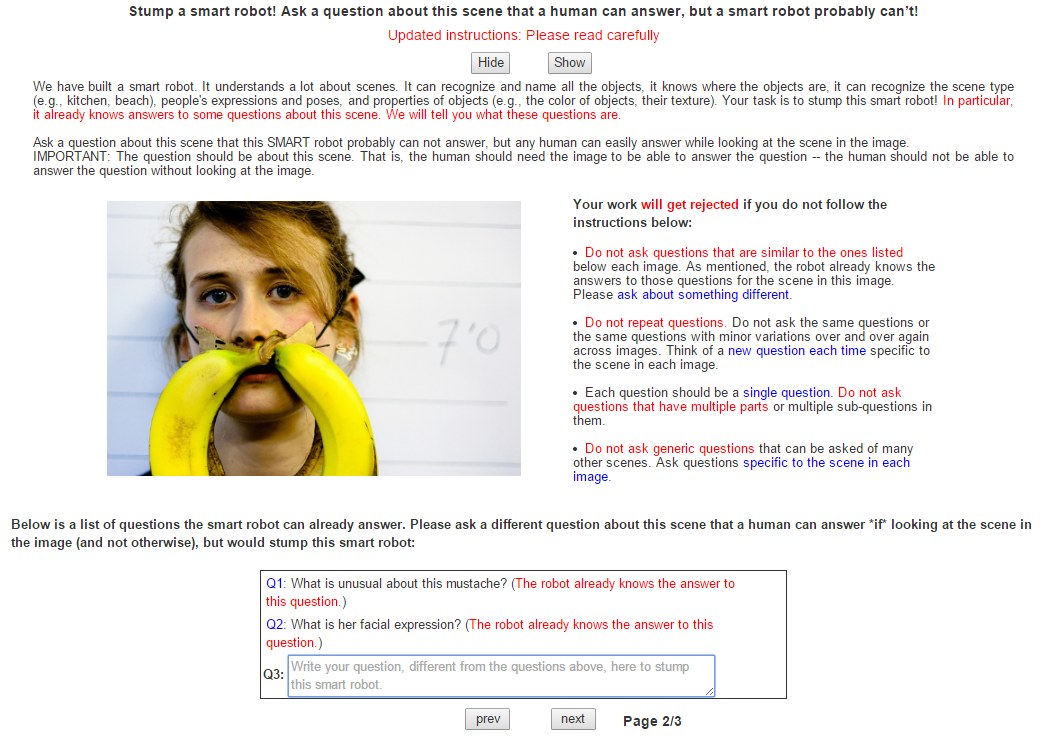
Fig. 24: Our AMT interface for collecting the third question for an image, when subjects were shown previous questions that were collected and were asked to ask a question different from previous questions.
图 24:我们用来为一张图像收集第三个问题的 AMT 界面;此时向受试者展示此前已收集的问题,并请他们提出与此前问题不同的问题。
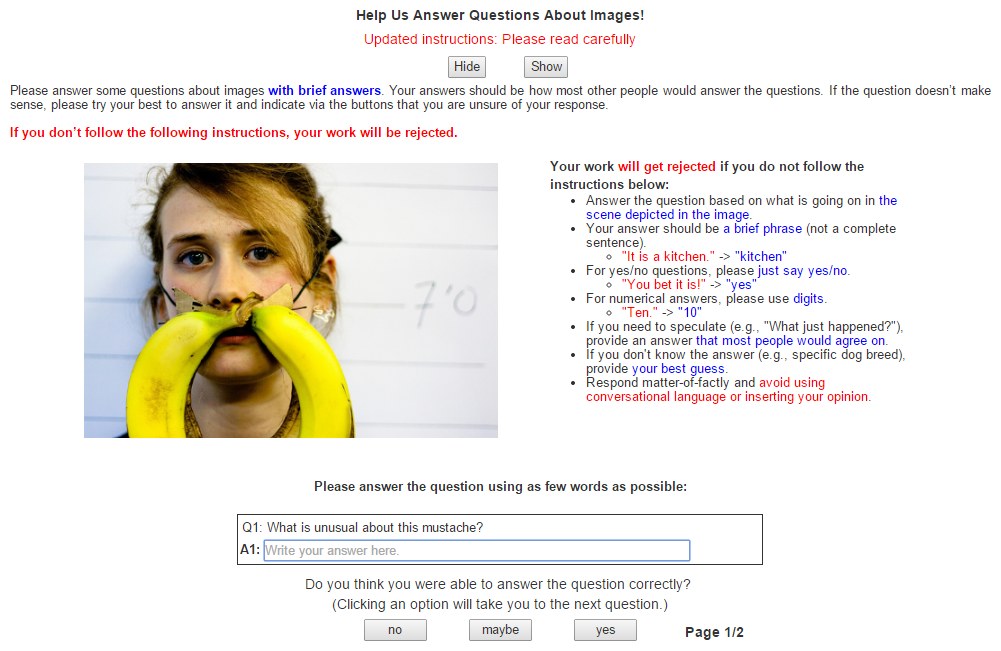
Fig. 25: The AMT interface used to collect answers to a question when subjects were shown the image while answering the question.
图 25:在受试者回答问题时向其展示图像的情况下,用来收集问题答案的 AMT 界面。
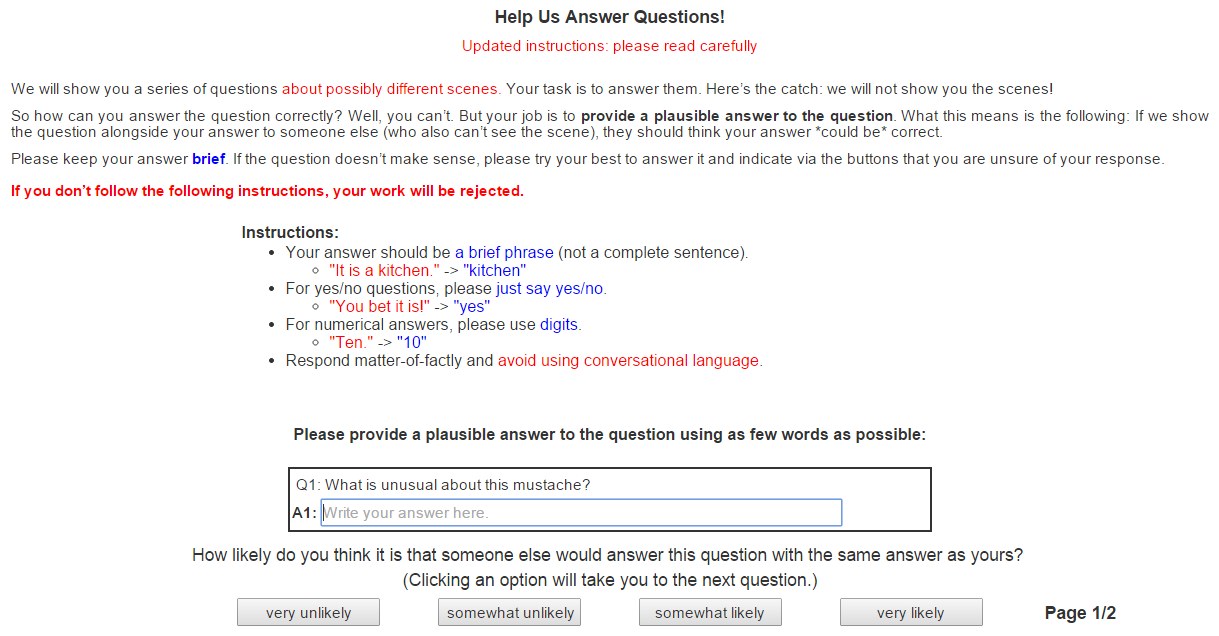
Fig. 26: The AMT interface used to collect answers to a question when subjects were not shown the image while answering the question using only commonsense to collect the plausible, but incorrect, multiple-choice answers.
图 26:在受试者回答问题时不向其展示图像、只凭常识作答的情况下,用来收集问题答案的 AMT 界面,以收集合理但不正确的选择题答案。
Appendix VIII: Answer Distribution
附录 VIII:答案分布
The top answers in our real images dataset along with their counts and percentage counts are given below. The answers have been presented in different colors to show the different Part-of-Speech (POS) tagging of the answers with the following color code: yes/no, noun, verb, adjective, adverb, and numeral.
下面给出我们真实图像数据集中出现最多的 个答案,以及它们的计数和百分比计数。答案用不同颜色呈现,以显示答案的不同词性(POS)标注,颜色编码如下:是否、名词、动词、形容词、副词和数词。
“yes” (566613, 22.82%), “no” (381307, 15.35%), “2” (80031, 3.22%), “1” (46537, 1.87%), “white” (41753, 1.68%), “3” (41334, 1.66%), “red” (33834, 1.36%), “blue” (28881, 1.16%), “4” (27174, 1.09%), “green” (22453, 0.9%), “black” (21852, 0.88%), “yellow” (17312, 0.7%), “brown” (14488, 0.58%), “5” (14373, 0.58%), “tennis” (10941, 0.44%),“baseball” (10299, 0.41%), “6” (10103, 0.41%), “orange” (9136, 0.37%), “0” (8812, 0.35%), “bathroom” (8473, 0.34%), “wood” (8219, 0.33%), “right” (8209, 0.33%), “left” (8058, 0.32%), “frisbee” (7671, 0.31%), “pink” (7519, 0.3%), “gray” (7385, 0.3%), “pizza” (6892, 0.28%), “7” (6005, 0.24%), “kitchen” (5926, 0.24%), “8” (5592, 0.23%), “cat” (5514, 0.22%), “skiing” (5189, 0.21%), “skateboarding” (5122, 0.21%), “dog” (5092, 0.21%), “snow” (4867, 0.2%), “black and white” (4852, 0.2%), “skateboard” (4697, 0.19%), “surfing” (4544, 0.18%), “water” (4513, 0.18%), “giraffe” (4027, 0.16%), “grass” (3979, 0.16%), “surfboard” (3934, 0.16%), “wii” (3898, 0.16%), “kite” (3852, 0.16%), “10” (3756, 0.15%), “purple” (3722, 0.15%), “elephant” (3646, 0.15%), “broccoli” (3604, 0.15%), “man” (3590, 0.14%), “winter” (3490, 0.14%), “stop” (3413, 0.14%), “train” (3226, 0.13%), “9” (3217, 0.13%), “apple” (3189, 0.13%), “silver” (3186, 0.13%), “horse” (3159, 0.13%), “banana” (3151, 0.13%), “umbrella” (3139, 0.13%), “eating” (3117, 0.13%), “sheep” (2927, 0.12%), “bear” (2803, 0.11%), “phone” (2772, 0.11%), “12” (2633, 0.11%), “motorcycle” (2608, 0.11%), “cake” (2602, 0.1%), “wine” (2574, 0.1%), “beach” (2536, 0.1%), “soccer” (2504, 0.1%), “sunny” (2475, 0.1%), “zebra” (2403, 0.1%), “tan” (2402, 0.1%), “brick” (2395, 0.1%), “female” (2372, 0.1%), “bananas” (2350, 0.09%), “table” (2331, 0.09%), “laptop” (2316, 0.09%), “hat” (2277, 0.09%), “bench” (2259, 0.09%), “flowers” (2219, 0.09%), “woman” (2197, 0.09%), “male” (2170, 0.09%), “cow” (2084, 0.08%), “food” (2083, 0.08%), “living room” (2022, 0.08%), “bus” (2011, 0.08%), “snowboarding” (1990, 0.08%), “kites” (1979, 0.08%), “cell phone” (1943, 0.08%), “helmet” (1885, 0.08%), “maybe” (1853, 0.07%), “outside” (1846, 0.07%), “hot dog” (1809, 0.07%), “night” (1805, 0.07%), “trees” (1785, 0.07%), “11” (1753, 0.07%), “bird” (1739, 0.07%), “down” (1732, 0.07%), “bed” (1587, 0.06%), “camera” (1560, 0.06%), “tree” (1547, 0.06%), “christmas” (1544, 0.06%), “fence” (1543, 0.06%), “nothing” (1538, 0.06%), “unknown” (1532, 0.06%), “tennis racket” (1525, 0.06%), “red and white” (1518, 0.06%), “bedroom” (1500, 0.06%), “bat” (1494, 0.06%), “glasses” (1491, 0.06%), “tile” (1487, 0.06%), “metal” (1470, 0.06%), “blue and white” (1440, 0.06%), “fork” (1439, 0.06%), “plane” (1439, 0.06%), “airport” (1422, 0.06%), “cloudy” (1413, 0.06%), “15” (1407, 0.06%), “up” (1399, 0.06%), “blonde” (1398, 0.06%), “day” (1396, 0.06%), “teddy bear” (1386, 0.06%), “glass” (1379, 0.06%), “20” (1365, 0.05%), “beer” (1345, 0.05%), “car” (1331, 0.05%), “sitting” (1328, 0.05%), “boat” (1326, 0.05%), “standing” (1326, 0.05%), “clear” (1318, 0.05%), “13” (1318, 0.05%), “nike” (1293, 0.05%), “sand” (1282, 0.05%), “open” (1279, 0.05%), “cows” (1271, 0.05%), “bike” (1267, 0.05%), “chocolate” (1266, 0.05%), “donut” (1263, 0.05%), “airplane” (1247, 0.05%), “birthday” (1241, 0.05%), “carrots” (1239, 0.05%), “skis” (1220, 0.05%), “girl” (1220, 0.05%), “many” (1211, 0.05%), “zoo” (1204, 0.05%), “suitcase” (1199, 0.05%), “old” (1180, 0.05%), “chair” (1174, 0.05%), “beige” (1170, 0.05%), “ball” (1169, 0.05%), “ocean” (1168, 0.05%), “sandwich” (1168, 0.05%), “tie” (1166, 0.05%), “horses” (1163, 0.05%), “palm” (1163, 0.05%), “stripes” (1155, 0.05%), “fall” (1146, 0.05%), “cheese” (1142, 0.05%), “scissors” (1134, 0.05%), “round” (1125, 0.05%), “chinese” (1123, 0.05%), “knife” (1120, 0.05%), “14” (1110, 0.04%), “toilet” (1099, 0.04%), “don’t know” (1085, 0.04%), “snowboard” (1083, 0.04%), “truck” (1076, 0.04%), “boy” (1070, 0.04%), “coffee” (1070, 0.04%), “cold” (1064, 0.04%), “fruit” (1064, 0.04%), “walking” (1053, 0.04%), “wedding” (1051, 0.04%), “lot” (1050, 0.04%), “sunglasses” (1047, 0.04%), “mountains” (1030, 0.04%), “wall” (1009, 0.04%), “elephants” (1006, 0.04%), “wetsuit” (998, 0.04%), “square” (994, 0.04%), “toothbrush” (989, 0.04%), “sleeping” (986, 0.04%), “fire hydrant” (977, 0.04%), “bicycle” (973, 0.04%), “overcast” (968, 0.04%), “donuts” (961, 0.04%), “plastic” (961, 0.04%), “breakfast” (955, 0.04%), “tv” (953, 0.04%), “paper” (952, 0.04%), “ground” (949, 0.04%), “asian” (938, 0.04%), “plaid” (936, 0.04%), “dirt” (933, 0.04%), “mirror” (928, 0.04%), “usa” (928, 0.04%), “chicken” (925, 0.04%), “plate” (920, 0.04%), “clock” (912, 0.04%), “luggage” (908, 0.04%), “none” (908, 0.04%), “street” (905, 0.04%), “on table” (904, 0.04%), “spoon” (899, 0.04%), “cooking” (898, 0.04%), “daytime” (896, 0.04%), “16” (893, 0.04%), “africa” (890, 0.04%), “stone” (884, 0.04%), “not sure” (873, 0.04%), “window” (868, 0.03%), “sun” (865, 0.03%), “gold” (860, 0.03%), “people” (856, 0.03%), “racket” (847, 0.03%), “zebras” (845, 0.03%), “carrot” (841, 0.03%), “person” (835, 0.03%), “fish” (835, 0.03%), “happy” (824, 0.03%), “circle” (822, 0.03%), “oranges” (817, 0.03%), “backpack” (812, 0.03%), “25” (810, 0.03%), “leaves” (809, 0.03%), “watch” (804, 0.03%), “mountain” (800, 0.03%), “no one” (798, 0.03%), “ski poles” (792, 0.03%), “city” (791, 0.03%), “couch” (790, 0.03%), “afternoon” (782, 0.03%), “jeans” (781, 0.03%), “brown and white” (779, 0.03%), “summer” (774, 0.03%), “giraffes” (772, 0.03%), “computer” (771, 0.03%), “refrigerator” (768, 0.03%), “birds” (762, 0.03%), “child” (761, 0.03%), “park” (759, 0.03%), “flying kite” (756, 0.03%), “restaurant” (747, 0.03%), “evening” (738, 0.03%), “graffiti” (736, 0.03%), “30” (730, 0.03%), “grazing” (727, 0.03%), “flower” (723, 0.03%), “remote” (720, 0.03%), “hay” (719, 0.03%), “50” (716, 0.03%).
Appendix IX: Additional Examples
附录 IX:更多示例
To provide insight into the dataset, we provide additional examples. In Fig. 27, Fig. 28, and Fig. 29, we show a random selection of the VQA dataset for the MS COCO [32] images, abstract scenes, and multiple-choice questions, respectively.
为了提供对数据集的直观认识,我们给出更多示例。在图 27、图 28 和图 29 中,我们分别给出了 VQA 数据集中 MS COCO [32] 图像、抽象场景和选择题的随机选例。
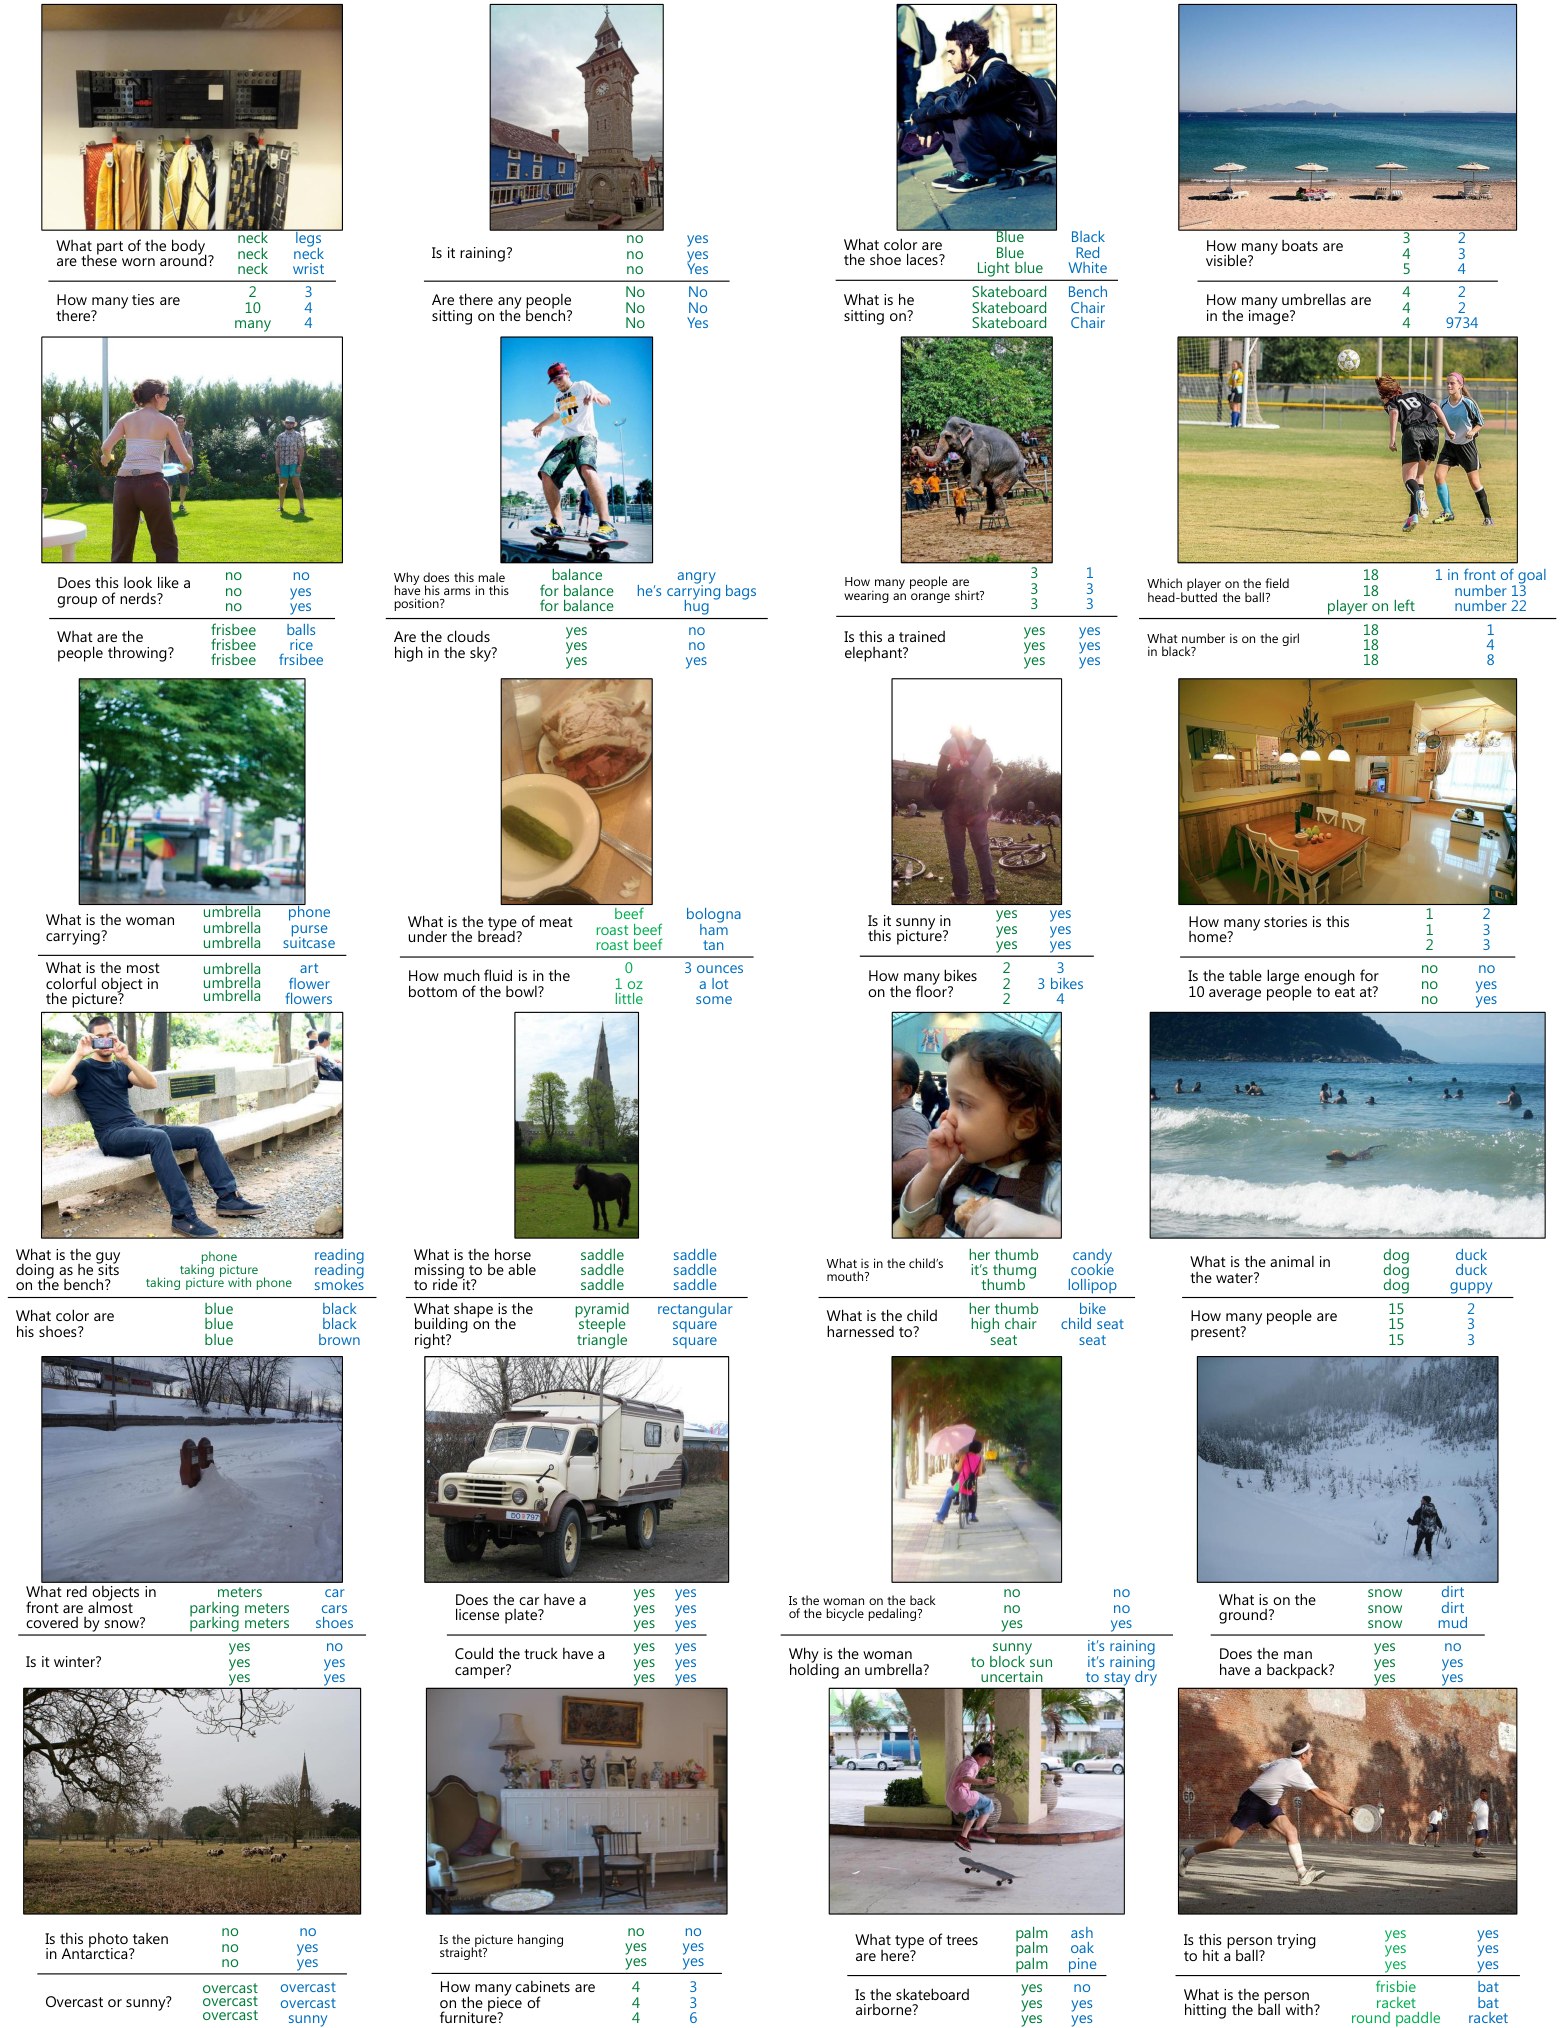
Fig. 27: Random examples of questions (black), (a subset of the) answers given when looking at the image (green), and answers given when not looking at the image (blue) for numerous representative examples of the real image dataset.
图 27:真实图像数据集中大量代表性示例的随机例子:问题(黑色)、看图时给出的答案(子集,绿色),以及不看图时给出的答案(蓝色)。
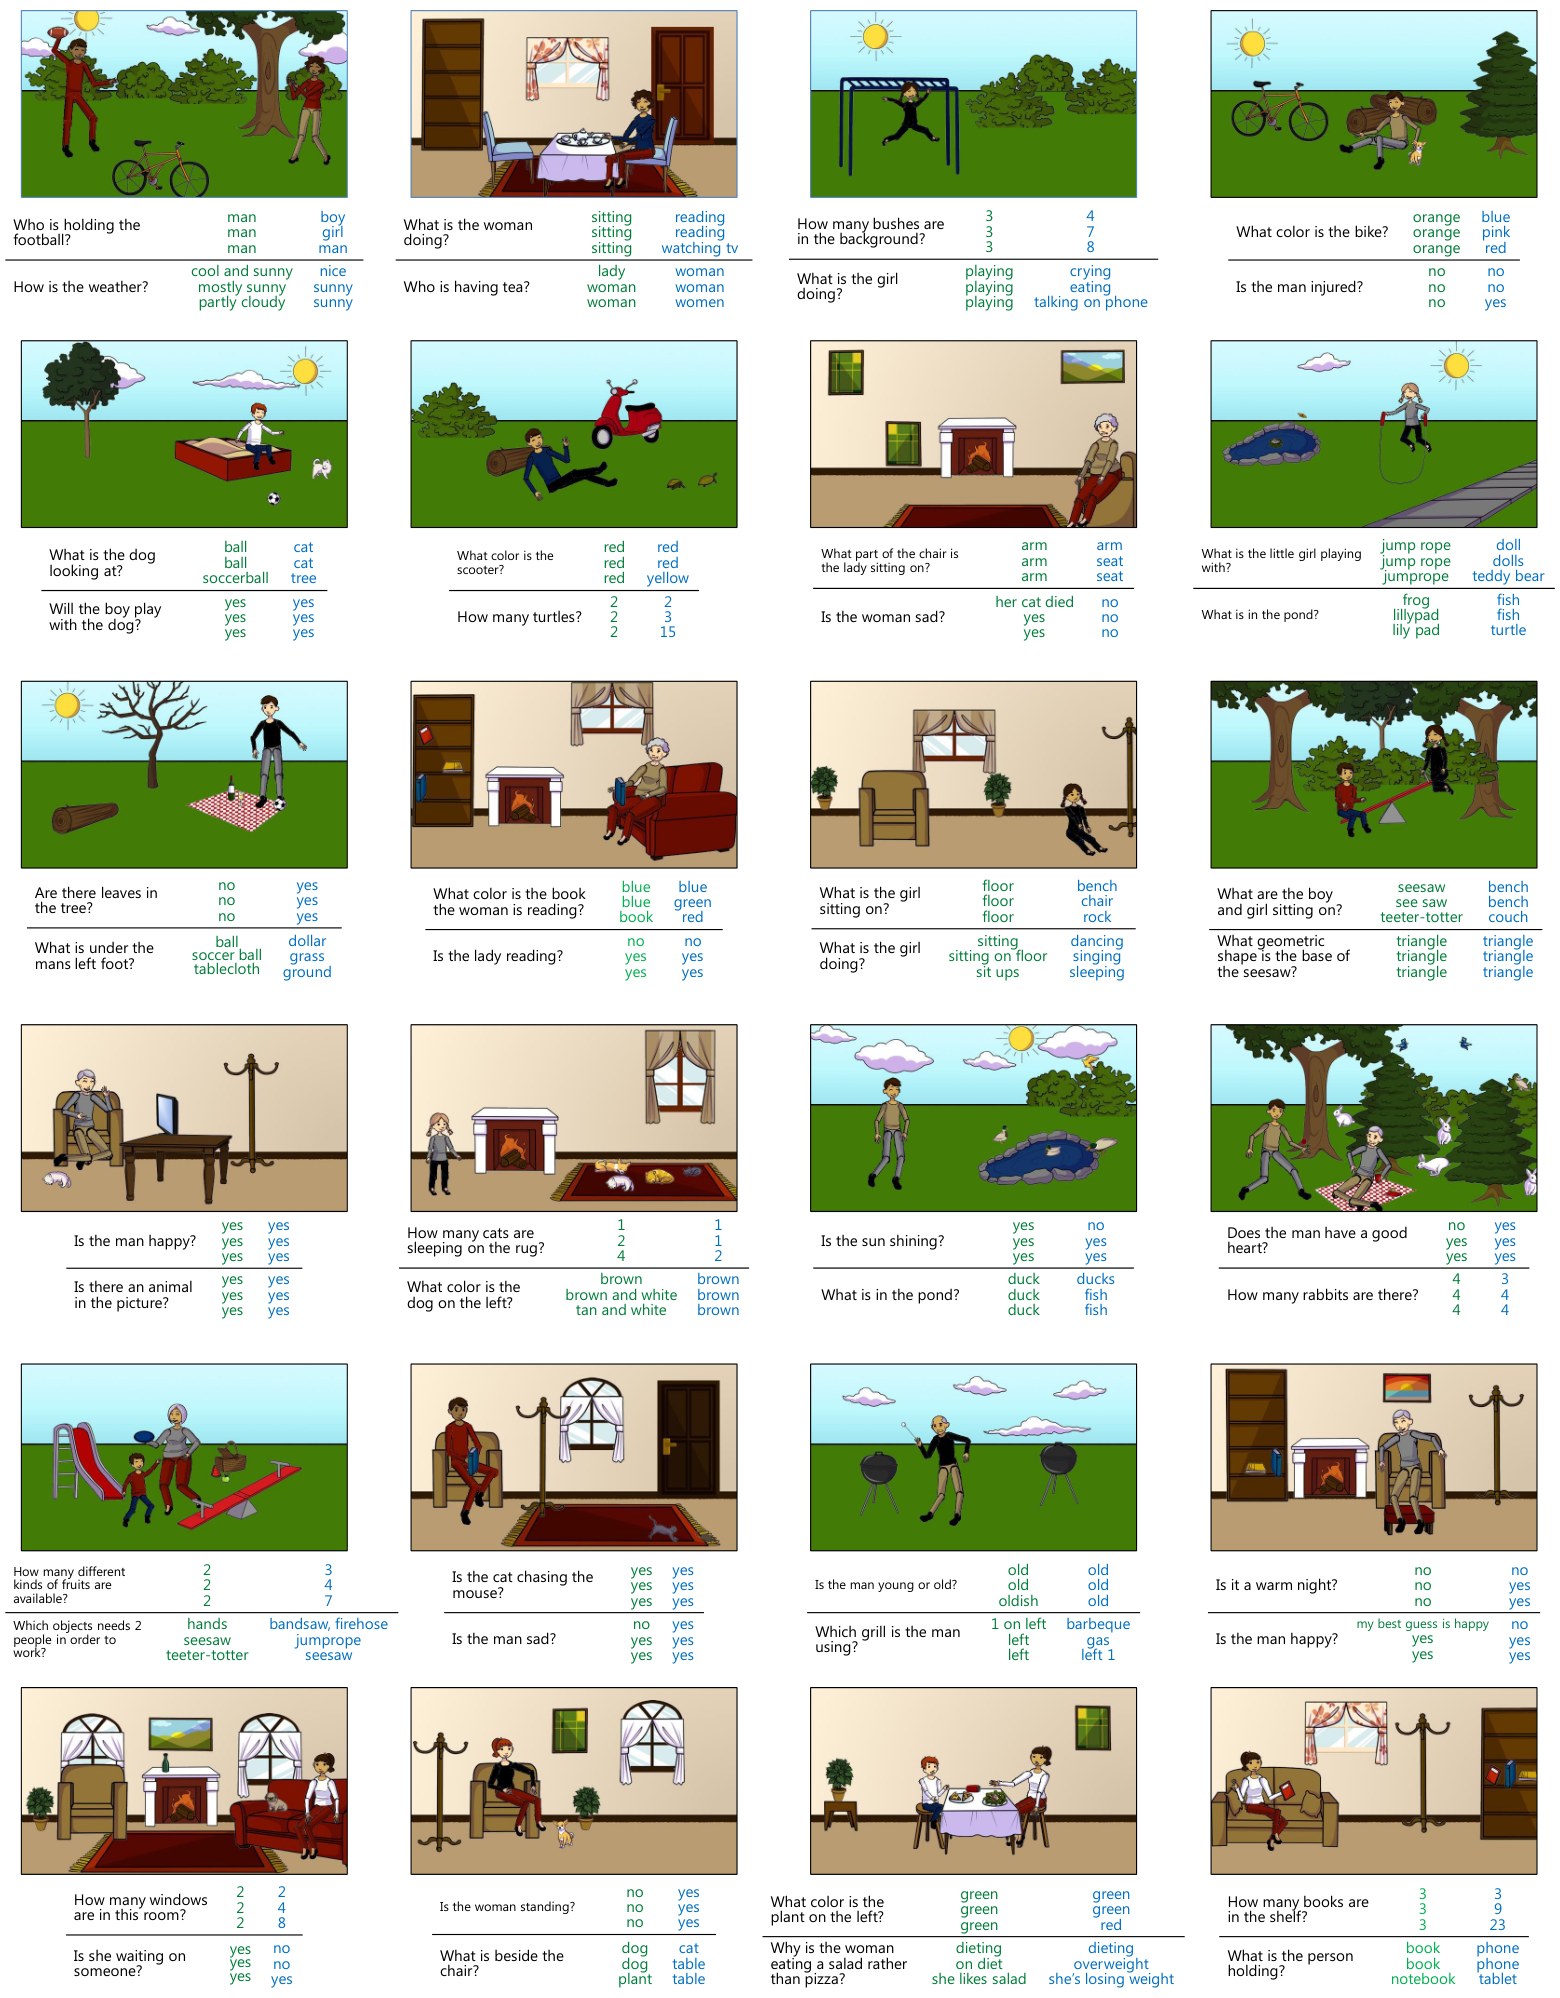
Fig. 28: Random examples of questions (black), (a subset of the) answers given when looking at the image (green), and answers given when not looking at the image (blue) for numerous representative examples of the abstract scene dataset.
图 28:抽象场景数据集中大量代表性示例的随机例子:问题(黑色)、看图时给出的答案(子集,绿色),以及不看图时给出的答案(蓝色)。
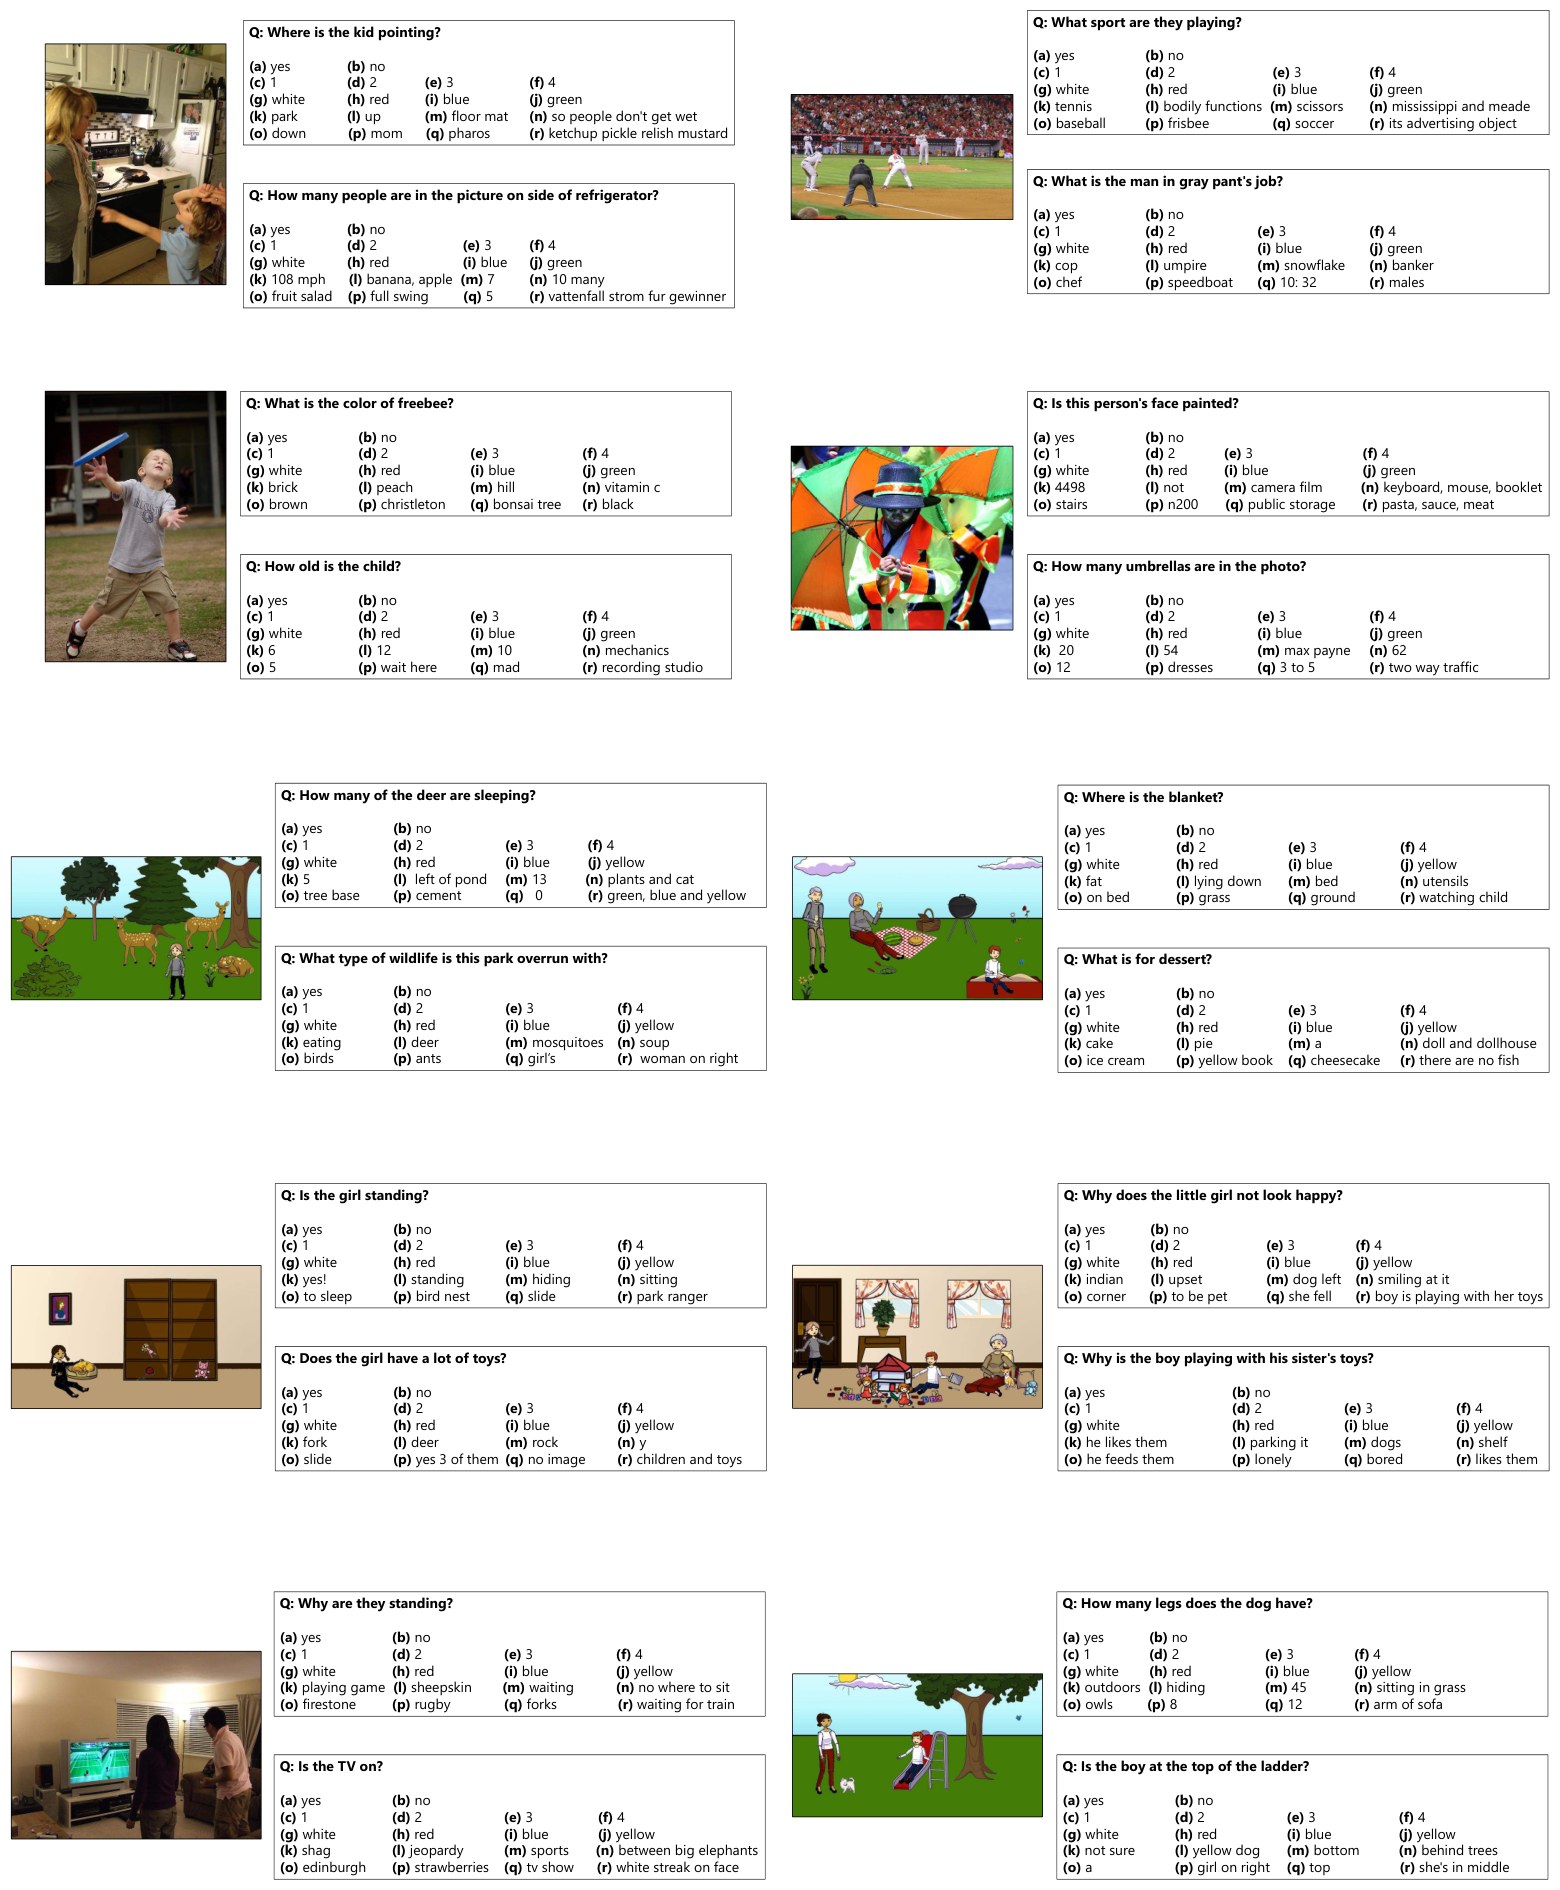
Fig. 29: Random examples of multiple-choice questions for numerous representative examples of the real and abstract scene dataset.
图 29:真实和抽象场景数据集中大量代表性示例的随机选择题例子。
Footnotes
脚注
[^2] In order to be consistent with 'human accuracies' reported in Section IV, machine accuracies are averaged over all sets of human annotators.
[^2] 为了与第 IV 节报告的“人类准确率”保持一致,机器准确率对全部 组人类标注者取平均。
[^6] Noun tags begin with NN, verb tags begin with VB, adjective tags begin with JJ, and prepositions are tagged as IN.
[^6] 名词标记以 NN 开头,动词标记以 VB 开头,形容词标记以 JJ 开头,介词标记为 IN。
[^7] Visualization created using http://worditout.com/.
[^7] 可视化用 http://worditout.com/ 创建。
References
[1] H. Agrawal, C. S. Mathialagan, Y. Goyal, N. Chavali, P. Banik, A. Mohapatra, A. Osman, and D. Batra. Cloudcv: Large-scale distributed computer vision as a cloud service. In Mobile Cloud Visual Media Computing , pages 265–290. Springer International Publishing, 2015.
[2] S. Antol, C. L. Zitnick, and D. Parikh. Zero-Shot Learning via Visual Abstraction. In ECCV , 2014.
[3] J. P. Bigham, C. Jayant, H. Ji, G. Little, A. Miller, R. C. Miller, R. Miller, A. Tatarowicz, B. White, S. White, and T. Yeh. VizWiz: Nearly Real-time Answers to Visual Questions. In User Interface Software and Technology , 2010.
[4] K. Bollacker, C. Evans, P. Paritosh, T. Sturge, and J. Taylor. Freebase: A Collaboratively Created Graph Database for Structuring Human Knowledge. In International Conference on Management of Data , 2008.
[5] A. Carlson, J. Betteridge, B. Kisiel, B. Settles, E. R. H. Jr., and T. M. Mitchell. Toward an Architecture for Never-Ending Language Learning. In AAAI , 2010.
[6] X. Chen, H. Fang, T. Lin, R. Vedantam, S. Gupta, P. Dollár, and C. L. Zitnick. Microsoft COCO captions: Data collection and evaluation server. CoRR , abs/1504.00325, 2015.
[7] X. Chen, H. Fang, T.-Y. Lin, R. Vedantam, S. Gupta, P. Dollár, and C. L. Zitnick. Microsoft COCO Captions: Data Collection and Evaluation Server. arXiv preprint arXiv:1504.00325 , 2015.
[8] X. Chen, A. Shrivastava, and A. Gupta. NEIL: Extracting Visual Knowledge from Web Data. In ICCV , 2013.
[9] X. Chen and C. L. Zitnick. Mind’s Eye: A Recurrent Visual Representation for Image Caption Generation. In CVPR , 2015.
[10] G. Coppersmith and E. Kelly. Dynamic wordclouds and vennclouds for exploratory data analysis. In ACL Workshop on Interactive Language Learning and Visualization , 2014.
[11] J. Deng, A. C. Berg, and L. Fei-Fei. Hierarchical Semantic Indexing for Large Scale Image Retrieval. In CVPR , 2011.
[12] J. Donahue, L. A. Hendricks, S. Guadarrama, M. Rohrbach, S. Venugopalan, K. Saenko, and T. Darrell. Long-term Recurrent Convolutional Networks for Visual Recognition and Description. In CVPR , 2015.
[13] D. Elliott and F. Keller. Comparing Automatic Evaluation Measures for Image Description. In ACL , 2014.
[14] A. Fader, L. Zettlemoyer, and O. Etzioni. Paraphrase-Driven Learning for Open Question Answering. In ACL , 2013.
[15] A. Fader, L. Zettlemoyer, and O. Etzioni. Open Question Answering over Curated and Extracted Knowledge Bases. In International Conference on Knowledge Discovery and Data Mining , 2014.
[16] H. Fang, S. Gupta, F. N. Iandola, R. Srivastava, L. Deng, P. Dollár, J. Gao, X. He, M. Mitchell, J. C. Platt, C. L. Zitnick, and G. Zweig. From Captions to Visual Concepts and Back. In CVPR , 2015.
[17] A. Farhadi, M. Hejrati, A. Sadeghi, P. Young, C. Rashtchian, J. Hockenmaier, and D. Forsyth. Every Picture Tells a Story: Generating Sentences for Images. In ECCV , 2010.
[18] H. Gao, J. Mao, J. Zhou, Z. Huang, and A. Yuille. Are you talking to a machine? dataset and methods for multilingual image question answering. In NIPS , 2015.
[19] D. Geman, S. Geman, N. Hallonquist, and L. Younes. A Visual Turing Test for Computer Vision Systems. In PNAS , 2014.
[20] J. Gordon and B. V. Durme. Reporting bias and knowledge extraction. In Proceedings of the 3rd Workshop on Knowledge Extraction, at CIKM 2013 , 2013.
[21] S. Guadarrama, N. Krishnamoorthy, G. Malkarnenkar, S. Venugopalan, R. Mooney, T. Darrell, and K. Saenko. YouTube2Text: Recognizing and Describing Arbitrary Activities Using Semantic Hierarchies and Zero-Shot Recognition. In ICCV , December 2013.
[22] M. Hodosh, P. Young, and J. Hockenmaier. Framing Image Description as a Ranking Task: Data, Models and Evaluation Metrics. JAIR , 2013.
[23] Y. Jia, E. Shelhamer, J. Donahue, S. Karayev, J. Long, R. Girshick, S. Guadarrama, and T. Darrell. Caffe: Convolutional architecture for fast feature embedding. arXiv preprint arXiv:1408.5093 , 2014.
[24] A. Karpathy and L. Fei-Fei. Deep Visual-Semantic Alignments for Generating Image Descriptions. In CVPR , 2015.
[25] S. Kazemzadeh, V. Ordonez, M. Matten, and T. L. Berg. ReferItGame: Referring to Objects in Photographs of Natural Scenes. In EMNLP , 2014.
[26] R. Kiros, R. Salakhutdinov, and R. S. Zemel. Unifying Visual-Semantic Embeddings with Multimodal Neural Language Models. TACL , 2015.
[27] R. Kiros, Y. Zhu, R. Salakhutdinov, R. S. Zemel, A. Torralba, R. Urtasun, and S. Fidler. Skip-thought vectors. arXiv preprint arXiv:1506.06726 , 2015.
[28] C. Kong, D. Lin, M. Bansal, R. Urtasun, and S. Fidler. What Are You Talking About? Text-to-Image Coreference. In CVPR , 2014.
[29] A. Krizhevsky, I. Sutskever, and G. E. Hinton. ImageNet Classification with Deep Convolutional Neural Networks. In NIPS , 2012.
[30] G. Kulkarni, V. Premraj, S. L. Sagnik Dhar and, Y. Choi, A. C. Berg, and T. L. Berg. Baby Talk: Understanding and Generating Simple Image Descriptions. In CVPR , 2011.
[31] D. B. Lenat and R. V. Guha. Building Large Knowledge-Based Systems; Representation and Inference in the Cyc Project . Addison-Wesley Longman Publishing Co., Inc., 1989.
[32] T.-Y. Lin, M. Maire, S. Belongie, J. Hays, P. Perona, D. Ramanan, P. Dollár, and C. L. Zitnick. Microsoft COCO: Common Objects in Context. In ECCV , 2014.
[33] X. Lin and D. Parikh. Don’t Just Listen, Use Your Imagination: Leveraging Visual Common Sense for Non-Visual Tasks. In CVPR , 2015.
[34] X. Lin and D. Parikh. Don’t just listen, use your imagination: Leveraging visual common sense for non-visual tasks. In CVPR , 2015.
[35] H. Liu and P. Singh. ConceptNet — A Practical Commonsense Reasoning Tool-Kit. BT Technology Journal , 2004.
[36] M. Malinowski and M. Fritz. A Multi-World Approach to Question Answering about Real-World Scenes based on Uncertain Input. In NIPS , 2014.
[37] M. Malinowski, M. Rohrbach, and M. Fritz. Ask your neurons: A neural-based approach to answering questions about images. In ICCV , 2015.
[38] J. Mao, W. Xu, Y. Yang, J. Wang, and A. L. Yuille. Explain Images with Multimodal Recurrent Neural Networks. CoRR , abs/1410.1090, 2014.
[39] T. Mikolov, I. Sutskever, K. Chen, G. S. Corrado, and J. Dean. Distributed Representations of Words and Phrases and their Compositionality. In NIPS , 2013.
[40] M. Mitchell, J. Dodge, A. Goyal, K. Yamaguchi, K. Stratos, X. Han, A. Mensch, A. Berg, T. L. Berg, and H. Daume III. Midge: Generating Image Descriptions From Computer Vision Detections. In ACL , 2012.
[41] M. Mitchell, K. van Deemter, and E. Reiter. Attributes in visual reference. In PRE-CogSci , 2013.
[42] M. Mitchell, K. Van Deemter, and E. Reiter. Generating Expressions that Refer to Visible Objects. In HLT-NAACL , 2013.
[43] V. Ramanathan, A. Joulin, P. Liang, and L. Fei-Fei. Linking People with “Their” Names using Coreference Resolution. In ECCV , 2014.
[44] M. Ren, R. Kiros, and R. Zemel. Exploring models and data for image question answering. In NIPS , 2015.
[45] M. Richardson, C. J. Burges, and E. Renshaw. MCTest: A Challenge Dataset for the Open-Domain Machine Comprehension of Text. In EMNLP , 2013.
[46] M. Rohrbach, W. Qiu, I. Titov, S. Thater, M. Pinkal, and B. Schiele. Translating Video Content to Natural Language Descriptions. In ICCV , 2013.
[47] F. Sadeghi, S. K. Kumar Divvala, and A. Farhadi. Viske: Visual knowledge extraction and question answering by visual verification of relation phrases. In CVPR , 2015.
[48] K. Simonyan and A. Zisserman. Very deep convolutional networks for large-scale image recognition. CoRR , abs/1409.1556, 2014.
[49] K. Toutanova, D. Klein, C. D. Manning, and Y. Singer. Feature-rich part-of-speech tagging with a cyclic dependency network. In ACL , 2003.
[50] K. Tu, M. Meng, M. W. Lee, T. E. Choe, and S. C. Zhu. Joint Video and Text Parsing for Understanding Events and Answering Queries. IEEE MultiMedia , 2014.
[51] R. Vedantam, C. L. Zitnick, and D. Parikh. CIDEr: Consensus-based Image Description Evaluation. In CVPR , 2015.
[52] R. Vendantam, X. Lin, T. Batra, C. L. Zitnick, and D. Parikh. Learning common sense through visual abstraction. In ICCV , 2015.
[53] O. Vinyals, A. Toshev, S. Bengio, and D. Erhan. Show and Tell: A Neural Image Caption Generator. In CVPR , 2015.
[54] J. Weston, A. Bordes, S. Chopra, and T. Mikolov. Towards AI-Complete Question Answering: A Set of Prerequisite Toy Tasks. CoRR , abs/1502.05698, 2015.
[55] L. Yu, E. Park, A. C. Berg, and T. L. Berg. Visual madlibs: Fill-in-the-blank description generation and question answering. In ICCV , 2015.
[56] P. Zhang, Y. Goyal, D. Summers-Stay, D. Batra, and D. Parikh. Yin and yang: Balancing and answering binary visual questions. CoRR , abs/1511.05099, 2015.
[57] C. L. Zitnick and D. Parikh. Bringing Semantics Into Focus Using Visual Abstraction. In CVPR , 2013.
[58] C. L. Zitnick, D. Parikh, and L. Vanderwende. Learning the Visual Interpretation of Sentences. In ICCV , 2013.
[59] C. L. Zitnick, R. Vedantam, and D. Parikh. Adopting Abstract Images for Semantic Scene Understanding. PAMI , 2015.