Visualizing and Understanding Convolutional Networks
Visualizing and Understanding Convolutional Networks
Abstract
Large Convolutional Network models have recently demonstrated impressive classification performance on the ImageNet benchmark Krizhevsky et al. [18]. However there is no clear understanding of why they perform so well, or how they might be improved. In this paper we explore both issues. We introduce a novel visualization technique that gives insight into the function of intermediate feature layers and the operation of the classifier. Used in a diagnostic role, these visualizations allow us to find model architectures that outperform Krizhevsky et al. on the ImageNet classification benchmark. We also perform an ablation study to discover the performance contribution from different model layers. We show our ImageNet model generalizes well to other datasets: when the softmax classifier is retrained, it convincingly beats the current state-of-the-art results on Caltech-101 and Caltech-256 datasets.
大型卷积网络模型最近在 ImageNet 基准上取得了出色的分类成绩(Krizhevsky 等人 [18])。然而,人们仍不清楚它们为何表现如此好,也不清楚还可以怎样改进。本文同时讨论这两个问题。我们提出一种新的可视化方法,用来观察中间特征层的作用以及分类器的工作方式。把这些可视化当作诊断工具,我们找到了在 ImageNet 分类基准上超过 Krizhevsky 等人的模型结构。我们还做了消融实验,衡量不同层对性能的贡献。结果表明,我们的 ImageNet 模型可以很好地推广到其他数据集:只需重训 softmax 分类器,就能在 Caltech-101 和 Caltech-256 上明显超过当时最好的结果。
D. Fleet et al. (Eds.): ECCV 2014, Part I, LNCS 8689, pp. 818–833, 2014.
© Springer International Publishing Switzerland 2014
1 Introduction
Since their introduction by LeCun et al. [20] in the early 1990’s, Convolutional Networks (convnets) have demonstrated excellent performance at tasks such as hand-written digit classification and face detection. In the last 18 months, several papers have shown that they can also deliver outstanding performance on more challenging visual classification tasks. Ciresan et al. [4] demonstrate state-of-the-art performance on NORB and CIFAR-10 datasets. Most notably, Krizhevsky et al. [18] show record beating performance on the ImageNet 2012 classification benchmark, with their convnet model achieving an error rate of 16.4%, compared to the 2nd place result of 26.1%. Following on from this work, Girshick et al. [10] have shown leading detection performance on the PASCAL VOC dataset. Several factors are responsible for this dramatic improvement in performance: (i) the availability of much larger training sets, with millions of labeled examples; (ii) powerful GPU implementations, making the training of very large models practical and (iii) better model regularization strategies, such as Dropout [14].
自 1990 年代初由 LeCun 等人 [20] 提出以来,卷积网络(convnet)在手写数字分类和人脸检测等任务上一直表现很好。过去 18 个月里,又有多篇论文表明,它们在更难的视觉分类任务上也能取得出色成绩。Ciresan 等人 [4] 在 NORB 和 CIFAR-10 上达到了当时最好水平。更引人注目的是,Krizhevsky 等人 [18] 在 ImageNet 2012 分类基准上刷新了纪录,其卷积网络的误差率为 16.4%,而第二名是 26.1%。在此之后,Girshick 等人 [10] 又在 PASCAL VOC 上取得了领先的检测结果。性能之所以出现这一跃升,主要有几个因素:(i)出现了带有数百万标注样本的更大规模训练集;(ii)强大的 GPU 实现使训练很大的模型成为可能;(iii)有了更好的正则化策略,例如 Dropout [14]。
Despite this encouraging progress, there is still little insight into the internal operation and behavior of these complex models, or how they achieve such good performance. From a scientific standpoint, this is deeply unsatisfactory. Without clear understanding of how and why they work, the development of better models is reduced to trial-and-error. In this paper we introduce a visualization technique that reveals the input stimuli that excite individual feature maps at any layer in the model. It also allows us to observe the evolution of features during training and to diagnose potential problems with the model. The visualization technique we propose uses a multi-layered Deconvolutional Network (deconvnet), as proposed by Zeiler et al. [29], to project the feature activations back to the input pixel space. We also perform a sensitivity analysis of the classifier output by occluding portions of the input image, revealing which parts of the scene are important for classification.
尽管进展令人鼓舞,但人们对这些复杂模型的内部运作和行为、以及它们为何能取得如此好的成绩,仍然缺少清楚的认识。从科学角度看,这是很不能令人满意的。如果弄不清它们如何工作、为何有效,改进模型就只能靠试错。本文提出一种可视化方法,用来揭示在模型任意一层中激发各个特征图的输入刺激。它也可以用来观察特征在训练过程中的演化,并诊断模型可能存在的问题。我们采用 Zeiler 等人 [29] 提出的多层反卷积网络(deconvnet),把特征激活投回输入像素空间。我们还通过对输入图像的部分区域做遮挡,对分类器输出做敏感性分析,从而看出场景中哪些部分对分类更为重要。
Using these tools, we start with the architecture of Krizhevsky et al. [18] and explore different architectures, discovering ones that outperform their results on ImageNet. We then explore the generalization ability of the model to other datasets, just retraining the softmax classifier on top. As such, this is a form of supervised pre-training, which contrasts with the unsupervised pre-training methods popularized by Hinton et al. [13] and others [1,26].
借助这些工具,我们从 Krizhevsky 等人 [18] 的结构出发,尝试不同的架构,并找到了在 ImageNet 上超过他们结果的模型。随后我们考察该模型向其他数据集的推广能力,方法是只重训最上面的 softmax 分类器。这是一种有监督预训练,与 Hinton 等人 [13] 以及其他工作 [1,26] 所推广的无监督预训练形成对照。
1.1 Related Work
Visualization: Visualizing features to gain intuition about the network is common practice, but mostly limited to the 1st layer where projections to pixel space are possible. In higher layers alternate methods must be used. [8] find the optimal stimulus for each unit by performing gradient descent in image space to maximize the unit’s activation. This requires a careful initialization and does not give any information about the unit’s invariances. Motivated by the latter’s short-coming, [19] (extending an idea by [2]) show how the Hessian of a given unit may be computed numerically around the optimal response, giving some insight into invariances. The problem is that for higher layers, the invariances are extremely complex so are poorly captured by a simple quadratic approximation. Our approach, by contrast, provides a non-parametric view of invariance, showing which patterns from the training set activate the feature map. Our approach is similar to contemporary work by Simonyan et al. [23] who demonstrate how saliency maps can be obtained from a convnet by projecting back from the fully connected layers of the network, instead of the convolutional features that we use. Girshick et al. [10] show visualizations that identify patches within a dataset that are responsible for strong activations at higher layers in the model. Our visualizations differ in that they are not just crops of input images, but rather top-down projections that reveal structures within each patch that stimulate a particular feature map.
可视化:通过可视化特征来理解网络,是常见做法,但多半只限于第一层,因为只有那里才能直接投到像素空间。更高层必须改用别的方法。[8] 在图像空间做梯度下降,使某个单元的激活最大化,从而找出该单元的最优刺激。这种方法需要仔细初始化,而且不能说明该单元具有怎样的不变性。针对这一不足,[19](扩展了 [2] 的想法)说明如何在最优响应附近数值计算该单元的 Hessian,从而对不变性得到一些认识。问题在于,到了更高层,不变性会变得极为复杂,简单的二次近似很难刻画。相比之下,我们的方法提供了一种非参数的不变性视角,直接展示训练集中哪些模式会激活该特征图。我们的做法与 Simonyan 等人 [23] 同时期的工作相近,他们从网络的全连接层往回投影,得到卷积网络的显著性图;我们投影的则是卷积特征。Girshick 等人 [10] 的可视化指出了数据集中哪些图像块造成了高层的强激活。我们的可视化与之不同:它们不只是输入图像的裁块,而是自上而下的投影,能够揭示每个图像块内部究竟是哪些结构在激发特定特征图。
Feature Generalization: Our demonstration of the generalization ability of convnet features is also explored in concurrent work by Donahue et al. [7] and Girshick et al. [10]. They use the convnet features to obtain state-of-the-art performance on Caltech-101 and the Sun scenes dataset in the former case, and for object detection on the PASCAL VOC dataset, in the latter.
特征推广:卷积网络特征的推广能力,也在 Donahue 等人 [7] 和 Girshick 等人 [10] 的同期工作中得到了考察。前者用这些特征在 Caltech-101 和 Sun 场景数据集上取得了当时最好成绩,后者则将其用于 PASCAL VOC 上的物体检测。
2 Approach
We use standard fully supervised convnet models throughout the paper, as defined by LeCun et al. [20] and Krizhevsky et al. [18]. These models map a color 2D input image , via a series of layers, to a probability vector over the different classes. Each layer consists of (i) convolution of the previous layer output (or, in the case of the 1st layer, the input image) with a set of learned filters; (ii) passing the responses through a rectified linear function (); (iii) [optionally] max pooling over local neighborhoods and (iv) [optionally] a local contrast operation that normalizes the responses across feature maps. For more details of these operations, see [18] and [16]. The top few layers of the network are conventional fully-connected networks and the final layer is a softmax classifier. Fig. 3 shows the model used in many of our experiments.
本文通篇使用标准的全监督卷积网络,定义沿用 LeCun 等人 [20] 和 Krizhevsky 等人 [18]。这类模型把一幅彩色二维输入图像 经若干层映射为在 个类别上的概率向量 。每一层包括:(i)用一组学习到的滤波器对上一层输出做卷积(第一层则对输入图像做卷积);(ii)把响应送入整流线性函数();(iii)[可选]在局部邻域上做最大池化;(iv)[可选]做局部对比度操作,在特征图之间归一化响应。这些操作的更多细节见 [18] 和 [16]。网络最上面几层是常规的全连接网络,最后一层是 softmax 分类器。图 3 给出了我们多数实验所用的模型。
We train these models using a large set of labeled images , where label is a discrete variable indicating the true class. A cross-entropy loss function, suitable for image classification, is used to compare and . The parameters of the network (filters in the convolutional layers, weight matrices in the fully-connected layers and biases) are trained by back-propagating the derivative of the loss with respect to the parameters throughout the network, and updating the parameters via stochastic gradient descent. Details of training are given in Section 3.
我们用规模为 的带标注图像集 训练这些模型,其中标签 是表示真实类别的离散变量。比较 与 时,使用适合图像分类的交叉熵损失。网络参数(卷积层中的滤波器、全连接层中的权重矩阵以及偏置)通过对损失关于参数的导数做反向传播,再用随机梯度下降更新。训练细节见第 3 节。
2.1 Visualization with a Deconvnet
Understanding the operation of a convnet requires interpreting the feature activity in intermediate layers. We present a novel way to map these activities back to the input pixel space, showing what input pattern originally caused a given activation in the feature maps. We perform this mapping with a Deconvolutional Network (deconvnet) Zeiler et al. [29]. A deconvnet can be thought of as a convnet model that uses the same components (filtering, pooling) but in reverse, so instead of mapping pixels to features does the opposite. In Zeiler et al. [29], deconvnets were proposed as a way of performing unsupervised learning. Here, they are not used in any learning capacity, just as a probe of an already trained convnet.
要理解卷积网络如何工作,就需要解释中间层里的特征活动。我们提出一种新方法,把这些活动映射回输入像素空间,从而看出当初是什么样的输入模式在特征图中造成了给定的激活。这一映射由反卷积网络(deconvnet,Zeiler 等人 [29])完成。可以把反卷积网络看成使用相同组件(滤波、池化)但方向相反的卷积网络:它不是从像素映射到特征,而是反过来。在 Zeiler 等人 [29] 中,反卷积网络是作为一种无监督学习方法提出的。在这里,它们不承担任何学习功能,只被用来探测已经训练好的卷积网络。
To examine a convnet, a deconvnet is attached to each of its layers, as illustrated in Fig. 1(top), providing a continuous path back to image pixels. To start, an input image is presented to the convnet and features computed throughout the layers. To examine a given convnet activation, we set all other activations in the layer to zero and pass the feature maps as input to the attached deconvnet layer. Then we successively (i) unpool, (ii) rectify and (iii) filter to reconstruct the activity in the layer beneath that gave rise to the chosen activation. This is then repeated until input pixel space is reached.
为了考察卷积网络,我们给它的每一层接上一个反卷积网络,如图 1(上)所示,从而得到一条回到图像像素的连续路径。首先把输入图像送入卷积网络,算出各层特征。要考察其中某个激活时,将该层其余激活全部置零,再把特征图作为输入送给接上的反卷积层。随后依次进行(i)反池化、(ii)整流和(iii)滤波,重建下一层中产生该激活的活动。这一过程重复进行,直到回到输入像素空间。
Unpooling: In the convnet, the max pooling operation is non-invertible, however we can obtain an approximate inverse by recording the locations of the maxima within each pooling region in a set of switch variables. In the deconvnet, the unpooling operation uses these switches to place the reconstructions from the layer above into appropriate locations, preserving the structure of the stimulus. See Fig. 1(bottom) for an illustration of the procedure.
反池化:在卷积网络中,最大池化不可逆,但我们可以把每个池化区域内最大值的位置记录为一组开关变量,从而得到一个近似逆。在反卷积网络中,反池化利用这些开关,把上一层的重建放到相应位置,从而保留刺激的结构。见图 1(下)对这一过程的示意。
Rectification: The convnet uses relu non-linearities, which rectify the feature maps thus ensuring the feature maps are always positive. To obtain valid feature reconstructions at each layer (which also should be positive), we pass the reconstructed signal through a relu non-linearity[^1].
整流:卷积网络使用 relu 非线性,对特征图做整流,从而保证特征图始终为正。为了在每一层得到同样应为正的有效特征重建,我们把重建信号再送过一层 relu 非线性[^1]。
[^1]: We also tried rectifying using the binary mask imposed by the feed-forward relu operation, but the resulting visualizations were significantly less clear.
[^1]: 我们也尝试过用前向 relu 操作所施加的二值掩码来整流,但得到的可视化明显不够清晰。
Filtering: The convnet uses learned filters to convolve the feature maps from the previous layer. To approximately invert this, the deconvnet uses transposed versions of the same filters (as other autoencoder models, such as RBMs), but applied to the rectified maps, not the output of the layer beneath. In practice this means flipping each filter vertically and horizontally.
滤波:卷积网络用学习到的滤波器对上一层的特征图做卷积。为了近似求逆,反卷积网络使用这些滤波器的转置(与 RBM 等其他自编码器模型类似),但作用在整流后的特征图上,而不是下一层的输出上。实践中,这相当于把每个滤波器沿垂直和水平方向翻转。
Note that we do not use any contrast normalization operations when in this reconstruction path. Projecting down from higher layers uses the switch settings generated by the max pooling in the convnet on the way up. As these switch settings are peculiar to a given input image, the reconstruction obtained from a single activation thus resembles a small piece of the original input image, with structures weighted according to their contribution toward to the feature activation. Since the model is trained discriminatively, they implicitly show which parts of the input image are discriminative. Note that these projections are not samples from the model, since there is no generative process involved. The whole procedure is similar to backpropping a single strong activation (rather than the usual gradients), i.e. computing , where is the element of the feature map with the strong activation and is the input image. However, it differs in that (i) the the relu is imposed independently and (ii) contrast normalization operations are not used. A general shortcoming of our approach is that it only visualizes a single activation, not the joint activity present in a layer. Nevertheless, as we show in Fig. 6, these visualizations are accurate representations of the input pattern that stimulates the given feature map in the model: when the parts of the original input image corresponding to the pattern are occluded, we see a distinct drop in activity within the feature map.
需要说明的是,在这条重建路径上我们不使用任何对比度归一化操作。从更高层往下投影时,使用的是卷积网络在上行过程中由最大池化产生的开关设置。这些开关设置取决于特定输入图像,因此由单个激活得到的重建会类似于原图中的一小块,其中的结构按它们对该特征激活的贡献加权。由于模型是判别式训练的,这些重建也就隐式表明了输入图像中哪些部分具有判别性。还要注意,这些投影并不是模型的抽样,因为其中并不包含生成过程。整个步骤类似于对单个强激活(而不是通常的梯度)做反向传播,也即计算 ,其中 是特征图中该强激活所在的元素, 是输入图像。不过二者并不相同:(i)relu 是独立施加的;(ii)不使用对比度归一化。我们方法的一个一般性不足是,它只可视化单个激活,而不是一层中的联合活动。尽管如此,如图 6 所示,这些可视化能够准确代表模型中激发该特征图的输入模式:当原图中与该模式对应的部分被遮挡时,该特征图内的活动会出现明显下降。
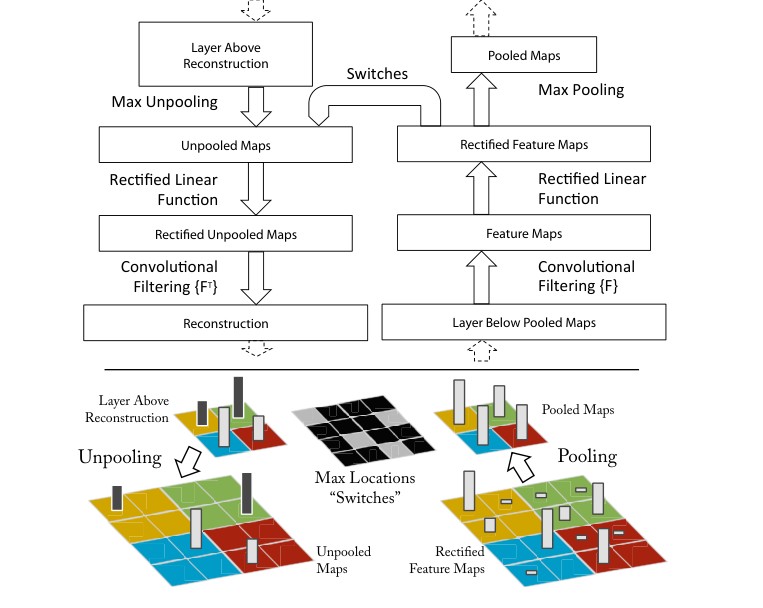
Fig. 1. Top: A deconvnet layer (left) attached to a convnet layer (right). The deconvnet will reconstruct an approximate version of the convnet features from the layer beneath. Bottom: An illustration of the unpooling operation in the deconvnet, using switches which record the location of the local max in each pooling region (colored zones) during pooling in the convnet. The black/white bars are negative/positive activations within the feature map.
图 1. 上:一个反卷积层(左)接到一个卷积层(右)。反卷积网络将重建来自下一层的卷积特征的近似版本。下:反卷积网络中反池化操作的示意,所用开关记录了卷积网络池化时每个池化区域(彩色区块)内局部最大值的位置。黑/白条分别表示特征图中的负/正激活。
3 Training Details
We now describe the large convnet model that will be visualized in Section 4. The architecture, shown in Fig. 3, is similar to that used by Krizhevsky et al. [18] for ImageNet classification. One difference is that the sparse connections used in Krizhevsky’s layers 3,4,5 (due to the model being split across 2 GPUs) are replaced with dense connections in our model. Other important differences relating to layers 1 and 2 were made following inspection of the visualizations in Fig. 5, as described in Section 4.1.
下面说明将在第 4 节中可视化的大型卷积网络。其结构如图 3 所示,与 Krizhevsky 等人 [18] 用于 ImageNet 分类的模型相近。一个差别是:Krizhevsky 模型第 3、4、5 层中因模型被分到两块 GPU 上而采用的稀疏连接,在我们的模型里改成了稠密连接。与第 1、2 层有关的其他重要改动,则是在查看图 5 的可视化之后做出的,见第 4.1 节。
The model was trained on the ImageNet 2012 training set (1.3 million images, spread over 1000 different classes) [6]. Each RGB image was preprocessed by resizing the smallest dimension to 256, cropping the center 256x256 region, subtracting the per-pixel mean (across all images) and then using 10 different sub-crops of size 224x224 (corners + center with(out) horizontal flips). Stochastic gradient descent with a mini-batch size of 128 was used to update the parameters, starting with a learning rate of , in conjunction with a momentum term of 0.9. We anneal the learning rate throughout training manually when the validation error plateaus. Dropout [14] is used in the fully connected layers (6 and 7) with a rate of 0.5. All weights are initialized to and biases are set to 0.
模型在 ImageNet 2012 训练集上训练(130 万张图像,覆盖 1000 个类别)[6]。每张 RGB 图像的预处理是:把较短边缩放到 256,裁取中心 256×256 区域,减去逐像素均值(在全部图像上计算),再使用 10 种不同的 224×224 子裁块(四个角和中心,并做或不做水平翻转)。参数用批量大小为 128 的随机梯度下降更新,学习率起点为 ,动量为 0.9。训练过程中,当验证误差进入平台期时,我们手工降低学习率。Dropout [14] 用在全连接层(第 6、7 层),比率为 0.5。所有权重初始化为 ,偏置设为 0。
Visualization of the first layer filters during training reveals that a few of them dominate. To combat this, we renormalize each filter in the convolutional layers whose RMS value exceeds a fixed radius of to this fixed radius. This is crucial, especially in the first layer of the model, where the input images are roughly in the [-128,128] range. As in Krizhevsky et al. [18], we produce multiple different crops and flips of each training example to boost training set size. We stopped training after 70 epochs, which took around 12 days on a single GTX580 GPU, using an implementation based on [18].
训练过程中观察第一层滤波器会发现,其中少数几个占了主导。为了抑制这一点,我们对卷积层中 RMS 值超过固定半径 的滤波器做重新归一化,使其回到该半径。这一点很关键,尤其是在模型第一层,输入图像大致落在 [-128, 128] 范围内。与 Krizhevsky 等人 [18] 一样,我们对每个训练样本生成多种裁块和翻转,以增大训练集。训练在 70 个 epoch 后停止,在单块 GTX580 GPU 上大约花了 12 天,实现基于 [18]。
4 Convnet Visualization
Using the model described in Section 3, we now use the deconvnet to visualize the feature activations on the ImageNet validation set.
下面用第 3 节所述模型,借助反卷积网络,在 ImageNet 验证集上可视化特征激活。
Feature Visualization: Fig. 2 shows feature visualizations from our model once training is complete. For a given feature map, we show the top 9 activations, each projected separately down to pixel space, revealing the different structures that excite that map and showing its invariance to input deformations. Alongside these visualizations we show the corresponding image patches. These have greater variation than visualizations which solely focus on the discriminant structure within each patch. For example, in layer 5, row 1, col 2, the patches appear to have little in common, but the visualizations reveal that this particular feature map focuses on the grass in the background, not the foreground objects.
特征可视化:图 2 给出训练完成后模型的特征可视化。对给定特征图,我们展示最强的 9 个激活,并分别投回像素空间,从而看出激发该特征图的不同结构,以及它对输入形变的不变性。在这些可视化旁边,我们附上对应的图像块。与只突出每个块中判别结构的可视化相比,这些图像块的变化更大。例如,在第 5 层第 1 行第 2 列,各图像块看起来几乎没有共同点,但可视化表明,这个特征图关注的是背景中的草地,而不是前景物体。
The projections from each layer show the hierarchical nature of the features in the network. Layer 2 responds to corners and other edge/color conjunctions. Layer 3 has more complex invariances, capturing similar textures (e.g. mesh patterns (Row 1, Col 1); text (R2,C4)). Layer 4 shows significant variation, and is more class-specific: dog faces (R1,C1); bird’s legs (R4,C2). Layer 5 shows entire objects with significant pose variation, e.g. keyboards (R1,C11) and dogs (R4).
各层的投影显示出网络中特征的层次结构。第 2 层对边角以及其他边/颜色组合有响应。第 3 层具有更复杂的不变性,能够捕捉相近的纹理(例如网格图案(第 1 行第 1 列);文字(R2,C4))。第 4 层变化更大,也更偏向特定类别:狗脸(R1,C1);鸟腿(R4,C2)。第 5 层则显示出带有明显姿态变化的完整物体,例如键盘(R1,C11)和狗(R4)。
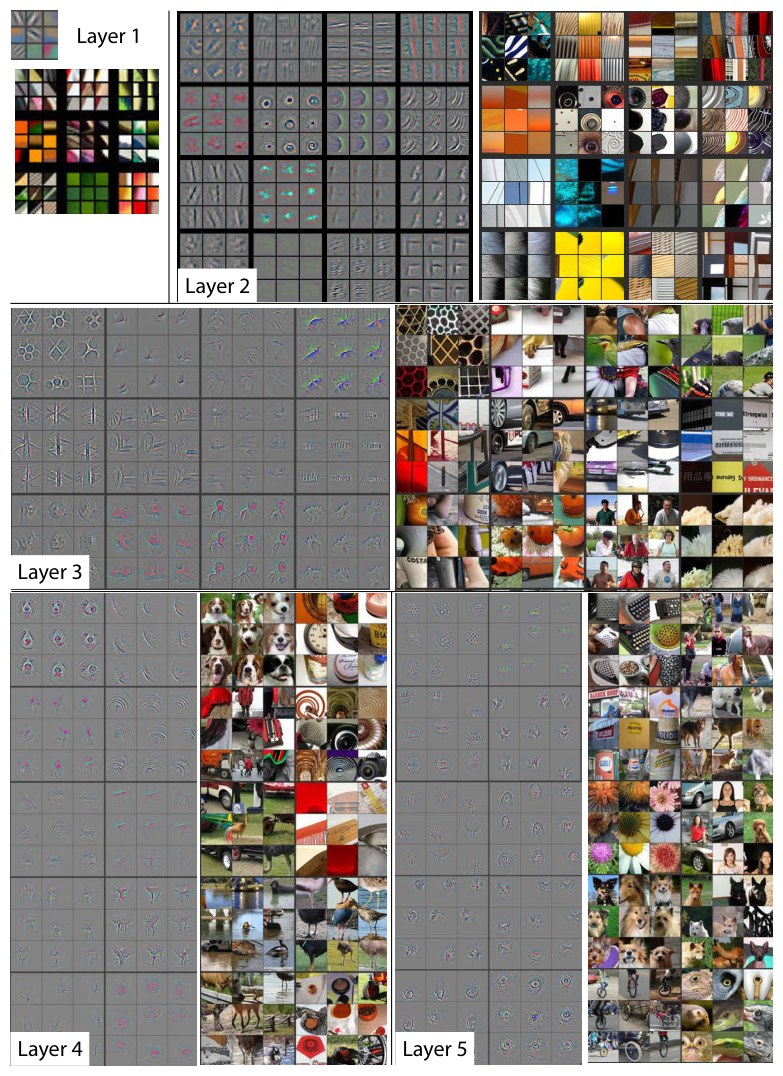
Fig. 2. Visualization of features in a fully trained model. For layers 2-5 we show the top 9 activations in a random subset of feature maps across the validation data, projected down to pixel space using our deconvolutional network approach. Our reconstructions are not samples from the model: they are reconstructed patterns from the validation set that cause high activations in a given feature map. For each feature map we also show the corresponding image patches. Note: (i) the the strong grouping within each feature map, (ii) greater invariance at higher layers and (iii) exaggeration of discriminative parts of the image, e.g. eyes and noses of dogs (layer 4, row 1, cols 1). Best viewed in electronic form. The compression artifacts are a consequence of the 30Mb submission limit, not the reconstruction algorithm itself.
图 2. 完全训练好的模型中的特征可视化。对第 2–5 层,我们在验证数据上随机选取一部分特征图,展示其中最强的 9 个激活,并用反卷积网络方法将其投回像素空间。这些重建并不是模型的抽样:它们是验证集中能使给定特征图产生高激活的重建模式。对每个特征图,我们还给出对应的图像块。请注意:(i)每个特征图内部有很强的分组;(ii)越高层不变性越强;(iii)图像中具有判别性的部分会被夸大,例如狗的眼睛和鼻子(第 4 层,第 1 行,第 1 列)。最好以电子版查看。压缩伪影来自 30MB 的投稿大小限制,而不是重建算法本身。
Feature Evolution during Training: Fig. 4 visualizes the progression during training of the strongest activation (across all training examples) within a given feature map projected back to pixel space. Sudden jumps in appearance result from a change in the image from which the strongest activation originates. The lower layers of the model can be seen to converge within a few epochs. However, the upper layers only develop develop after a considerable number of epochs (40-50), demonstrating the need to let the models train until fully converged.
训练过程中的特征演化:图 4 可视化了给定特征图在全部训练样本中最强激活投回像素空间后、随训练进行的变化。外观上的突然跳跃,来自最强激活所源自的图像发生了更换。可以看到,模型的较低层在几个 epoch 内就会收敛。然而,较高层要到相当多的 epoch(40–50)之后才逐渐成形,这说明必须让模型训练到充分收敛。
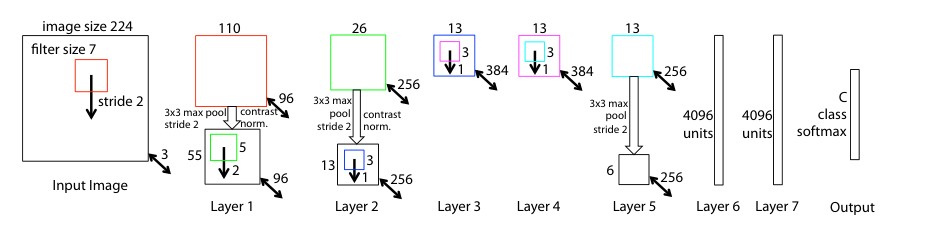
Fig. 3. Architecture of our 8 layer convnet model. A 224 by 224 crop of an image (with 3 color planes) is presented as the input. This is convolved with 96 different 1st layer filters (red), each of size 7 by 7, using a stride of 2 in both x and y. The resulting feature maps are then: (i) passed through a rectified linear function (not shown), (ii) pooled (max within 3x3 regions, using stride 2) and (iii) contrast normalized across feature maps to give 96 different 55 by 55 element feature maps. Similar operations are repeated in layers 2,3,4,5. The last two layers are fully connected, taking features from the top convolutional layer as input in vector form ( dimensions). The final layer is a -way softmax function, being the number of classes. All filters and feature maps are square in shape.
图 3. 我们的 8 层卷积网络结构。输入是图像的 224×224 裁块(带 3 个颜色平面)。它与 96 个不同的第一层滤波器(红色)做卷积,每个滤波器大小为 7×7,在 x 和 y 方向上的步长均为 2。得到的特征图随后:(i)经过整流线性函数(图中未画出);(ii)做池化(在 3×3 区域内取最大,步长为 2);(iii)在特征图之间做对比度归一化,得到 96 个 55×55 的特征图。类似操作在第 2、3、4、5 层重复。最后两层是全连接层,以向量形式接收顶部卷积层的特征( 维)。最后一层是 路 softmax, 为类别数。所有滤波器和特征图都是正方形。
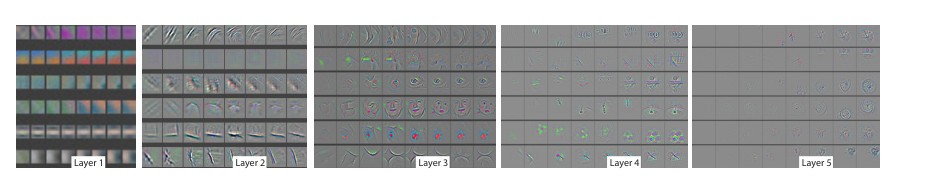
Fig. 4. Evolution of a randomly chosen subset of model features through training. Each layer’s features are displayed in a different block. Within each block, we show a randomly chosen subset of features at epochs [1,2,5,10,20,30,40,64]. The visualization shows the strongest activation (across all training examples) for a given feature map, projected down to pixel space using our deconvnet approach. Color contrast is artificially enhanced and the figure is best viewed in electronic form.
图 4. 随机选取的一部分模型特征在训练过程中的演化。每一层的特征显示在不同的区块中。在每个区块内,我们给出 epoch [1,2,5,10,20,30,40,64] 时随机选取的一部分特征。可视化显示的是给定特征图在全部训练样本中的最强激活,并用我们的反卷积方法投回像素空间。颜色对比经过人工增强,本图最好以电子版查看。
4.1 Architecture Selection
While visualization of a trained model gives insight into its operation, it can also assist with selecting good architectures in the first place. By visualizing the first and second layers of Krizhevsky et al. ’s architecture (Fig. 5(a) & (c)), various problems are apparent. The first layer filters are a mix of extremely high and low frequency information, with little coverage of the mid frequencies. Additionally, the 2nd layer visualization shows aliasing artifacts caused by the large stride 4 used in the 1st layer convolutions. To remedy these problems, we (i) reduced the 1st layer filter size from 11x11 to 7x7 and (ii) made the stride of the convolution 2, rather than 4. This new architecture retains much more information in the 1st and 2nd layer features, as shown in Fig. 5(b) & (d). More importantly, it also improves the classification performance as shown in Section 5.1.
可视化训练好的模型不仅可以帮助理解其工作方式,也可以反过来帮助选择更好的结构。观察 Krizhevsky 等人结构的第一层和第二层(图 5(a) 和 (c)),可以看到若干问题。第一层滤波器是极高频和极低频信息的混合,对中频的覆盖很少。此外,第二层的可视化还显示出混叠伪影,这是由第一层卷积使用较大的步长 4 造成的。为了解决这些问题,我们(i)把第一层滤波器大小从 11×11 减到 7×7,(ii)把卷积步长从 4 改为 2。如图 5(b) 和 (d) 所示,新结构在第一、二层特征中保留了更多信息。更重要的是,它也提高了分类性能,见第 5.1 节。
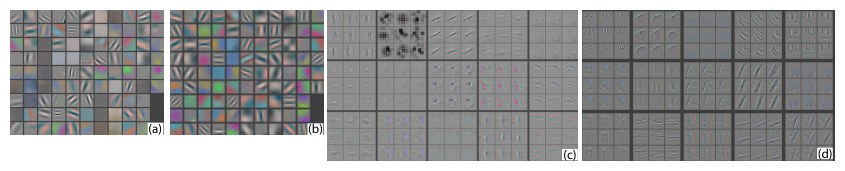
Fig. 5. (a): 1st layer features without feature scale clipping. Note that one feature dominates. (b): 1st layer features from Krizhevsky et al. [18]. (c): Our 1st layer features. The smaller stride (2 vs 4) and filter size (7x7 vs 11x11) results in more distinctive features and fewer “dead” features. (d): Visualizations of 2nd layer features from Krizhevsky et al. [18]. (e): Visualizations of our 2nd layer features. These are cleaner, with no aliasing artifacts that are visible in (d).
图 5. (a):未做特征尺度裁剪时的第一层特征。可以看到其中一个特征占了主导。(b):Krizhevsky 等人 [18] 的第一层特征。(c):我们的第一层特征。更小的步长(2 对 4)和滤波器大小(7×7 对 11×11)带来了更有区分度的特征,以及更少的“死”特征。(d):Krizhevsky 等人 [18] 第二层特征的可视化。(e):我们第二层特征的可视化。它们更干净,没有 (d) 中可见的混叠伪影。
4.2 Occlusion Sensitivity
With image classification approaches, a natural question is if the model is truly identifying the location of the object in the image, or just using the surrounding context. Fig. 6 attempts to answer this question by systematically occluding different portions of the input image with a grey square, and monitoring the output of the classifier. The examples clearly show the model is localizing the objects within the scene, as the probability of the correct class drops significantly when the object is occluded. Fig. 6 also shows visualizations from the strongest feature map of the top convolution layer, in addition to activity in this map (summed over spatial locations) as a function of occluder position. When the occluder covers the image region that appears in the visualization, we see a strong drop in activity in the feature map. This shows that the visualization genuinely corresponds to the image structure that stimulates that feature map, hence validating the other visualizations shown in Fig. 4 and Fig. 2.
对图像分类方法来说,一个自然的问题是:模型是否真的在定位图像中的物体,还是仅仅在利用周围的上下文。图 6 试图回答这个问题:用灰色方块系统地遮挡输入图像的不同部分,并观察分类器的输出。这些例子清楚地表明,模型在对场景中的物体做定位,因为当物体被遮挡时,正确类别的概率会显著下降。图 6 还给出了顶部卷积层中最强特征图的可视化,以及该特征图的活动(在空间位置上求和)随遮挡位置的变化。当遮挡块盖住可视化中出现的图像区域时,该特征图的活动会出现明显下降。这说明可视化确实对应着激发该特征图的图像结构,从而也验证了图 4 和图 2 中的其他可视化。
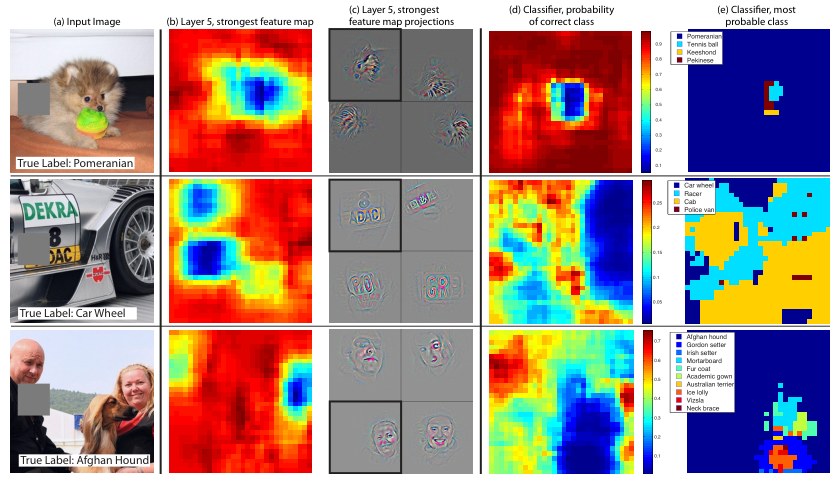
Fig. 6. Three test examples where we systematically cover up different portions of the scene with a gray square (1st column) and see how the top (layer 5) feature maps ((b) & (c)) and classifier output ((d) & (e)) changes. (b): for each position of the gray scale, we record the total activation in one layer 5 feature map (the one with the strongest response in the unoccluded image). (c): a visualization of this feature map projected down into the input image (black square), along with visualizations of this map from other images. The first row example shows the strongest feature to be the dog’s face. When this is covered-up the activity in the feature map decreases (blue area in (b)). (d): a map of correct class probability, as a function of the position of the gray square. E.g. when the dog’s face is obscured, the probability for “pomeranian” drops significantly. (e): the most probable label as a function of occluder position. E.g. in the 1st row, for most locations it is “pomeranian”, but if the dog’s face is obscured but not the ball, then it predicts “tennis ball”. In the 2nd example, text on the car is the strongest feature in layer 5, but the classifier is most sensitive to the wheel. The 3rd example contains multiple objects. The strongest feature in layer 5 picks out the faces, but the classifier is sensitive to the dog (blue region in (d)), since it uses multiple feature maps.
图 6. 三个测试例子:我们用灰色方块系统地盖住场景的不同部分(第 1 列),观察顶部(第 5 层)特征图((b) 和 (c))以及分类器输出((d) 和 (e))如何变化。(b):对灰色方块的每个位置,记录第 5 层某一个特征图中的总激活(该特征图在未遮挡图像中响应最强)。(c):把该特征图投影回输入图像的可视化(黑色方块),以及该特征图在其他图像上的可视化。第一行的例子表明最强特征是狗的脸。当这部分被盖住时,特征图中的活动下降((b) 中的蓝色区域)。(d):正确类别概率随灰色方块位置变化的图。例如,当狗脸被挡住时,“pomeranian”的概率显著下降。(e):最可能标签随遮挡位置的变化。例如在第一行,多数位置上仍是 “pomeranian”,但如果挡住狗脸却留下球,模型会预测 “tennis ball”。第二个例子中,车上的文字是第 5 层最强的特征,但分类器对轮子最敏感。第三个例子包含多个物体。第 5 层最强的特征抓住的是人脸,但分类器对狗敏感((d) 中的蓝色区域),因为它使用了多个特征图。
5 Experiments
5.1 ImageNet 2012
This dataset consists of 1.3M/50k/100k training/validation/test examples, spread over 1000 categories. Table 1 shows our results on this dataset.
该数据集包含 130 万 / 5 万 / 10 万个训练 / 验证 / 测试样本,覆盖 1000 个类别。表 1 给出我们在该数据集上的结果。
Using the exact architecture specified in Krizhevsky et al. [18], we attempt to replicate their result on the validation set. We achieve an error rate within 0.1% of their reported value on the ImageNet 2012 validation set.
我们采用 Krizhevsky 等人 [18] 给出的精确结构,试图在验证集上复现他们的结果。在 ImageNet 2012 验证集上,我们得到的误差率与他们报告的数值相差在 0.1% 以内。
Next we analyze the performance of our model with the architectural changes outlined in Section 4.1 (7 × 7 filters in layer 1 and stride 2 convolutions in layers 1 & 2). This model, shown in Fig. 3, significantly outperforms the architecture of Krizhevsky et al. [18], beating their single model result by 1.7% (test top-5). When we combine multiple models, we obtain a test error of 14.8%, an improvement of 1.6%. This result is close to that produced by the data-augmentation approaches of Howard [15], which could easily be combined with our architecture. However, our model is some way short of the winner of the 2013 Imagenet classification competition [28].
接下来我们分析第 4.1 节所述结构改动(第 1 层使用 7×7 滤波器,第 1、2 层使用步长为 2 的卷积)后模型的表现。如图 3 所示的这一模型明显优于 Krizhevsky 等人 [18] 的结构,在测试集 top-5 上比他们的单模型结果低 1.7 个百分点。把多个模型组合起来后,测试误差为 14.8%,改进了 1.6 个百分点。这一结果已接近 Howard [15] 用数据增强方法得到的成绩,而那些增强可以很容易与我们的结构结合。不过,我们的模型与 2013 年 ImageNet 分类竞赛的冠军 [28] 仍有一段距离。
Table 1. ImageNet 2012/2013 classification error rates. The ∗ indicates models that were trained on both ImageNet 2011 and 2012 training sets.
| Error % | Val Top-1 | Val Top-5 | Test Top-5 |
|---|---|---|---|
| Gunji et al. [12] | – | – | 26.2 |
| DeCAF [7] | – | – | 19.2 |
| Krizhevsky et al. [18], 1 convnet | 40.7 | 18.2 | –– |
| Krizhevsky et al. [18], 5 convnets | 38.1 | 16.4 | 16.4 |
| Krizhevsky et al. ∗[18], 1 convnets | 39.0 | 16.6 | –– |
| Krizhevsky et al. ∗[18], 7 convnets | 36.7 | 15.4 | 15.3 |
| Our replication of Krizhevsky et al., 1 convnet | 40.5 | 18.1 | –– |
| 1 convnet as per Fig. 3 | 38.4 | 16.5 | –– |
| 5 convnets as per Fig. 3 – (a) | 36.7 | 15.3 | 15.3 |
| 1 convnet as per Fig. 3 but with layers 3,4,5: 512,1024,512 maps – (b) | 37.5 | 16.0 | 16.1 |
| 6 convnets, (a) & (b) combined | 36.0 | 14.7 | 14.8 |
| Howard [15] | – | – | 13.5 |
| Clarifai [28] | – | – | 11.7 |
表 1. ImageNet 2012/2013 分类误差率。∗ 表示同时在 ImageNet 2011 和 2012 训练集上训练的模型。
| 误差 % | 验证 Top-1 | 验证 Top-5 | 测试 Top-5 |
|---|---|---|---|
| Gunji et al. [12] | – | – | 26.2 |
| DeCAF [7] | – | – | 19.2 |
| Krizhevsky et al. [18], 1 convnet | 40.7 | 18.2 | –– |
| Krizhevsky et al. [18], 5 convnets | 38.1 | 16.4 | 16.4 |
| Krizhevsky et al. ∗[18], 1 convnets | 39.0 | 16.6 | –– |
| Krizhevsky et al. ∗[18], 7 convnets | 36.7 | 15.4 | 15.3 |
| Our replication of Krizhevsky et al., 1 convnet | 40.5 | 18.1 | –– |
| 1 convnet as per Fig. 3 | 38.4 | 16.5 | –– |
| 5 convnets as per Fig. 3 – (a) | 36.7 | 15.3 | 15.3 |
| 1 convnet as per Fig. 3 but with layers 3,4,5: 512,1024,512 maps – (b) | 37.5 | 16.0 | 16.1 |
| 6 convnets, (a) & (b) combined | 36.0 | 14.7 | 14.8 |
| Howard [15] | – | – | 13.5 |
| Clarifai [28] | – | – | 11.7 |
Varying ImageNet Model Sizes: In Table 2, we first explore the architecture of Krizhevsky et al. [18] by adjusting the size of layers, or removing them entirely. In each case, the model is trained from scratch with the revised architecture. Removing the fully connected layers (6,7) only gives a slight increase in error (in the following, we refer to top-5 validation error). This is surprising, given that they contain the majority of model parameters. Removing two of the middle convolutional layers also makes a relatively small difference to the error rate. However, removing both the middle convolution layers and the fully connected layers yields a model with only 4 layers whose performance is dramatically worse. This would suggest that the overall depth of the model is important for obtaining good performance. We then modify our model, shown in Fig. 3. Changing the size of the fully connected layers makes little difference to performance (same for model of Krizhevsky et al. [18]). However, increasing the size of the middle convolution layers goes give a useful gain in performance. But increasing these, while also enlarging the fully connected layers results in over-fitting.
改变 ImageNet 模型规模:在表 2 中,我们首先考察 Krizhevsky 等人 [18] 的结构,调整各层大小,或直接去掉某些层。每种情形下,模型都按修改后的结构从头训练。去掉全连接层(第 6、7 层)只会让误差略有上升(下文均指验证集 top-5 误差)。这一点令人意外,因为这两层包含了模型的大部分参数。去掉中间的两层卷积,对误差率的影响也相对较小。然而,如果同时去掉中间卷积层和全连接层,得到的只有 4 层的模型,性能会大幅下降。这表明,要取得好的性能,重要的是模型的整体深度。随后我们修改图 3 所示的模型。改变全连接层的大小对性能影响很小(Krizhevsky 等人 [18] 的模型同样如此)。不过,增大中间卷积层的规模确实能带来有用的性能提升。但如果在增大这些层的同时再扩大全连接层,则会导致过拟合。
Table 2. ImageNet 2012 classification error rates with various architectural changes to the model of Krizhevsky et al. [18] and our model (see Fig. 3)
| Error % | Train Top-1 | Val Top-1 | Val Top-5 |
|---|---|---|---|
| Our replication of Krizhevsky et al. [18], 1 convnet | 35.1 | 40.5 | 18.1 |
| Removed layers 3,4 | 41.8 | 45.4 | 22.1 |
| Removed layer 7 | 27.4 | 40.0 | 18.4 |
| Removed layers 6,7 | 27.4 | 44.8 | 22.4 |
| Removed layer 3,4,6,7 | 71.1 | 71.3 | 50.1 |
| Adjust layers 6,7: 2048 units | 40.3 | 41.7 | 18.8 |
| Adjust layers 6,7: 8192 units | 26.8 | 40.0 | 18.1 |
| Our Model (as per Fig. 3) | 33.1 | 38.4 | 16.5 |
| Adjust layers 6,7: 2048 units | 38.2 | 40.2 | 17.6 |
| Adjust layers 6,7: 8192 units | 22.0 | 38.8 | 17.0 |
| Adjust layers 3,4,5: 512,1024,512 maps | 18.8 | 37.5 | 16.0 |
| Adjust layers 6,7: 8192 units and Layers 3,4,5: 512,1024,512 maps | 10.0 | 38.3 | 16.9 |
表 2. 对 Krizhevsky 等人 [18] 的模型以及我们的模型(见图 3)做各种结构改动后,在 ImageNet 2012 上的分类误差率。
| 误差 % | 训练 Top-1 | 验证 Top-1 | 验证 Top-5 |
|---|---|---|---|
| Our replication of Krizhevsky et al. [18], 1 convnet | 35.1 | 40.5 | 18.1 |
| Removed layers 3,4 | 41.8 | 45.4 | 22.1 |
| Removed layer 7 | 27.4 | 40.0 | 18.4 |
| Removed layers 6,7 | 27.4 | 44.8 | 22.4 |
| Removed layer 3,4,6,7 | 71.1 | 71.3 | 50.1 |
| Adjust layers 6,7: 2048 units | 40.3 | 41.7 | 18.8 |
| Adjust layers 6,7: 8192 units | 26.8 | 40.0 | 18.1 |
| Our Model (as per Fig. 3) | 33.1 | 38.4 | 16.5 |
| Adjust layers 6,7: 2048 units | 38.2 | 40.2 | 17.6 |
| Adjust layers 6,7: 8192 units | 22.0 | 38.8 | 17.0 |
| Adjust layers 3,4,5: 512,1024,512 maps | 18.8 | 37.5 | 16.0 |
| Adjust layers 6,7: 8192 units and Layers 3,4,5: 512,1024,512 maps | 10.0 | 38.3 | 16.9 |
5.2 Feature Generalization
The experiments above show the importance of the convolutional part of our ImageNet model in obtaining state-of-the-art performance. This is supported by the visualizations of Fig. 2 which show the complex invariances learned in the convolutional layers. We now explore the ability of these feature extraction layers to generalize to other datasets, namely Caltech-101 [9], Caltech-256 [11] and PASCAL VOC 2012. To do this, we keep layers 1-7 of our ImageNet-trained model fixed and train a new softmax classifier on top (for the appropriate number of classes) using the training images of the new dataset. Since the softmax contains relatively few parameters, it can be trained quickly from a relatively small number of examples, as is the case for certain datasets.
上面的实验表明,要取得当时最好的成绩,ImageNet 模型中的卷积部分非常重要。图 2 的可视化也支持这一点,它显示出卷积层学到了复杂的不变性。我们接下来考察这些特征提取层向其他数据集推广的能力,具体是 Caltech-101 [9]、Caltech-256 [11] 和 PASCAL VOC 2012。做法是固定 ImageNet 训练模型的第 1–7 层,只在其上方用新数据集的训练图像训练一个新的 softmax 分类器(类别数做相应调整)。由于 softmax 的参数相对较少,即使样本不太多也能较快训好,某些数据集正是这种情形。
The experiments compare our feature representation, obtained from ImageNet, with the hand-crafted features used by other methods. In both our approach and existing ones the Caltech/PASCAL training data is only used to train the classifier. As they are of similar complexity (ours: softmax, others: linear SVM), the feature representation is crucial to performance. It is important to note that both representations were built using images beyond the Caltech and PASCAL training sets. For example, the hyper-parameters in HOG descriptors were determined through systematic experiments on a pedestrian dataset [5].
这些实验把我们从 ImageNet 得到的特征表示,与其他方法使用的手工特征进行比较。无论是我们的方法还是已有方法,Caltech/PASCAL 的训练数据都只用来训练分类器。由于分类器复杂度相近(我们用 softmax,其他方法用线性 SVM),特征表示对性能至关重要。需要指出的是,两种表示都使用了 Caltech 和 PASCAL 训练集之外的图像来构建。例如,HOG 描述子中的超参数,就是在一个行人数据集上通过系统实验确定的 [5]。
We also try a second strategy of training a model from scratch, i.e. resetting layers 1-7 to random values and train them, as well as the softmax, on the training images of the PASCAL/Caltech dataset.
我们还尝试了第二种策略:从头训练模型,也就是把第 1–7 层重置为随机值,并连同 softmax 一起在 PASCAL/Caltech 的训练图像上训练。
One complication is that some of the Caltech datasets have some images that are also in the ImageNet training data. Using normalized correlation, we identified these few “overlap” images[^2] and removed them from our Imagenet training set and then retrained our Imagenet models, so avoiding the possibility of train/test contamination.
一个麻烦是,部分 Caltech 数据集中有些图像也出现在 ImageNet 训练集里。我们用归一化相关找出了这些为数不多的“重叠”图像[^2],从我们的 ImageNet 训练集中删掉,再重新训练 ImageNet 模型,以避免训练/测试污染。
[^2]: For Caltech-101, we found 44 images in common (out of 9,144 total images), with a maximum overlap of 10 for any given class. For Caltech-256, we found 243 images in common (out of 30,607 total images), with a maximum overlap of 18 for any given class.
[^2]: 对 Caltech-101,我们找到 44 张共同图像(总共 9,144 张),任一类别的最大重叠为 10 张。对 Caltech-256,我们找到 243 张共同图像(总共 30,607 张),任一类别的最大重叠为 18 张。
Caltech-101: We follow the procedure of [9] and randomly select 15 or 30 images per class for training and test on up to 50 images per class reporting the average of the per-class accuracies in Table 3, using 5 train/test folds. Training took 17 minutes for 30 images/class. The pre-trained model beats the best reported result for 30 images/class from [3] by 2.2%. Our result agrees with the recently published result of Donahue et al. [7], who obtain 86.1% accuracy (30 imgs/class). The convnet model trained from scratch however does terribly, only achieving 46.5%, showing the impossibility of training a large convnet on such a small dataset.
Caltech-101:我们遵循 [9] 的设定,每类随机选取 15 或 30 张图像用于训练,每类最多用 50 张做测试,在表 3 中报告各类准确率的平均值,并使用 5 个训练/测试折。每类 30 张时,训练耗时 17 分钟。预训练模型在每类 30 张的设定上,比 [3] 报告的最好结果高 2.2 个百分点。我们的结果与 Donahue 等人 [7] 新近发表的结果一致,他们得到了 86.1% 的准确率(每类 30 张)。然而,从头训练的卷积网络表现很差,只有 46.5%,说明在如此小的数据集上训练大型卷积网络是不可行的。
Table 3. Caltech-101 classification accuracy for our convnet models, against two leading alternate approaches
| # Train | Acc % 15/class | Acc % 30/class |
|---|---|---|
| Bo et al. [3] | − | 81.4 ± 0.33 |
| Yang et al. [17] | 73.2 | 84.3 |
| Non-pretrained convnet | 22.8 ± 1.5 | 46.5 ± 1.7 |
| ImageNet-pretrained convnet | 83.8 ± 0.5 | 86.5 ± 0.5 |
表 3. 我们的卷积网络在 Caltech-101 上的分类准确率,并与两种领先的替代方法比较。
| 训练数量 | 准确率 % 15/类 | 准确率 % 30/类 |
|---|---|---|
| Bo et al. [3] | − | 81.4 ± 0.33 |
| Yang et al. [17] | 73.2 | 84.3 |
| Non-pretrained convnet | 22.8 ± 1.5 | 46.5 ± 1.7 |
| ImageNet-pretrained convnet | 83.8 ± 0.5 | 86.5 ± 0.5 |
Caltech-256: We follow the procedure of [11], selecting 15, 30, 45, or 60 training images per class, reporting the average of the per-class accuracies in Table 4. Our ImageNet-pretrained model beats the current state-of-the-art results obtained by Bo et al. [3] by a significant margin: 74.2% vs 55.2% for 60 training images/class. However, as with Caltech-101, the model trained from scratch does poorly. In Fig. 7, we explore the “one-shot learning” [9] regime. With our pre-trained model, just 6 Caltech-256 training images are needed to beat the leading method using 10 times as many images. This shows the power of the ImageNet feature extractor.
Caltech-256:我们遵循 [11] 的设定,每类选取 15、30、45 或 60 张训练图像,在表 4 中报告各类准确率的平均值。我们的 ImageNet 预训练模型以明显优势超过 Bo 等人 [3] 当时最好的结果:在每类 60 张训练图像时为 74.2% 对 55.2%。不过,与 Caltech-101 一样,从头训练的模型表现较差。在图 7 中,我们考察了“一次性学习”(one-shot learning)[9] 的情形。使用预训练模型,只需每类 6 张 Caltech-256 训练图像,就能超过领先方法用十倍样本得到的结果。这显示出 ImageNet 特征提取器的能力。
Table 4. Caltech 256 classification accuracies
| # Train | Acc % 15/class | Acc % 30/class | Acc % 45/class | Acc % 60/class |
|---|---|---|---|---|
| Sohn et al. [24] | 35.1 | 42.1 | 45.7 | 47.9 |
| Bo et al. [3] | 40.5 ± 0.4 | 48.0 ± 0.2 | 51.9 ± 0.2 | 55.2 ± 0.3 |
| Non-pretr. | 9.0 ± 1.4 | 22.5 ± 0.7 | 31.2 ± 0.5 | 38.8 ± 1.4 |
| ImageNet-pretr. | 65.7 ± 0.2 | 70.6 ± 0.2 | 72.7 ± 0.4 | 74.2 ± 0.3 |
表 4. Caltech-256 分类准确率。
| 训练数量 | 准确率 % 15/类 | 准确率 % 30/类 | 准确率 % 45/类 | 准确率 % 60/类 |
|---|---|---|---|---|
| Sohn et al. [24] | 35.1 | 42.1 | 45.7 | 47.9 |
| Bo et al. [3] | 40.5 ± 0.4 | 48.0 ± 0.2 | 51.9 ± 0.2 | 55.2 ± 0.3 |
| Non-pretr. | 9.0 ± 1.4 | 22.5 ± 0.7 | 31.2 ± 0.5 | 38.8 ± 1.4 |
| ImageNet-pretr. | 65.7 ± 0.2 | 70.6 ± 0.2 | 72.7 ± 0.4 | 74.2 ± 0.3 |
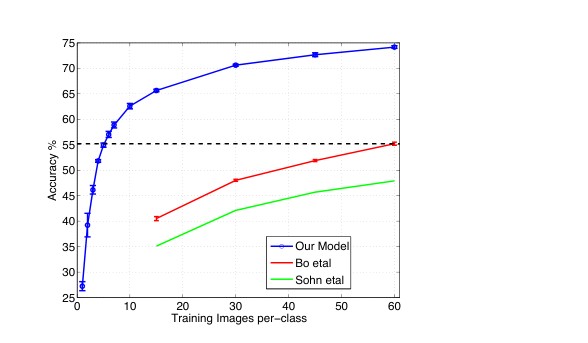
Fig. 7. Caltech-256 classification performance as the number of training images per class is varied. Using only 6 training examples per class with our pre-trained feature extractor, we surpass best reported result by Bo et al. [3].
图 7. Caltech-256 分类性能随每类训练图像数量的变化。使用我们的预训练特征提取器,每类只需 6 个训练样本,就超过了 Bo 等人 [3] 报告的最好结果。
PASCAL 2012: We used the standard training and validation images to train a 20-way softmax on top of the ImageNet-pretrained convnet. This is not ideal, as PASCAL images can contain multiple objects and our model just provides a single exclusive prediction for each image. Table 5 shows the results on the test set, comparing to the leading methods: the top 2 entries in the competition and concurrent work from Oquab et al. [21] who use a convnet with a more appropriate classifier. The PASCAL and ImageNet images are quite different in nature, the former being full scenes unlike the latter. This may explain our mean performance being 3.2% lower than the leading competition result [27], however we do beat them on 5 classes, sometimes by large margins.
PASCAL 2012:我们使用标准的训练和验证图像,在 ImageNet 预训练卷积网络之上训练一个 20 路 softmax。这并不理想,因为 PASCAL 图像中可能包含多个物体,而我们的模型对每张图像只给出一个互斥预测。表 5 给出测试集结果,并与领先方法比较:竞赛中的前两名,以及 Oquab 等人 [21] 的同期工作,后者使用了带有更合适分类器的卷积网络。PASCAL 与 ImageNet 的图像性质相当不同,前者是完整场景,后者则不是。这或许可以解释,我们的平均成绩比竞赛中的领先结果 [27] 低 3.2 个百分点;不过我们仍在 5 个类别上超过了他们,有时差距还相当大。
Table 5. PASCAL 2012 classification results, comparing our Imagenet-pretrained convnet against the leading two methods and the recent approach of Oquab et al. [21]
| Acc % | [22] | [27] | [21] | Ours | Acc % | [22] | [27] | [21] | Ours |
|---|---|---|---|---|---|---|---|---|---|
| Airplane | 92.0 | 97.3 | 94.6 | 96.0 | Dining table | 63.2 | 77.8 | 69.0 | 67.7 |
| Bicycle | 74.2 | 84.2 | 82.9 | 77.1 | Dog | 68.9 | 83.0 | 92.1 | 87.8 |
| Bird | 73.0 | 80.8 | 88.2 | 88.4 | Horse | 78.2 | 87.5 | 93.4 | 86.0 |
| Boat | 77.5 | 85.3 | 60.3 | 85.5 | Motorbike | 81.0 | 90.1 | 88.6 | 85.1 |
| Bottle | 54.3 | 60.8 | 60.3 | 55.8 | Person | 91.6 | 95.0 | 96.1 | 90.9 |
| Bus | 85.2 | 89.9 | 89.0 | 85.8 | Potted plant | 55.9 | 57.8 | 64.3 | 52.2 |
| Car | 81.9 | 86.8 | 84.4 | 78.6 | Sheep | 69.4 | 79.2 | 86.6 | 83.6 |
| Cat | 76.4 | 89.3 | 90.7 | 91.2 | Sofa | 65.4 | 73.4 | 62.3 | 61.1 |
| Chair | 65.2 | 75.4 | 72.1 | 65.0 | Train | 86.7 | 94.5 | 91.1 | 91.8 |
| Cow | 63.2 | 77.8 | 86.8 | 74.4 | Tv | 77.4 | 80.7 | 79.8 | 76.1 |
| Mean | 74.3 | 82.2 | 82.8 | 79.0 | # won | 0 | 11 | 6 | 3 |
表 5. PASCAL 2012 分类结果,将我们的 ImageNet 预训练卷积网络与领先的两种方法以及 Oquab 等人 [21] 的近期方法进行比较。
| 准确率 % | [22] | [27] | [21] | 本文 | 准确率 % | [22] | [27] | [21] | 本文 |
|---|---|---|---|---|---|---|---|---|---|
| Airplane | 92.0 | 97.3 | 94.6 | 96.0 | Dining table | 63.2 | 77.8 | 69.0 | 67.7 |
| Bicycle | 74.2 | 84.2 | 82.9 | 77.1 | Dog | 68.9 | 83.0 | 92.1 | 87.8 |
| Bird | 73.0 | 80.8 | 88.2 | 88.4 | Horse | 78.2 | 87.5 | 93.4 | 86.0 |
| Boat | 77.5 | 85.3 | 60.3 | 85.5 | Motorbike | 81.0 | 90.1 | 88.6 | 85.1 |
| Bottle | 54.3 | 60.8 | 60.3 | 55.8 | Person | 91.6 | 95.0 | 96.1 | 90.9 |
| Bus | 85.2 | 89.9 | 89.0 | 85.8 | Potted plant | 55.9 | 57.8 | 64.3 | 52.2 |
| Car | 81.9 | 86.8 | 84.4 | 78.6 | Sheep | 69.4 | 79.2 | 86.6 | 83.6 |
| Cat | 76.4 | 89.3 | 90.7 | 91.2 | Sofa | 65.4 | 73.4 | 62.3 | 61.1 |
| Chair | 65.2 | 75.4 | 72.1 | 65.0 | Train | 86.7 | 94.5 | 91.1 | 91.8 |
| Cow | 63.2 | 77.8 | 86.8 | 74.4 | Tv | 77.4 | 80.7 | 79.8 | 76.1 |
| Mean | 74.3 | 82.2 | 82.8 | 79.0 | # won | 0 | 11 | 6 | 3 |
5.3 Feature Analysis
We explore how discriminative the features in each layer of our Imagenet-pretrained model are. We do this by varying the number of layers retained from the ImageNet model and place either a linear SVM or softmax classifier on top. Table 6 shows results on Caltech-101 and Caltech-256. For both datasets, a steady improvement can be seen as we ascend the model, with best results being obtained by using all layers. This supports the premise that as the feature hierarchies become deeper, they learn increasingly powerful features.
我们考察 ImageNet 预训练模型各层特征的判别力。方法是改变从 ImageNet 模型中保留的层数,并在其上放置线性 SVM 或 softmax 分类器。表 6 给出在 Caltech-101 和 Caltech-256 上的结果。在这两个数据集上,随着所取层数上升,成绩都稳步提高,最好结果出现在使用全部层的时候。这支持了如下看法:随着特征层次加深,网络学到的特征也越来越强。
Table 6. Analysis of the discriminative information contained in each layer of feature maps within our ImageNet-pretrained convnet. We train either a linear SVM or softmax on features from different layers (as indicated in brackets) from the convnet. Higher layers generally produce more discriminative features.
| Cal-101 (30/class) | Cal-256 (60/class) | |
|---|---|---|
| SVM (1) | 44.8 ± 0.7 | 24.6 ± 0.4 |
| SVM (2) | 66.2 ± 0.5 | 39.6 ± 0.3 |
| SVM (3) | 72.3 ± 0.4 | 46.0 ± 0.3 |
| SVM (4) | 76.6 ± 0.4 | 51.3 ± 0.1 |
| SVM (5) | 86.2 ± 0.8 | 65.6 ± 0.3 |
| SVM (7) | 85.5 ± 0.4 | 71.7 ± 0.2 |
| Softmax (5) | 82.9 ± 0.4 | 65.7 ± 0.5 |
| Softmax (7) | 85.4 ± 0.4 | 72.6 ± 0.1 |
表 6. 对我们 ImageNet 预训练卷积网络中各层特征图所含判别信息的分析。我们在卷积网络不同层(括号中标明)的特征上训练线性 SVM 或 softmax。一般而言,越高层产生的特征越具判别性。
| Cal-101(30/类) | Cal-256(60/类) | |
|---|---|---|
| SVM (1) | 44.8 ± 0.7 | 24.6 ± 0.4 |
| SVM (2) | 66.2 ± 0.5 | 39.6 ± 0.3 |
| SVM (3) | 72.3 ± 0.4 | 46.0 ± 0.3 |
| SVM (4) | 76.6 ± 0.4 | 51.3 ± 0.1 |
| SVM (5) | 86.2 ± 0.8 | 65.6 ± 0.3 |
| SVM (7) | 85.5 ± 0.4 | 71.7 ± 0.2 |
| Softmax (5) | 82.9 ± 0.4 | 65.7 ± 0.5 |
| Softmax (7) | 85.4 ± 0.4 | 72.6 ± 0.1 |
6 Discussion
We explored large convolutional neural network models, trained for image classification, in a number ways. First, we presented a novel way to visualize the activity within the model. This reveals the features to be far from random, uninterpretable patterns. Rather, they show many intuitively desirable properties such as compositionality, increasing invariance and class discrimination as we ascend the layers. We also show how these visualization can be used to identify problems with the model and so obtain better results, for example improving on Krizhevsky et al. ’s [18] impressive ImageNet 2012 result. We then demonstrated through a series of occlusion experiments that the model, while trained for classification, is highly sensitive to local structure in the image and is not just using broad scene context. An ablation study on the model revealed that having a minimum depth to the network, rather than any individual section, is vital to the model’s performance.
我们从多个方面考察了用于图像分类的大型卷积网络模型。首先,我们提出了一种可视化模型内部活动的新方法。结果表明,这些特征远不是随机、无法解释的模式,而是具有许多符合直觉的性质,例如组合性,以及随着层数上升而增强的不变性和类别判别力。我们还表明,这些可视化可以用来发现模型中的问题,从而得到更好的结果,例如改进 Krizhevsky 等人 [18] 在 ImageNet 2012 上已经相当出色的成绩。随后,一系列遮挡实验表明,尽管模型是为分类而训练的,它对图像中的局部结构高度敏感,而不是仅仅利用宽泛的场景上下文。对模型的消融研究还表明,对性能至关重要的是网络具有足够的最小深度,而不是其中某一段单独起作用。
Finally, we showed how the ImageNet trained model can generalize well to other datasets. For Caltech-101 and Caltech-256, the datasets are similar enough that we can beat the best reported results, in the latter case by a significant margin. Our convnet model generalized less well to the PASCAL data, perhaps suffering from dataset bias [25], although it was still within 3.2% of the best reported result, despite no tuning for the task. For example, our performance might improve if a different loss function was used that permitted multiple objects per image. This would naturally enable the networks to tackle the object detection as well.
最后,我们表明在 ImageNet 上训练的模型可以很好地推广到其他数据集。对 Caltech-101 和 Caltech-256 来说,数据集足够相近,我们能够超过已报告的最好结果,在后者上优势还相当明显。我们的卷积网络对 PASCAL 数据的推广要弱一些,或许受到了数据集偏差 [25] 的影响;不过即便没有为该任务做调参,它仍与最好报告结果相差在 3.2% 以内。例如,如果改用允许每张图像有多个物体的损失函数,性能还有可能提高。这样也会自然地使网络能够处理物体检测。
Acknowledgments. The authors would like to thank Yann LeCun for helpful discussions and acknowledge support from NSERC, NSF grant #1116923 and Microsoft Research.
致谢。作者感谢 Yann LeCun 的有益讨论,并感谢 NSERC、NSF 基金 #1116923 以及微软研究院的支持。
References
- Bengio, Y., Lamblin, P., Popovici, D., Larochelle, H.: Greedy layer-wise training of deep networks. In: NIPS, pp. 153–160 (2007)
- Berkes, P., Wiskott, L.: On the analysis and interpretation of inhomogeneous quadratic forms as receptive fields. Neural Computation (2006)
- Bo, L., Ren, X., Fox, D.: Multipath sparse coding using hierarchical matching pursuit. In: CVPR (2013)
- Ciresan, D.C., Meier, J., Schmidhuber, J.: Multi-column deep neural networks for image classification. In: CVPR (2012)
- Dalal, N., Triggs, B.: Histograms of oriented gradients for pedestrian detection. In: CVPR (2005)
- Deng, J., Dong, W., Socher, R., Li, L.J., Li, K., Fei-Fei, L.: ImageNet: A Large-Scale Hierarchical Image Database. In: CVPR 2009 (2009)
- Donahue, J., Jia, Y., Vinyals, O., Hoffman, J., Zhang, N., Tzeng, E., Darrell, T.: DeCAF: A deep convolutional activation feature for generic visual recognition. arXiv:1310.1531 (2013)
- Erhan, D., Bengio, Y., Courville, A., Vincent, P.: Visualizing higher-layer features of a deep network. Technical report, University of Montreal (2009)
- Fei-fei, L., Fergus, R., Perona, P.: One-shot learning of object categories. IEEE Trans. PAMI (2006)
- Girshick, R., Donahue, J., Darrell, T., Malik, J.: Rich feature hierarchies for accurate object detection and semantic segmentation. arXiv:1311.2524 (2014)
- Griffin, G., Holub, A., Perona, P.: The caltech 256. Caltech Technical Report (2006)
- Gunji, N., Higuchi, T., Yasumoto, K., Muraoka, H., Ushiku, Y., Harada, T., Kuniyoshi, Y.: Classification entry. Imagenet Competition (2012)
- Hinton, G.E., Osindero, S., Teh, Y.: A fast learning algorithm for deep belief nets. Neural Computation 18, 1527–1554 (2006)
- Hinton, G.E., Srivastave, N., Krizhevsky, A., Sutskever, I., Salakhutdinov, R.R.: Improving neural networks by preventing co-adaptation of feature detectors. In: arXiv:1207.0580 (2012)
- Howard, A.G.: Some improvements on deep convolutional neural network based image classification. arXiv 1312.5402 (2013)
- Jarrett, K., Kavukcuoglu, K., Ranzato, M., LeCun, Y.: What is the best multi-stage architecture for object recognition? In: ICCV (2009)
- Jianchao, Y., Kai, Y., Yihong, G., Thomas, H.: Linear spatial pyramid matching using sparse coding for image classification. In: CVPR (2009)
- Krizhevsky, A., Sutskever, I., Hinton, G.: Imagenet classification with deep convolutional neural networks. In: NIPS (2012)
- Le, Q.V., Ngiam, J., Chen, Z., Chia, D., Koh, P., Ng, A.Y.: Tiled convolutional neural networks. In: NIPS (2010)
- LeCun, Y., Boser, B., Denker, J.S., Henderson, D., Howard, R.E., Hubbard, W., Jackel, L.D.: Backpropagation applied to handwritten zip code recognition. Neural Comput. 1(4), 541–551 (1989)
- Oquab, M., Bottou, L., Laptev, I., Sivic, J.: Learning and transferring mid-level image representations using convolutional neural networks. In: CVPR (2014)
- Sande, K., Uijlings, J., Snoek, C., Smeulders, A.: Hybrid coding for selective search. In: PASCAL VOC Classification Challenge 2012 (2012)
- Simonyan, K., Vedaldi, A., Zisserman, A.: Deep inside convolutional networks: Visualising image classification models and saliency maps. arXiv 1312.6034v1 (2013)
- Sohn, K., Jung, D., Lee, H., Hero III, A.: Efficient learning of sparse, distributed, convolutional feature representations for object recognition. In: ICCV (2011)
- Torralba, A., Efros, A.A.: Unbiased look at dataset bias. In: CVPR (2011)
- Vincent, P., Larochelle, H., Bengio, Y., Manzagol, P.A.: Extracting and composing robust features with denoising autoencoders. In: ICML, pp. 1096–1103 (2008)
- Yan, S., Dong, J., Chen, Q., Song, Z., Pan, Y., Xia, W., Huang, Z., Hua, Y., Shen, S.: Generalized hierarchical matching for sub-category aware object classification. In: PASCAL VOC Classification Challenge 2012 (2012)
- Zeiler, M.: Clarifai (2013), http://www.image-net.org/challenges/LSVRC/2013/results.php
- Zeiler, M., Taylor, G., Fergus, R.: Adaptive deconvolutional networks for mid and high level feature learning. In: ICCV (2011)