U-Net: Convolutional Networks for Biomedical Image Segmentation
U-Net: Convolutional Networks for Biomedical Image Segmentation
U-Net:面向生物医学图像分割的卷积网络(U-Net: Convolutional Networks for Biomedical Image Segmentation)
Olaf Ronneberger Affiliation: Computer Science Department and BIOSS Centre for Biological Signalling Studies, University of Freiburg, Germany Philipp Fischer Affiliation: , E-mail ronneber@informatik.uni-freiburg.de Thomas Brox Affiliation: WWW home page: http://lmb.informatik.uni-freiburg.de/
Olaf Ronneberger
所属机构:德国弗莱堡大学计算机科学系与 BIOSS 生物信号研究中心
Philipp Fischer
所属机构:同上
电子邮箱:ronneber@informatik.uni-freiburg.de
Thomas Brox
所属机构:同上
Abstract
摘要
There is large consent that successful training of deep networks requires many thousand annotated training samples. In this paper, we present a network and training strategy that relies on the strong use of data augmentation to use the available annotated samples more efficiently. The architecture consists of a contracting path to capture context and a symmetric expanding path that enables precise localization. We show that such a network can be trained end-to-end from very few images and outperforms the prior best method (a sliding-window convolutional network) on the ISBI challenge for segmentation of neuronal structures in electron microscopic stacks. Using the same network trained on transmitted light microscopy images (phase contrast and DIC) we won the ISBI cell tracking challenge 2015 in these categories by a large margin. Moreover, the network is fast. Segmentation of a 512x512 image takes less than a second on a recent GPU. The full implementation (based on Caffe) and the trained networks are available at http://lmb.informatik.uni-freiburg.de/people/ronneber/u-net.
人们普遍认为,成功训练深度网络需要成千上万张带标注的训练样本。本文提出一种网络与训练策略,大量依赖数据增强,以便更高效地使用有限的标注样本。架构由一条捕捉上下文的收缩路径与一条实现精确定位的对称扩张路径组成。我们表明,这样的网络可以从极少图像端到端训练,并在 ISBI 神经元结构分割挑战上超过此前的滑动窗口卷积网络。此外,该网络在 2015 年 ISBI 细胞跟踪挑战的光学显微图像分割任务上夺冠。此外,网络速度很快:在近期的 GPU 上,一张 512×512 图像的分割不到一秒。完整实现与训练好的网络已在 http://lmb.informatik.uni-freiburg.de/people/ronneber/u-net 公开。
1 Introduction
1 引言
In the last two years, deep convolutional networks have outperformed the state of the art in many visual recognition tasks, e.g. [7, 3]. While convolutional networks have already existed for a long time [8], their success was limited due to the size of the available training sets and the size of the considered networks. The breakthrough by Krizhevsky et al. [7] was due to supervised training of a large network with 8 layers and millions of parameters on the ImageNet dataset with 1 million training images. Since then, even larger and deeper networks have been trained [12].
在过去的两年里,深度卷积网络在许多视觉识别任务中都超越了最先进的技术,例如视觉识别任务。 [7, 3]。 虽然卷积网络已经存在很长时间了[8],但由于可用训练集的大小和所考虑的网络的大小,它们的成功受到限制。 Krizhevsky 等人的突破。 [7] 是由于在具有 100 万张训练图像的 ImageNet 数据集上对具有 8 层和数百万个参数的大型网络进行了监督训练。 从那时起,更大、更深的网络开始被训练[12]。
The typical use of convolutional networks is on classification tasks, where the output to an image is a single class label. However, in many visual tasks, especially in biomedical image processing, the desired output should include localization, i.e., a class label is supposed to be assigned to each pixel. Moreover, thousands of training images are usually beyond reach in biomedical tasks. Hence, Ciresan et al. [1] trained a network in a sliding-window setup to predict the class label of each pixel by providing a local region (patch) around that pixel as input. First, this network can localize. Secondly, the training data in terms of patches is much larger than the number of training images. The resulting network won the EM segmentation challenge at ISBI 2012 by a large margin.
卷积网络的典型用途是分类任务,其中图像的输出是单个类标签。 然而,在许多视觉任务中,特别是在生物医学图像处理中,所需的输出应该包括定位,即应该为每个像素分配一个类标签。 此外,在生物医学任务中,数以千计的训练图像通常是遥不可及的。 因此,Ciresan 等人。 [1] 在滑动窗口设置中训练网络,通过提供该像素周围的局部区域(补丁)作为输入来预测每个像素的类标签。 首先,这个网络可以定位。 其次,训练数据的块数远大于训练图像的数量。 由此产生的网络以大幅优势赢得了 ISBI 2012 的 EM 分割挑战赛。
Obviously, the strategy in Ciresan et al. [1] has two drawbacks. First, it is quite slow because the network must be run separately for each patch, and there is a lot of redundancy due to overlapping patches. Secondly, there is a trade-off between localization accuracy and the use of context. Larger patches require more max-pooling layers that reduce the localization accuracy, while small patches allow the network to see only little context. More recent approaches [11, 4] proposed a classifier output that takes into account the features from multiple layers. Good localization and the use of context are possible at the same time.
显然,Ciresan 等人的策略。 [1]有两个缺点。 首先,它非常慢,因为网络必须为每个补丁单独运行,并且由于补丁重叠而存在大量冗余。 其次,定位精度和上下文的使用之间存在权衡。 较大的补丁需要更多的最大池层,这会降低定位精度,而较小的补丁允许网络仅看到很少的上下文。 最近的方法 [11, 4] 提出了一种考虑多层特征的分类器输出。 良好的本地化和上下文的使用可以同时实现。
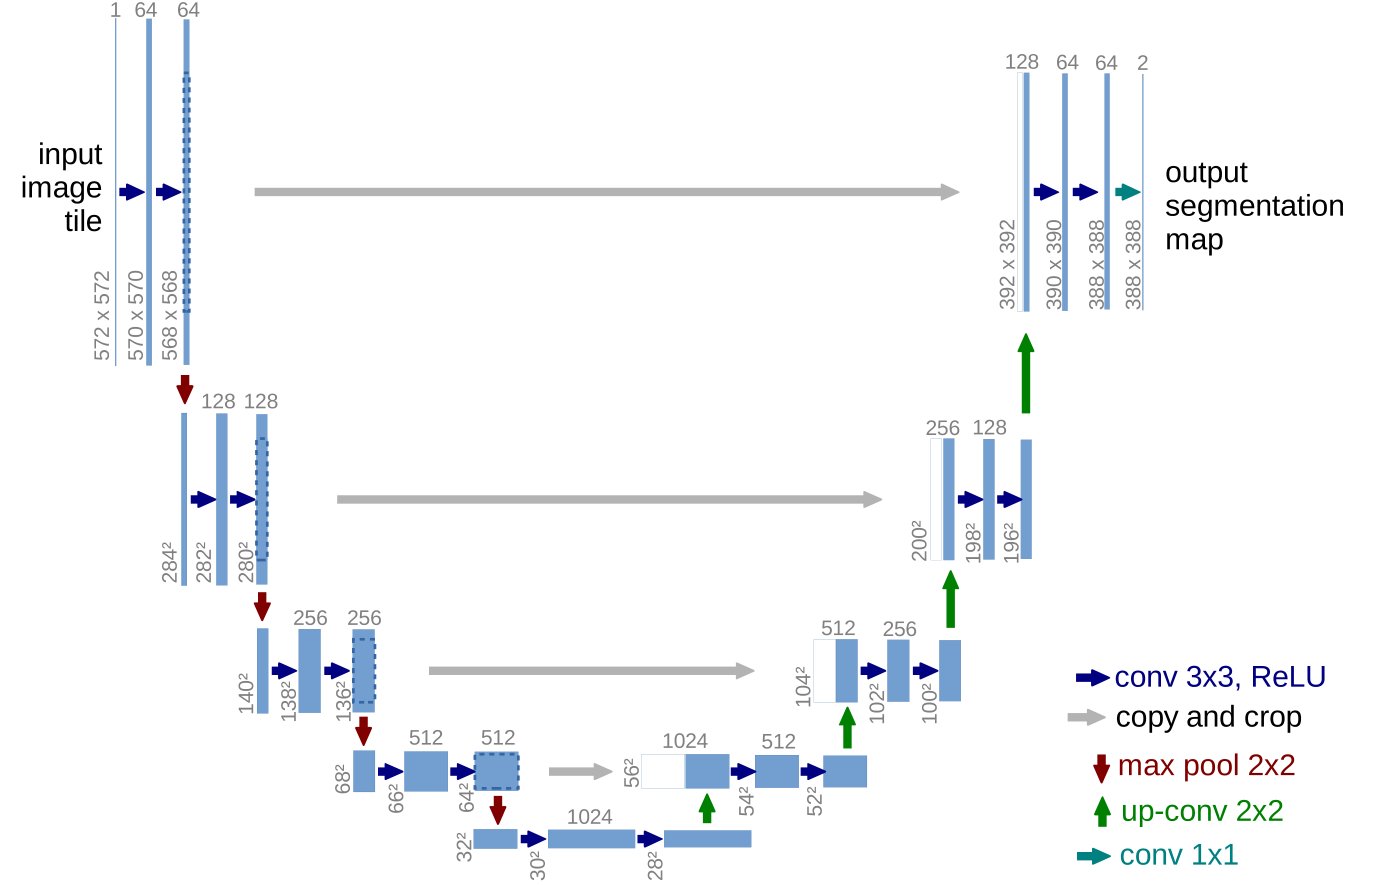
Figure 1: U-net architecture (example for 32x32 pixels in the lowest resolution). Each blue box corresponds to a multi-channel feature map. The number of channels is denoted on top of the box. The x-y-size is provided at the lower left edge of the box. White boxes represent copied feature maps. The arrows denote the different operations.
图 1:U-net 架构(最低分辨率下 32x32 像素的示例)。 每个蓝色框对应一个多通道特征图。 通道数显示在框的顶部。 x-y-尺寸位于框的左下边缘。 白框代表复制的特征图。 箭头表示不同的操作。
In this paper, we build upon a more elegant architecture, the so-called “fully convolutional network” [9]. We modify and extend this architecture such that it works with very few training images and yields more precise segmentations; see Figure 1. The main idea in [9] is to supplement a usual contracting network by successive layers, where pooling operators are replaced by upsampling operators. Hence, these layers increase the resolution of the output. In order to localize, high resolution features from the contracting path are combined with the upsampled output. A successive convolution layer can then learn to assemble a more precise output based on this information.
在本文中,我们构建了一种更优雅的架构,即所谓的“全卷积网络”[9]。 我们修改和扩展了这种架构,使其能够使用很少的训练图像并产生更精确的分割; 参见图 1。[9] 中的主要思想是通过连续的层来补充通常的收缩网络,其中池化算子被上采样算子取代。 因此,这些层提高了输出的分辨率。 为了定位,来自收缩路径的高分辨率特征与上采样输出相结合。 然后,连续的卷积层可以学习根据这些信息组合更精确的输出。
One important modification in our architecture is that in the upsampling part we have also a large number of feature channels, which allow the network to propagate context information to higher resolution layers. As a consequence, the expansive path is more or less symmetric to the contracting path, and yields a u-shaped architecture. The network does not have any fully connected layers and only uses the valid part of each convolution, i.e., the segmentation map only contains the pixels, for which the full context is available in the input image. This strategy allows the seamless segmentation of arbitrarily large images by an overlap-tile strategy (see Figure 2). To predict the pixels in the border region of the image, the missing context is extrapolated by mirroring the input image. This tiling strategy is important to apply the network to large images, since otherwise the resolution would be limited by the GPU memory.
我们架构中的一个重要修改是,在上采样部分,我们还有大量特征通道,这允许网络将上下文信息传播到更高分辨率的层。 因此,扩张路径或多或少与收缩路径对称,并产生 U 形架构。 该网络没有任何完全连接的层,仅使用每个卷积的有效部分,即分割图仅包含输入图像中可用的完整上下文的像素。 该策略允许通过重叠平铺策略对任意大图像进行无缝分割(见图 2)。 为了预测图像边界区域中的像素,通过镜像输入图像来推断丢失的上下文。 这种平铺策略对于将网络应用于大图像非常重要,否则分辨率将受到 GPU 内存的限制。
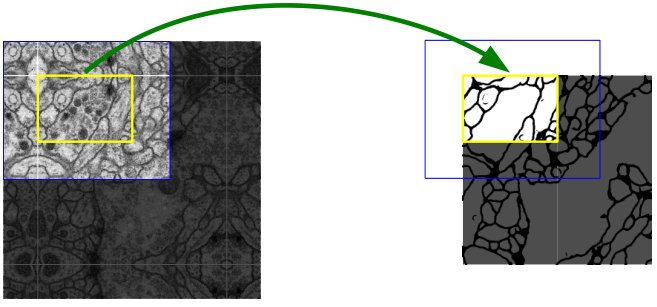
Figure 2: Overlap-tile strategy for seamless segmentation of arbitrary large images (here segmentation of neuronal structures in EM stacks). Prediction of the segmentation in the yellow area, requires image data within the blue area as input. Missing input data is extrapolated by mirroring
图 2:用于任意大图像无缝分割的重叠平铺策略(此处是 EM 堆栈中神经元结构的分割)。 黄色区域分割的预测需要蓝色区域内的图像数据作为输入。 通过镜像推断丢失的输入数据
As for our tasks there is very little training data available, we use excessive data augmentation by applying elastic deformations to the available training images. This allows the network to learn invariance to such deformations, without the need to see these transformations in the annotated image corpus. This is particularly important in biomedical segmentation, since deformation used to be the most common variation in tissue and realistic deformations can be simulated efficiently. The value of data augmentation for learning invariance has been shown in Dosovitskiy et al. [2] in the scope of unsupervised feature learning.
至于我们的任务,可用的训练数据非常少,我们通过对可用的训练图像应用弹性变形来使用过多的数据增强。 这使得网络能够学习此类变形的不变性,而无需在带注释的图像语料库中查看这些变换。 这在生物医学分割中尤其重要,因为变形曾经是组织中最常见的变化,并且可以有效地模拟真实的变形。 Dosovitskiy 等人已经证明了数据增强对于学习不变性的价值。 [2]在无监督特征学习的范围内。
Another challenge in many cell segmentation tasks is the separation of touching objects of the same class; see Figure 3. To this end, we propose the use of a weighted loss, where the separating background labels between touching cells obtain a large weight in the loss function.
许多细胞分割任务中的另一个挑战是同一类触摸对象的分离; 参见图 3。为此,我们建议使用加权损失,其中接触细胞之间的分离背景标签在损失函数中获得较大的权重。
The resulting network is applicable to various biomedical segmentation problems. In this paper, we show results on the segmentation of neuronal structures in EM stacks (an ongoing competition started at ISBI 2012), where we outperformed the network of Ciresan et al. [1]. Furthermore, we show results for cell segmentation in light microscopy images from the ISBI cell tracking challenge 2015. Here we won with a large margin on the two most challenging 2D transmitted light datasets.
由此产生的网络适用于各种生物医学分割问题。 在本文中,我们展示了 EM 堆栈中神经元结构的分割结果(ISBI 2012 上开始的一项持续竞赛),我们的表现优于 Ciresan 等人的网络。 [1]。 此外,我们还展示了 2015 年 ISBI 细胞追踪挑战赛中光学显微镜图像中细胞分割的结果。在这里,我们在两个最具挑战性的 2D 透射光数据集上以大幅优势获胜。
2 Network Architecture
2 网络架构
The network architecture is illustrated in Figure 1. It consists of a contracting path (left side) and an expansive path (right side). The contracting path follows the typical architecture of a convolutional network. It consists of the repeated application of two 3x3 convolutions (unpadded convolutions), each followed by a rectified linear unit (ReLU) and a 2x2 max pooling operation with stride 2 for downsampling. At each downsampling step we double the number of feature channels. Every step in the expansive path consists of an upsampling of the feature map followed by a 2x2 convolution (“up-convolution”) that halves the number of feature channels, a concatenation with the correspondingly cropped feature map from the contracting path, and two 3x3 convolutions, each followed by a ReLU. The cropping is necessary due to the loss of border pixels in every convolution. At the final layer a 1x1 convolution is used to map each 64-component feature vector to the desired number of classes. In total the network has 23 convolutional layers.
网络架构如图 1 所示。它由收缩路径(左侧)与扩张路径(右侧)组成。收缩路径遵循典型的卷积网络结构:反复应用两个 3×3 卷积(无填充),每次卷积后接一个 ReLU,再接一个用于下采样的 2×2 最大池化(步长 2)。每一步下采样,特征通道数翻倍。扩张路径中的每一步先对特征图做上采样,接着接一个把通道数减半的 2×2 卷积(“上卷积”),再与收缩路径中对应裁剪后的特征图拼接,然后是两个 3×3 卷积,每个后接 ReLU。裁剪是必需的,因为每次卷积都会丢失边界像素。最后一层用 1×1 卷积把每个 64 维特征向量映射到所需的类别数。网络共有 23 个卷积层。
To allow a seamless tiling of the output segmentation map (see Figure 2), it is important to select the input tile size such that all 2x2 max-pooling operations are applied to a layer with an even x- and y-size.
为了使输出分割图能够无缝平铺(见图 2),选择输入 tile 尺寸时必须保证所有 2×2 最大池化都作用在 x、y 边长为偶数的层上。
3 Training
3 训练
The input images and their corresponding segmentation maps are used to train the network with the stochastic gradient descent implementation of Caffe [6]. Due to the unpadded convolutions, the output image is smaller than the input by a constant border width. To minimize the overhead and make maximum use of the GPU memory, we favor large input tiles over a large batch size and hence reduce the batch to a single image. Accordingly we use a high momentum (0.99) such that a large number of the previously seen training samples determine the update in the current optimization step.
输入图像及其相应的分割图用于通过 Caffe [6] 的随机梯度下降实现来训练网络。 由于未填充的卷积,输出图像比输入小恒定的边框宽度。 为了最大限度地减少开销并最大限度地利用 GPU 内存,我们更喜欢大输入图块而不是大批量大小,从而将批量减少为单个图像。 因此,我们使用高动量(0.99),以便大量先前看到的训练样本决定当前优化步骤中的更新。
The energy function is computed by a pixel-wise soft-max over the final feature map combined with the cross entropy loss function. The soft-max is defined as where denotes the activation in feature channel at the pixel position with . is the number of classes and is the approximated maximum-function. I.e. for the that has the maximum activation and for all other . The cross entropy then penalizes at each position the deviation of from 1 using
能量函数由最终特征图上的逐像素 soft-max 与交叉熵损失组合得到。soft-max 定义为 ,其中 表示像素位置 ()上特征通道 的激活, 为类别数, 近似最大函数。亦即对激活最大的那个 ,,其余 上 。交叉熵则在每个位置惩罚 相对 1 的偏离:
where is the true label of each pixel and is a weight map that we introduced to give some pixels more importance in the training.
其中是每个像素的真实标签, 是我们引入的权重图,以便在训练中赋予某些像素更多的重要性。
We pre-compute the weight map for each ground truth segmentation to compensate the different frequency of pixels from a certain class in the training data set, and to force the network to learn the small separation borders that we introduce between touching cells (See Figure 3c and d).
我们预先计算每个真值标注分割的权重图,以补偿训练数据集中某个类别的像素的不同频率,并迫使网络学习我们在接触单元之间引入的小分离边界(见图 3c 和 d)。
a b c d
Figure 3: HeLa cells on glass recorded with DIC (differential interference contrast) microscopy. (a) raw image. (b) overlay with ground truth segmentation. Different colors indicate different instances of the HeLa cells. (c) generated segmentation mask (white: foreground, black: background). (d) map with a pixel-wise loss weight to force the network to learn the border pixels.
a b c d
图 3:用 DIC(微分干涉对比)显微镜记录玻璃上的 HeLa 细胞。 (a) 原始图像。 (b) 与真值标注分割重叠。 不同的颜色表示 HeLa 细胞的不同实例。 (c) 生成分割掩模(白色:前景,黑色:背景)。 (d) 具有逐像素损失权重的映射,以强制网络学习边界像素。
The separation border is computed using morphological operations. The weight map is then computed as
分离边界是使用形态学运算计算的。 然后权重图计算为
where is the weight map to balance the class frequencies, denotes the distance to the border of the nearest cell and the distance to the border of the second nearest cell. In our experiments we set and pixels.
其中是平衡类别频率的权重图, 表示到最近单元格边界的距离, 表示到第二个最近单元格边界的距离。 在我们的实验中,我们设置了和像素。
In deep networks with many convolutional layers and different paths through the network, a good initialization of the weights is extremely important. Otherwise, parts of the network might give excessive activations, while other parts never contribute. Ideally the initial weights should be adapted such that each feature map in the network has approximately unit variance. For a network with our architecture (alternating convolution and ReLU layers) this can be achieved by drawing the initial weights from a Gaussian distribution with a standard deviation of , where denotes the number of incoming nodes of one neuron [5]. E.g. for a 3x3 convolution and 64 feature channels in the previous layer .
在具有许多卷积层和不同网络路径的深层网络中,权重的良好初始化极其重要。 否则,网络的某些部分可能会产生过度的激活,而其他部分则永远不会做出贡献。 理想情况下,应调整初始权重,以使网络中的每个特征图具有大约单位方差。 对于采用我们的架构(交替卷积层和 ReLU 层)的网络,可以通过从标准差为的高斯分布中提取初始权重来实现,其中表示一个神经元的传入节点数量 [5]。 例如。 对于前一层中的 3x3 卷积和 64 个特征通道。
3.1 Data Augmentation
3.1 数据增强
Data augmentation is essential to teach the network the desired invariance and robustness properties, when only few training samples are available. In case of microscopical images we primarily need shift and rotation invariance as well as robustness to deformations and gray value variations. Especially random elastic deformations of the training samples seem to be the key concept to train a segmentation network with very few annotated images. We generate smooth deformations using random displacement vectors on a coarse 3 by 3 grid. The displacements are sampled from a Gaussian distribution with 10 pixels standard deviation. Per-pixel displacements are then computed using bicubic interpolation. Drop-out layers at the end of the contracting path perform further implicit data augmentation.
当标注样本很少时,数据增强对教会网络所需的不变性与鲁棒性至关重要。对显微图像,我们主要需要平移与旋转不变性,以及对形变和灰度变化的鲁棒性。尤其是训练样本上的随机弹性形变,似乎是用极少标注图像训练分割网络的关键。我们在粗糙的 3×3 网格上用随机位移向量生成平滑形变;位移从标准差 10 像素的高斯分布采样,再经双三次插值得到逐像素位移。收缩路径末端的 Dropout 层还提供进一步的隐式数据增强。
4 Experiments
4 实验
We demonstrate the application of the u-net to three different segmentation tasks. The first task is the segmentation of neuronal structures in electron microscopic recordings. An example of the data set and our obtained segmentation is displayed in Figure 2. We provide the full result as Supplementary Material. The data set is provided by the EM segmentation challenge [14] that was started at ISBI 2012 and is still open for new contributions. The training data is a set of 30 images (512x512 pixels) from serial section transmission electron microscopy of the Drosophila first instar larva ventral nerve cord (VNC). Each image comes with a corresponding fully annotated ground truth segmentation map for cells (white) and membranes (black). The test set is publicly available, but its segmentation maps are kept secret. An evaluation can be obtained by sending the predicted membrane probability map to the organizers. The evaluation is done by thresholding the map at 10 different levels and computation of the “warping error”, the “Rand error” and the “pixel error” [14].
我们演示了 u-net 在三种不同分割任务中的应用。 第一项任务是电子显微镜记录中神经元结构的分割。 图 2 显示了数据集和我们获得的细分的示例。我们提供完整的结果作为补充材料。 该数据集由 EM 细分挑战赛 [14] 提供,该挑战赛于 ISBI 2012 年启动,目前仍在接受新的贡献。 训练数据是一组 30 张图像(512x512 像素),来自果蝇一龄幼虫腹神经索 (VNC) 的串行切片透射电子显微镜图像。 每张图像都带有相应的完全注释的细胞(白色)和膜(黑色)的真值标注分割图。 测试集是公开的,但其分割图是保密的。 可以通过将预测的膜概率图发送给组织者来获得评估。 评估是通过在 10 个不同级别对地图进行阈值处理并计算“扭曲误差”、“Rand 误差”和“像素误差”[14] 来完成的。
The u-net (averaged over 7 rotated versions of the input data) achieves without any further pre- or postprocessing a warping error of 0.0003529 (the new best score, see Table 1) and a rand-error of 0.0382.
U-Net(对输入数据的 7 个旋转版本取平均)在不做任何额外前、后处理的情况下,达到 warping error 0.0003529(新的最佳分数,见表 1)以及 rand error 0.0382。
| Rank | Group name | Warping Error | Rand Error | Pixel Error |
|---|---|---|---|---|
| ** human values ** | 0.000005 | 0.0021 | 0.0010 | |
| 1. | u-net | 0.000353 | 0.0382 | 0.0611 |
| 2. | DIVE-SCI | 0.000355 | 0.0305 | 0.0584 |
| 3. | IDSIA [1] | 0.000420 | 0.0504 | 0.0613 |
| 4. | DIVE | 0.000430 | 0.0545 | 0.0582 |
| 10. | IDSIA-SCI | 0.000653 | 0.0189 | 0.1027 |
Table 1: Ranking on the EM segmentation challenge [14] (march 6th, 2015), sorted by warping error.
| 排名 | 团队名称 | Warping 误差 | Rand 误差 | 像素误差 |
|---|---|---|---|---|
| 人类水平 | 0.000005 | 0.0021 | 0.0010 | |
| 1. | u-net | 0.000353 | 0.0382 | 0.0611 |
| 2. | DIVE-SCI | 0.000355 | 0.0305 | 0.0584 |
| 3. | IDSIA [1] | 0.000420 | 0.0504 | 0.0613 |
| 4. | DIVE | 0.000430 | 0.0545 | 0.0582 |
| 10. | IDSIA-SCI | 0.000653 | 0.0189 | 0.1027 |
表 1:EM 分割挑战排行榜[14](2015 年 3 月 6 日),按 warping error 排序。
This is significantly better than the sliding-window convolutional network result by Ciresan et al. [1], whose best submission had a warping error of 0.000420 and a rand error of 0.0504. In terms of rand error the only better performing algorithms on this data set use highly data set specific post-processing methods[^1] applied to the probability map of Ciresan et al. [1].
这显著好于 Ciresan 等人[1]的滑动窗口卷积网络结果,其最佳提交的 warping error 为 0.000420、rand error 为 0.0504。就 rand error 而言,该数据集上仅有的更好算法,是对 Ciresan 等人[1]的概率图施加高度数据集相关的后处理方法[^1]。
We also applied the u-net to a cell segmentation task in light microscopic images. This segmenation task is part of the ISBI cell tracking challenge 2014 and 2015 [10, 13]. The first data set ‘‘PhC-U373’’[^2] contains Glioblastoma-astrocytoma U373 cells on a polyacrylimide substrate recorded by phase contrast microscopy (see Figure 4a,b and Supp. Material). It contains 35 partially annotated training images.
我们还将 u-net 应用于光显微图像中的细胞分割任务。 此分割任务是 2014 年和 2015 年 ISBI 细胞跟踪挑战赛的一部分 [10, 13]。 第一个数据集“PhC-U373”[^2] 包含通过相差显微镜记录的聚丙烯酰亚胺基质上的胶质母细胞瘤-星形细胞瘤 U373 细胞(参见图 4a、b 和补充材料)。 它包含 35 个部分注释的训练图像。
a b c d
Figure 4: Result on the ISBI cell tracking challenge. (a) part of an input image of the “PhC-U373” data set. (b) Segmentation result (cyan mask) with manual ground truth (yellow border) (c) input image of the “DIC-HeLa” data set. (d) Segmentation result (random colored masks) with manual ground truth (yellow border).
a b c d
图 4:ISBI 细胞跟踪挑战结果。(a)「PhC-U373」数据集输入图像的一部分。(b)分割结果(青色掩膜)与人工真值标注(黄边)。(c)「DIC-HeLa」数据集输入图像。(d)分割结果(随机着色掩膜)与人工真值标注(黄边)。
Here we achieve an average IOU (“intersection over union”) of 92%, which is significantly better than the second best algorithm with 83% (see Table 2).
这里我们达到平均 IoU(交并比)92%,显著好于第二名算法的 83%(见表 2)。
| Name | PhC-U373 | DIC-HeLa |
|---|---|---|
| IMCB-SG (2014) | 0.2669 | 0.2935 |
| KTH-SE (2014) | 0.7953 | 0.4607 |
| HOUS-US (2014) | 0.5323 | - |
| second-best 2015 | 0.83 | 0.46 |
| u-net (2015) | 0.9203 | 0.7756 |
Table 2: Segmentation results (IOU) on the ISBI cell tracking challenge 2015.
| 名称 | PhC-U373 | DIC-HeLa |
|---|---|---|
| IMCB-SG (2014) | 0.2669 | 0.2935 |
| KTH-SE (2014) | 0.7953 | 0.4607 |
| HOUS-US (2014) | 0.5323 | - |
| 2015 年第二名 | 0.83 | 0.46 |
| u-net (2015) | 0.9203 | 0.7756 |
表 2:2015 年 ISBI 细胞跟踪挑战的分割结果(IoU)。
The second data set ‘‘DIC-HeLa’’[^3] are HeLa cells on a flat glass recorded by differential interference contrast (DIC) microscopy (see Figure 3, Figure 4c,d and Supp. Material). It contains 20 partially annotated training images. Here we achieve an average IOU of 77.5% which is significantly better than the second best algorithm with 46%.
第二个数据集「DIC-HeLa」[^3] 是用微分干涉衬度(DIC)显微镜拍摄的平板玻璃上的 HeLa 细胞(见图 3、图 4c,d 与补充材料)。它包含 20 张部分标注的训练图像。这里我们达到平均 IoU 77.5%,显著好于第二名算法的 46%。
5 Conclusion
5 结论
The u-net architecture achieves very good performance on very different biomedical segmentation applications. Thanks to data augmentation with elastic deformations, it only needs very few annotated images and has a very reasonable training time of only 10 hours on a NVidia Titan GPU (6 GB). We provide the full Caffe[6]-based implementation and the trained networks[^4]. We are sure that the u-net architecture can be applied easily to many more tasks.
u-net 架构在非常不同的生物医学分割应用中实现了非常好的性能。 由于具有弹性变形的数据增强,它只需要很少的注释图像,并且在 NVidia Titan GPU (6 GB) 上的训练时间非常合理,仅为 10 小时。 我们提供完整的基于 Caffe[6] 的实现和经过训练的网络[^4]。 我们确信 u-net 架构可以轻松应用于更多任务。
Acknowlegements
致谢
This study was supported by the Excellence Initiative of the German Federal and State governments (EXC 294) and by the BMBF (Fkz 0316185B).
这项研究得到了德国联邦和州政府卓越计划 (EXC 294) 和 BMBF (Fkz 0316185B) 的支持。
References
参考文献
[1] Ciresan, D.C., Gambardella, L.M., Giusti, A., Schmidhuber, J.: Deep neural networks segment neuronal membranes in electron microscopy images. In: NIPS. pp. 2852–2860 (2012)
[2] Dosovitskiy, A., Springenberg, J.T., Riedmiller, M., Brox, T.: Discriminative unsupervised feature learning with convolutional neural networks. In: NIPS (2014)
[3] Girshick, R., Donahue, J., Darrell, T., Malik, J.: Rich feature hierarchies for accurate object detection and semantic segmentation. In: Proceedings of the IEEE Conference on Computer Vision and Pattern Recognition (CVPR) (2014)
[4] Hariharan, B., Arbeláez, P., Girshick, R., Malik, J.: Hypercolumns for object segmentation and fine-grained localization (2014), arXiv:1411.5752 [cs.CV]
[5] He, K., Zhang, X., Ren, S., Sun, J.: Delving deep into rectifiers: Surpassing human-level performance on imagenet classification (2015), arXiv:1502.01852 [cs.CV]
[6] Jia, Y., Shelhamer, E., Donahue, J., Karayev, S., Long, J., Girshick, R., Guadarrama, S., Darrell, T.: Caffe: Convolutional architecture for fast feature embedding (2014), arXiv:1408.5093 [cs.CV]
[7] Krizhevsky, A., Sutskever, I., Hinton, G.E.: Imagenet classification with deep convolutional neural networks. In: NIPS. pp. 1106–1114 (2012)
[8] LeCun, Y., Boser, B., Denker, J.S., Henderson, D., Howard, R.E., Hubbard, W., Jackel, L.D.: Backpropagation applied to handwritten zip code recognition. Neural Computation 1(4), 541–551 (1989)
[9] Long, J., Shelhamer, E., Darrell, T.: Fully convolutional networks for semantic segmentation (2014), arXiv:1411.4038 [cs.CV]
[10] Maska, M., (…), de Solorzano, C.O.: A benchmark for comparison of cell tracking algorithms. Bioinformatics 30, 1609–1617 (2014)
[11] Seyedhosseini, M., Sajjadi, M., Tasdizen, T.: Image segmentation with cascaded hierarchical models and logistic disjunctive normal networks. In: Computer Vision (ICCV), 2013 IEEE International Conference on. pp. 2168–2175 (2013)
[12] Simonyan, K., Zisserman, A.: Very deep convolutional networks for large-scale image recognition (2014), arXiv:1409.1556 [cs.CV]
[13] WWW: Web page of the cell tracking challenge, http://www.codesolorzano.com/celltrackingchallenge/Cell_Tracking_Challenge/Welcome.html
[14] WWW: Web page of the em segmentation challenge, http://brainiac2.mit.edu/isbi_challenge/