SSD: Single Shot MultiBox Detector
SSD: Single Shot MultiBox Detector
SSD:单次多框检测器
Wei Liu 1 Affiliation: wliu@cs.unc.edu, drago@zoox.com, {dumitru,szegedy}@google.com, reedscot@umich.edu, {cyfu,aberg}@cs.unc.edu Dragomir Anguelov 2 Dumitru Erhan 3 Christian Szegedy 3 Affiliation: UNC Chapel Hill Zoox Inc. Google Inc. University of Michigan, Ann-Arbor Scott Reed 4 Cheng-Yang Fu 1 Alexander C. Berg 1
Abstract
摘要
We present a method for detecting objects in images using a single deep neural network. Our approach, named SSD, discretizes the output space of bounding boxes into a set of default boxes over different aspect ratios and scales per feature map location. At prediction time, the network generates scores for the presence of each object category in each default box and produces adjustments to the box to better match the object shape. Additionally, the network combines predictions from multiple feature maps with different resolutions to naturally handle objects of various sizes. SSD is simple relative to methods that require object proposals because it completely eliminates proposal generation and subsequent pixel or feature resampling stages and encapsulates all computation in a single network. This makes SSD easy to train and straightforward to integrate into systems that require a detection component. Experimental results on the PASCAL VOC, COCO, and ILSVRC datasets confirm that SSD has competitive accuracy to methods that utilize an additional object proposal step and is much faster, while providing a unified framework for both training and inference. For input, SSD achieves 74.3% mAP[^1] on VOC2007 test at 59 FPS on a Nvidia Titan X and for input, SSD achieves 76.9% mAP, outperforming a comparable state-of-the-art Faster R-CNN model. Compared to other single stage methods, SSD has much better accuracy even with a smaller input image size. Code is available at: https://github.com/weiliu89/caffe/tree/ssd .
我们提出一种用单个深度神经网络检测图像中物体的方法。该方法名为 SSD:把边界框输出空间离散成一组默认框,覆盖每个特征图位置上不同纵横比与尺度。预测时,网络为每个默认框上各类别是否存在打分,并产出框的调整量以更好贴合物体形状。此外,网络融合来自不同分辨率多张特征图的预测,自然应对各种尺寸的物体。相对需要物体提案的方法,SSD 更简单:它完全去掉提案生成以及随后的像素或特征重采样阶段,把全部计算封装进单一网络。因此 SSD 易于训练,也便于集成到需要检测组件的系统中。在 PASCAL VOC、COCO 与 ILSVRC 上的实验表明,SSD 精度可与带额外物体提案步骤的方法竞争,且快得多,并为训练与推理提供统一框架。 输入时,SSD 在 VOC2007 test 上达到 74.3% mAP[^1],Nvidia Titan X 上 59 FPS; 输入达到 76.9% mAP,超过可比的当时前沿 Faster R-CNN。相对其他单阶段方法,即便输入更小,SSD 精度也明显更好。代码见:https://github.com/weiliu89/caffe/tree/ssd 。
1 Introduction
1 引言
Keywords:
Current state-of-the-art object detection systems are variants of the following approach: hypothesize bounding boxes, resample pixels or features for each box, and apply a high-quality classifier. This pipeline has prevailed on detection benchmarks since the Selective Search work [1] through the current leading results on PASCAL VOC, COCO, and ILSVRC detection all based on Faster R-CNN[2] albeit with deeper features such as [3]. While accurate, these approaches have been too computationally intensive for embedded systems and, even with high-end hardware, too slow for real-time applications. Often detection speed for these approaches is measured in seconds per frame (SPF), and even the fastest high-accuracy detector, Faster R-CNN, operates at only 7 frames per second (FPS). There have been many attempts to build faster detectors by attacking each stage of the detection pipeline (see related work in Sec. 4), but so far, significantly increased speed comes only at the cost of significantly decreased detection accuracy.
关键词:
当前前沿物体检测系统多是下列流程的变体:假设边界框,对每个框重采样像素或特征,再施以高质量分类器。自 Selective Search [1] 以来,这一管线主导检测基准;PASCAL VOC、COCO、ILSVRC 检测上的领先结果也多基于 Faster R-CNN[2],尽管特征更深如 [3]。准确归准确,这些方法对嵌入式系统算力过重,即便高端硬件对实时应用也偏慢。速度常以秒/帧(SPF)计,最快的高精度检测器 Faster R-CNN 也仅约 7 FPS。已有大量工作分别攻击管线各阶段以求加速(见第 4 节相关工作),但迄今显著加速往往伴随显著掉点。
This paper presents the first deep network based object detector that does not resample pixels or features for bounding box hypotheses and and is as accurate as approaches that do. This results in a significant improvement in speed for high-accuracy detection (59 FPS with mAP 74.3% on VOC2007 test, vs. Faster R-CNN 7 FPS with mAP 73.2% or YOLO 45 FPS with mAP 63.4%). The fundamental improvement in speed comes from eliminating bounding box proposals and the subsequent pixel or feature resampling stage. We are not the first to do this (cf [4, 5]), but by adding a series of improvements, we manage to increase the accuracy significantly over previous attempts. Our improvements include using a small convolutional filter to predict object categories and offsets in bounding box locations, using separate predictors (filters) for different aspect ratio detections, and applying these filters to multiple feature maps from the later stages of a network in order to perform detection at multiple scales. With these modifications—especially using multiple layers for prediction at different scales—we can achieve high-accuracy using relatively low resolution input, further increasing detection speed. While these contributions may seem small independently, we note that the resulting system improves accuracy on real-time detection for PASCAL VOC from 63.4% mAP for YOLO to 74.3% mAP for our SSD. This is a larger relative improvement in detection accuracy than that from the recent, very high-profile work on residual networks [3]. Furthermore, significantly improving the speed of high-quality detection can broaden the range of settings where computer vision is useful.
本文给出首个基于深度网络、不必为边界框假设重采样像素或特征、且精度不逊于会重采样方法的检测器。高精度检测速度因此显著提升(VOC2007 test 上 59 FPS、mAP 74.3%,对照 Faster R-CNN 7 FPS、mAP 73.2%,或 YOLO 45 FPS、mAP 63.4%)。速度提升的根本来自去掉边界框提案及其后的像素/特征重采样。我们并非首个这样做(参见 [4, 5]),但通过一系列改进,精度相对先前尝试明显提高。改进包括:用小卷积滤波器预测物体类别与框位置偏移;为不同纵横比检测使用独立预测器(滤波器);把这些滤波器施加到网络后期多张特征图上,以多尺度检测。有了这些改动——尤其用多层做不同尺度预测——可用相对较低分辨率输入达到高精度,从而进一步提速。单项贡献看似不大,但合成系统把 PASCAL VOC 实时检测精度从 YOLO 的 63.4% mAP 提到 SSD 的 74.3% mAP;这一相对提升甚至大于当时备受瞩目的残差网络工作 [3]。显著加快高质量检测,也能拓宽计算机视觉可用的场景。
We summarize our contributions as follows:
贡献概括如下:
- • We introduce SSD, a single-shot detector for multiple categories that is faster than the previous state-of-the-art for single shot detectors (YOLO), and significantly more accurate, in fact as accurate as slower techniques that perform explicit region proposals and pooling (including Faster R-CNN).
- • 我们提出 SSD:面向多类别的单次检测器,快于先前单次检测前沿(YOLO),且精度显著更高,实际上可与做显式区域提案与池化的较慢技术(含 Faster R-CNN)比肩。
- • The core of SSD is predicting category scores and box offsets for a fixed set of default bounding boxes using small convolutional filters applied to feature maps.
- • SSD 的核心是:用施加在特征图上的小卷积滤波器,为一组固定默认边界框预测类别分数与框偏移。
- • To achieve high detection accuracy we produce predictions of different scales from feature maps of different scales, and explicitly separate predictions by aspect ratio.
- • 为达高检测精度,我们从不同尺度的特征图产出不同尺度的预测,并按纵横比显式分开预测。
- • These design features lead to simple end-to-end training and high accuracy, even on low resolution input images, further improving the speed vs accuracy trade-off.
- • 这些设计带来简单的端到端训练与高精度,即便输入分辨率较低,也能进一步改善速度–精度权衡。
- • Experiments include timing and accuracy analysis on models with varying input size evaluated on PASCAL VOC, COCO, and ILSVRC and are compared to a range of recent state-of-the-art approaches.
- • 实验包括不同输入尺寸模型在 PASCAL VOC、COCO、ILSVRC 上的计时与精度分析,并与一系列近期前沿方法对比。
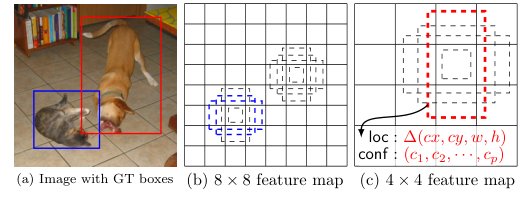
Figure 1: SSD framework. (a) SSD only needs an input image and ground truth boxes for each object during training. In a convolutional fashion, we evaluate a small set (e.g. 4) of default boxes of different aspect ratios at each location in several feature maps with different scales (e.g. and in (b) and (c)). For each default box, we predict both the shape offsets and the confidences for all object categories (). At training time, we first match these default boxes to the ground truth boxes. For example, we have matched two default boxes with the cat and one with the dog, which are treated as positives and the rest as negatives. The model loss is a weighted sum between localization loss (e.g. Smooth L1 [6]) and confidence loss (e.g. Softmax).
图 1:SSD 框架。(a) 训练时 SSD 只需输入图像与每个物体的真值框。以卷积方式,我们在若干不同尺度特征图的每个位置评估一小套(如 4 个)不同纵横比的默认框(例如 (b)(c) 中的 与 )。对每个默认框,我们既预测形状偏移,也预测所有物体类别的置信度 ()。训练时先把这些默认框与真值框匹配。例如,有两个默认框匹配到猫、一个匹配到狗,它们视为正样本,其余为负样本。模型损失是定位损失(如 Smooth L1 [6])与置信损失(如 Softmax)的加权和。
2 The Single Shot Detector (SSD)
2 单次检测器(SSD)
This section describes our proposed SSD framework for detection (Sec. 2.1) and the associated training methodology (Sec. 2.2). Afterwards, Sec. 3 presents dataset-specific model details and experimental results.
本节描述所提 SSD 检测框架(第 2.1 节)及相关训练方法(第 2.2 节)。随后第 3 节给出数据集相关的模型细节与实验结果。
2.1 Model
2.1 模型
The SSD approach is based on a feed-forward convolutional network that produces a fixed-size collection of bounding boxes and scores for the presence of object class instances in those boxes, followed by a non-maximum suppression step to produce the final detections. The early network layers are based on a standard architecture used for high quality image classification (truncated before any classification layers), which we will call the base network[^2]. We then add auxiliary structure to the network to produce detections with the following key features:
SSD 基于前馈卷积网络:产出固定规模的边界框集合以及这些框中各类物体实例是否存在的分数,再经非极大值抑制得到最终检测。网络前部基于用于高质量图像分类的标准架构(在分类层之前截断),我们称之为基网络[^2]。随后加入辅助结构以产生检测,关键特征如下:
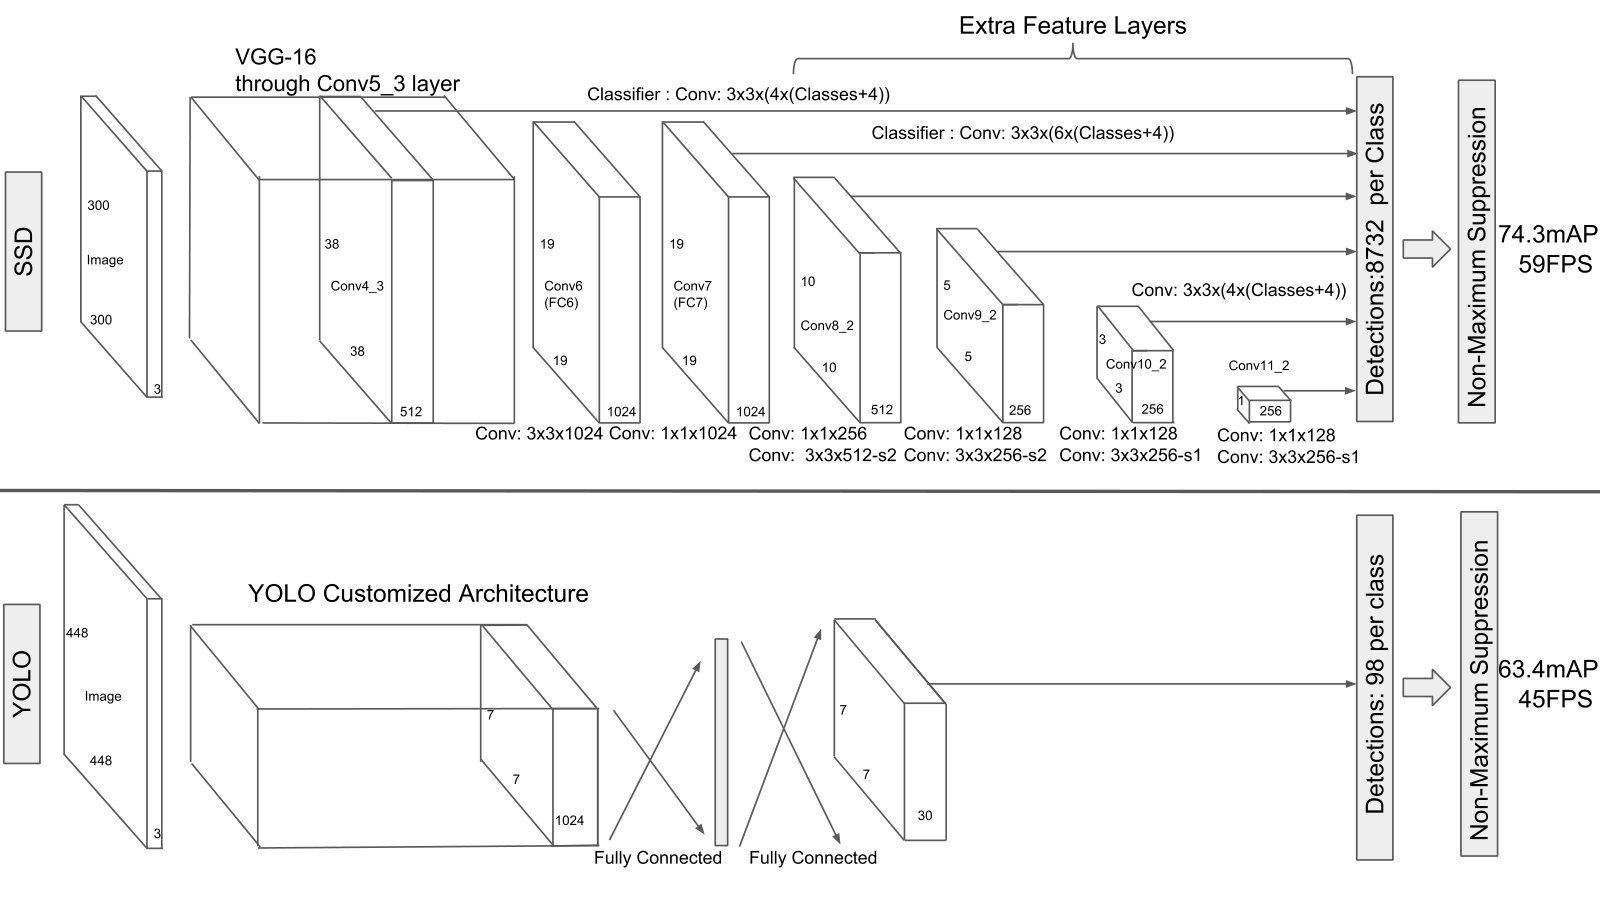
Figure 2: A comparison between two single shot detection models: SSD and YOLO [5]. Our SSD model adds several feature layers to the end of a base network, which predict the offsets to default boxes of different scales and aspect ratios and their associated confidences. SSD with a input size significantly outperforms its YOLO counterpart in accuracy on VOC2007 test while also improving the speed.
图 2:两种单次检测模型对比:SSD 与 YOLO [5]。我们的 SSD 在基网络末端加入若干特征层,预测不同尺度与纵横比默认框的偏移及其置信度。 输入的 SSD 在 VOC2007 test 精度上显著超过 的 YOLO,同时速度也更好。
Multi-scale feature maps for detection We add convolutional feature layers to the end of the truncated base network. These layers decrease in size progressively and allow predictions of detections at multiple scales. The convolutional model for predicting detections is different for each feature layer (cf Overfeat[4] and YOLO[5] that operate on a single scale feature map).
多尺度特征图用于检测 我们在截断基网络末端加入卷积特征层。这些层尺寸逐步减小,允许在多尺度上预测检测。每一特征层的卷积预测模型不同(对照 Overfeat[4] 与 YOLO[5] 只在单一尺度特征图上操作)。
Convolutional predictors for detection Each added feature layer (or optionally an existing feature layer from the base network) can produce a fixed set of detection predictions using a set of convolutional filters. These are indicated on top of the SSD network architecture in Fig. 2. For a feature layer of size with channels, the basic element for predicting parameters of a potential detection is a small kernel that produces either a score for a category, or a shape offset relative to the default box coordinates. At each of the locations where the kernel is applied, it produces an output value. The bounding box offset output values are measured relative to a default box position relative to each feature map location (cf the architecture of YOLO[5] that uses an intermediate fully connected layer instead of a convolutional filter for this step).
卷积预测器用于检测 每个新增特征层(或可选地,基网络中已有特征层)可用一组卷积滤波器产出固定套检测预测。图 2 顶部示意了这些预测。对尺寸 、通道 的特征层,预测潜在检测参数的基本单元是 小核,产出某类别分数,或相对默认框坐标的形状偏移。核在 每个位置施用,各产生一个输出值。边界框偏移相对每个特征图位置上的默认框位置度量(对照 YOLO[5] 用中间全连接层而非卷积滤波完成此步)。
Default boxes and aspect ratios We associate a set of default bounding boxes with each feature map cell, for multiple feature maps at the top of the network. The default boxes tile the feature map in a convolutional manner, so that the position of each box relative to its corresponding cell is fixed. At each feature map cell, we predict the offsets relative to the default box shapes in the cell, as well as the per-class scores that indicate the presence of a class instance in each of those boxes. Specifically, for each box out of at a given location, we compute class scores and the offsets relative to the original default box shape. This results in a total of filters that are applied around each location in the feature map, yielding outputs for a feature map. For an illustration of default boxes, please refer to Fig. 1. Our default boxes are similar to the anchor boxes used in Faster R-CNN [2], however we apply them to several feature maps of different resolutions. Allowing different default box shapes in several feature maps let us efficiently discretize the space of possible output box shapes.
默认框与纵横比 我们为网络顶部多张特征图的每个特征图单元关联一组默认边界框。默认框以卷积方式铺满特征图,各框相对其对应单元的位置固定。在每个特征图单元,我们预测相对该单元内默认框形状的偏移,以及指示各类实例是否落在这些框中的逐类分数。具体地,给定位置上 个框中的每一个,计算 个类别分数与相对原始默认框形状的 个偏移。于是每个特征图位置周围共施加 个滤波器,对 特征图产出 个输出。默认框示意见图 1。我们的默认框类似 Faster R-CNN [2] 的锚框,但施加到多张不同分辨率特征图上。在多张特征图上允许不同默认框形状,可高效离散可能的输出框形状空间。
2.2 Training
2.2 训练
The key difference between training SSD and training a typical detector that uses region proposals, is that ground truth information needs to be assigned to specific outputs in the fixed set of detector outputs. Some version of this is also required for training in YOLO[5] and for the region proposal stage of Faster R-CNN[2] and MultiBox[7]. Once this assignment is determined, the loss function and back propagation are applied end-to-end. Training also involves choosing the set of default boxes and scales for detection as well as the hard negative mining and data augmentation strategies.
训练 SSD 与训练典型基于区域提案的检测器的关键差别在于:必须把真值信息指派到固定检测器输出集合中的特定输出。YOLO[5] 训练以及 Faster R-CNN[2]、MultiBox[7] 的区域提案阶段也需要某种形式的指派。一旦指派确定,损失函数与反向传播端到端进行。训练还包括选择用于检测的默认框集合与尺度,以及难负挖掘与数据增强策略。
Matching strategy
During training we need to determine which default boxes correspond to a ground truth detection and train the network accordingly. For each ground truth box we are selecting from default boxes that vary over location, aspect ratio, and scale. We begin by matching each ground truth box to the default box with the best jaccard overlap (as in MultiBox [7]). Unlike MultiBox, we then match default boxes to any ground truth with jaccard overlap higher than a threshold (0.5). This simplifies the learning problem, allowing the network to predict high scores for multiple overlapping default boxes rather than requiring it to pick only the one with maximum overlap.
匹配策略
训练时需确定哪些默认框对应真值检测并据此训练网络。对每个真值框,我们从位置、纵横比、尺度各异的默认框中选择。先把每个真值框匹配到 Jaccard 重叠最好的默认框(如 MultiBox [7])。与 MultiBox 不同,我们再把默认框匹配到任何 Jaccard 重叠高于阈值(0.5)的真值。这简化了学习问题,允许网络对多个重叠默认框给出高分,而不必只挑最大重叠的那一个。
Training objective
The SSD training objective is derived from the MultiBox objective [7, 8] but is extended to handle multiple object categories. Let be an indicator for matching the -th default box to the -th ground truth box of category . In the matching strategy above, we can have . The overall objective loss function is a weighted sum of the localization loss (loc) and the confidence loss (conf):
训练目标
SSD 训练目标源自 MultiBox 目标 [7, 8],并扩展到处理多物体类别。令 表示第 个默认框是否匹配到类别 的第 个真值框。在上述匹配策略下,可有 。总体目标损失函数是定位损失(loc)与置信损失(conf)的加权和:
where N is the number of matched default boxes. If , wet set the loss to 0. The localization loss is a Smooth L1 loss [6] between the predicted box () and the ground truth box () parameters. Similar to Faster R-CNN [2], we regress to offsets for the center () of the default bounding box () and for its width () and height ().
其中 为匹配到的默认框数。若 ,将损失置 0。定位损失是预测框 () 与真值框 () 参数之间的 Smooth L1 损失 [6]。类似 Faster R-CNN [2],我们回归默认边界框 () 中心 () 以及宽 ()、高 () 的偏移。
$$\begin{split}L_{loc}(x,l,g)=\sum_{i\in Pos}^{N}\sum_{m\in{cx,cy,w,h}}&x_{ij}^{k}\text{smooth}{\text{L1}}(l{i}^{m}-\hat{g}{j}^{m})\
\hat{g}{j}^{cx}=(g_{j}^{cx}-d_{i}^{cx})/d_{i}^{w}\quad\quad&\hat{g}{j}^{cy}=(g{j}^{cy}-d_{i}^{cy})/d_{i}^{h}\
\hat{g}{j}^{w}=\log\Big(\frac{g{j}^{w}}{d_{i}^{w}}\Big)\quad\quad&\hat{g}{j}^{h}=\log\Big(\frac{g{j}^{h}}{d_{i}^{h}}\Big)\end{split} \tag{2}$$
The confidence loss is the softmax loss over multiple classes confidences ().
置信损失是多类置信度 () 上的 softmax 损失。
and the weight term is set to 1 by cross validation.
权重项 由交叉验证设为 1。
Choosing scales and aspect ratios for default boxes
To handle different object scales, some methods [4, 9] suggest processing the image at different sizes and combining the results afterwards. However, by utilizing feature maps from several different layers in a single network for prediction we can mimic the same effect, while also sharing parameters across all object scales. Previous works [10, 11] have shown that using feature maps from the lower layers can improve semantic segmentation quality because the lower layers capture more fine details of the input objects. Similarly, [12] showed that adding global context pooled from a feature map can help smooth the segmentation results. Motivated by these methods, we use both the lower and upper feature maps for detection. Figure 1 shows two exemplar feature maps ( and ) which are used in the framework. In practice, we can use many more with small computational overhead.
为默认框选择尺度与纵横比
为应对不同物体尺度,有些方法 [4, 9] 建议以不同尺寸处理图像再合并结果。但利用单网络中若干不同层的特征图做预测,可模拟相同效果,同时在所有物体尺度间共享参数。先前工作 [10, 11] 表明用较低层特征图可改善语义分割质量,因较低层捕获输入物体更多细节。类似地,[12] 表明从特征图池化的全局上下文有助于平滑分割结果。受此启发,我们同时用较低与较高特征图做检测。图 1 给出框架中使用的两张示例特征图( 与 )。实践中可用更多层,额外计算开销很小。
Feature maps from different levels within a network are known to have different (empirical) receptive field sizes [13]. Fortunately, within the SSD framework, the default boxes do not necessary need to correspond to the actual receptive fields of each layer. We design the tiling of default boxes so that specific feature maps learn to be responsive to particular scales of the objects. Suppose we want to use feature maps for prediction. The scale of the default boxes for each feature map is computed as:
网络内不同层特征图具有不同(经验)感受野大小 [13]。好在 SSD 框架中,默认框不必对应各层的实际感受野。我们设计默认框铺排,使特定特征图学会响应特定尺度的物体。设要用 张特征图做预测。每张特征图上默认框尺度计算为:
where is 0.2 and is 0.9, meaning the lowest layer has a scale of 0.2 and the highest layer has a scale of 0.9, and all layers in between are regularly spaced. We impose different aspect ratios for the default boxes, and denote them as . We can compute the width () and height () for each default box. For the aspect ratio of 1, we also add a default box whose scale is , resulting in 6 default boxes per feature map location. We set the center of each default box to , where is the size of the -th square feature map, . In practice, one can also design a distribution of default boxes to best fit a specific dataset. How to design the optimal tiling is an open question as well.
其中 为 0.2、 为 0.9,即最低层尺度 0.2、最高层 0.9,中间层等距排布。我们为默认框施加不同纵横比,记 。每个默认框宽 ()、高 ()。对纵横比 1,再加一个尺度为 的默认框,于是每个特征图位置 6 个默认框。每个默认框中心设为 ,其中 为第 张方形特征图尺寸,。实践中也可设计默认框分布以更好贴合特定数据集;最优铺排如何设计仍是开放问题。
By combining predictions for all default boxes with different scales and aspect ratios from all locations of many feature maps, we have a diverse set of predictions, covering various input object sizes and shapes. For example, in Fig. 1, the dog is matched to a default box in the feature map, but not to any default boxes in the feature map. This is because those boxes have different scales and do not match the dog box, and therefore are considered as negatives during training.
把来自多张特征图所有位置、不同尺度与纵横比的全部默认框预测合在一起,我们得到覆盖各种输入物体尺寸与形状的多样化预测。例如图 1 中,狗匹配到 特征图上的默认框,而不匹配 上的任何默认框,因为那些框尺度不同、与狗框不匹配,训练时视为负样本。
Hard negative mining
After the matching step, most of the default boxes are negatives, especially when the number of possible default boxes is large. This introduces a significant imbalance between the positive and negative training examples. Instead of using all the negative examples, we sort them using the highest confidence loss for each default box and pick the top ones so that the ratio between the negatives and positives is at most 3:1. We found that this leads to faster optimization and a more stable training.
难负挖掘
匹配之后,绝大多数默认框为负样本,尤其当可能默认框很多时。这造成正负训练样本显著失衡。我们不用全部负样本,而按每个默认框的最高置信损失排序,取顶部若干,使负正比至多 3:1。我们发现这带来更快优化与更稳定训练。
Data augmentation
To make the model more robust to various input object sizes and shapes, each training image is randomly sampled by one of the following options:
数据增强
为使模型对各种输入物体尺寸与形状更鲁棒,每张训练图像按下列选项之一随机采样:
- • Use the entire original input image.
- • 使用整张原始输入图像。
- • Sample a patch so that the minimum jaccard overlap with the objects is 0.1, 0.3, 0.5, 0.7, or 0.9.
- • 采样一块补丁,使其与物体的最小 Jaccard 重叠为 0.1、0.3、0.5、0.7 或 0.9。
- • Randomly sample a patch.
- • 随机采样一块补丁。
The size of each sampled patch is [0.1, 1] of the original image size, and the aspect ratio is between and 2. We keep the overlapped part of the ground truth box if the center of it is in the sampled patch. After the aforementioned sampling step, each sampled patch is resized to fixed size and is horizontally flipped with probability of 0.5, in addition to applying some photo-metric distortions similar to those described in [14].
每块采样补丁尺寸为原图的 [0.1, 1],纵横比在 与 2 之间。若真值框中心落在采样补丁内,则保留其重叠部分。上述采样后,各补丁缩放到固定尺寸,并以 0.5 概率水平翻转,另施加与 [14] 类似的光度畸变。
3 Experimental Results
3 实验结果
Base network
Our experiments are all based on VGG16 [15], which is pre-trained on the ILSVRC CLS-LOC dataset [16]. Similar to DeepLab-LargeFOV [17], we convert fc6 and fc7 to convolutional layers, subsample parameters from fc6 and fc7, change pool5 from to , and use the à trous algorithm [18] to fill the ”holes”. We remove all the dropout layers and the fc8 layer. We fine-tune the resulting model using SGD with initial learning rate , 0.9 momentum, 0.0005 weight decay, and batch size 32. The learning rate decay policy is slightly different for each dataset, and we will describe details later. The full training and testing code is built on Caffe [19] and is open source at: https://github.com/weiliu89/caffe/tree/ssd .
基网络
实验全部基于在 ILSVRC CLS-LOC 数据集 [16] 上预训练的 VGG16 [15]。类似 DeepLab-LargeFOV [17],我们将 fc6、fc7 转为卷积层,从 fc6、fc7 子采样参数,把 pool5 从 改为 ,并用 à trous 算法 [18] 填「空洞」。去掉全部 dropout 与 fc8。用 SGD 微调:初始学习率 、动量 0.9、权重衰减 0.0005、批大小 32。各数据集学习率衰减策略略有不同,后文详述。完整训练与测试代码基于 Caffe [19],开源见:https://github.com/weiliu89/caffe/tree/ssd 。
3.1 PASCAL VOC2007
On this dataset, we compare against Fast R-CNN [6] and Faster R-CNN [2] on VOC2007 test (4952 images). All methods fine-tune on the same pre-trained VGG16 network.
在该数据集上,我们在 VOC2007 test(4952 张图)与 Fast R-CNN [6]、Faster R-CNN [2] 对比。所有方法均在同一预训练 VGG16 上微调。
Figure 2 shows the architecture details of the SSD300 model. We use conv4_3, conv7 (fc7), conv8_2, conv9_2, conv10_2, and conv11_2 to predict both location and confidences. We set default box with scale 0.1 on conv4_3[^3]. We initialize the parameters for all the newly added convolutional layers with the ”xavier” method [20]. For conv4_3, conv10_2 and conv11_2, we only associate 4 default boxes at each feature map location – omitting aspect ratios of and 3. For all other layers, we put 6 default boxes as described in Sec. 2.2. Since, as pointed out in [12], conv4_3 has a different feature scale compared to the other layers, we use the L2 normalization technique introduced in [12] to scale the feature norm at each location in the feature map to 20 and learn the scale during back propagation. We use the learning rate for 40k iterations, then continue training for 10k iterations with and . When training on VOC2007 trainval, Table 1 shows that our low resolution SSD300 model is already more accurate than Fast R-CNN. When we train SSD on a larger input image, it is even more accurate, surpassing Faster R-CNN by 1.7% mAP. If we train SSD with more (i.e. 07+12) data, we see that SSD300 is already better than Faster R-CNN by 1.1% and that SSD512 is 3.6% better. If we take models trained on COCO trainval35k as described in Sec. 3.4 and fine-tuning them on the 07+12 dataset with SSD512, we achieve the best results: 81.6% mAP.
图 2 给出 SSD300 模型的架构细节。我们用 conv4_3、conv7(fc7)、conv8_2、conv9_2、conv10_2、conv11_2 同时预测位置与置信度。在 conv4_3 上把默认框尺度设为 0.1[^3]。所有新增卷积层参数用 "xavier" 方法 [20] 初始化。对 conv4_3、conv10_2、conv11_2,每个特征图位置只关联 4 个默认框——略去纵横比 与 3。其余层按第 2.2 节放 6 个默认框。由于 [12] 指出 conv4_3 特征尺度与其他层不同,我们用 [12] 引入的 L2 归一化,把特征图每个位置的特征范数缩放到 20,并在反向传播中学习该尺度。以 学习率训练 40k 迭代,再以 、 各继续 10k。在 VOC2007 trainval 上训练时,表 1 显示低分辨率 SSD300 已比 Fast R-CNN 更准。把输入扩到 时更准,超过 Faster R-CNN 1.7% mAP。若用更多数据(即 07+12)训练,SSD300 已比 Faster R-CNN 高 1.1%,SSD512 高 3.6%。若取第 3.4 节在 COCO trainval35k 上训练的模型,再用 SSD512 在 07+12 上微调,得到最佳结果:81.6% mAP。
| Method | data | mAP | aero | bike | bird | boat | bottle | bus | car | cat | chair | cow | table | dog | horse | mbike | person | plant | sheep | sofa | train | tv |
|---|---|---|---|---|---|---|---|---|---|---|---|---|---|---|---|---|---|---|---|---|---|---|
| Fast [6] | 07 | 66.9 | 74.5 | 78.3 | 69.2 | 53.2 | 36.6 | 77.3 | 78.2 | 82.0 | 40.7 | 72.7 | 67.9 | 79.6 | 79.2 | 73.0 | 69.0 | 30.1 | 65.4 | 70.2 | 75.8 | 65.8 |
| Fast [6] | 07+12 | 70.0 | 77.0 | 78.1 | 69.3 | 59.4 | 38.3 | 81.6 | 78.6 | 86.7 | 42.8 | 78.8 | 68.9 | 84.7 | 82.0 | 76.6 | 69.9 | 31.8 | 70.1 | 74.8 | 80.4 | 70.4 |
| Faster [2] | 07 | 69.9 | 70.0 | 80.6 | 70.1 | 57.3 | 49.9 | 78.2 | 80.4 | 82.0 | 52.2 | 75.3 | 67.2 | 80.3 | 79.8 | 75.0 | 76.3 | 39.1 | 68.3 | 67.3 | 81.1 | 67.6 |
| Faster [2] | 07+12 | 73.2 | 76.5 | 79.0 | 70.9 | 65.5 | 52.1 | 83.1 | 84.7 | 86.4 | 52.0 | 81.9 | 65.7 | 84.8 | 84.6 | 77.5 | 76.7 | 38.8 | 73.6 | 73.9 | 83.0 | 72.6 |
| Faster [2] | 07+12+COCO | 78.8 | 84.3 | 82.0 | 77.7 | 68.9 | 65.7 | 88.1 | 88.4 | 88.9 | 63.6 | 86.3 | 70.8 | 85.9 | 87.6 | 80.1 | 82.3 | 53.6 | 80.4 | 75.8 | 86.6 | 78.9 |
| SSD300 | 07 | 68.0 | 73.4 | 77.5 | 64.1 | 59.0 | 38.9 | 75.2 | 80.8 | 78.5 | 46.0 | 67.8 | 69.2 | 76.6 | 82.1 | 77.0 | 72.5 | 41.2 | 64.2 | 69.1 | 78.0 | 68.5 |
| SSD300 | 07+12 | 74.3 | 75.5 | 80.2 | 72.3 | 66.3 | 47.6 | 83.0 | 84.2 | 86.1 | 54.7 | 78.3 | 73.9 | 84.5 | 85.3 | 82.6 | 76.2 | 48.6 | 73.9 | 76.0 | 83.4 | 74.0 |
| SSD300 | 07+12+COCO | 79.6 | 80.9 | 86.3 | 79.0 | 76.2 | 57.6 | 87.3 | 88.2 | 88.6 | 60.5 | 85.4 | 76.7 | 87.5 | 89.2 | 84.5 | 81.4 | 55.0 | 81.9 | 81.5 | 85.9 | 78.9 |
| SSD512 | 07 | 71.6 | 75.1 | 81.4 | 69.8 | 60.8 | 46.3 | 82.6 | 84.7 | 84.1 | 48.5 | 75.0 | 67.4 | 82.3 | 83.9 | 79.4 | 76.6 | 44.9 | 69.9 | 69.1 | 78.1 | 71.8 |
| SSD512 | 07+12 | 76.8 | 82.4 | 84.7 | 78.4 | 73.8 | 53.2 | 86.2 | 87.5 | 86.0 | 57.8 | 83.1 | 70.2 | 84.9 | 85.2 | 83.9 | 79.7 | 50.3 | 77.9 | 73.9 | 82.5 | 75.3 |
| SSD512 | 07+12+COCO | 81.6 | 86.6 | 88.3 | 82.4 | 76.0 | 66.3 | 88.6 | 88.9 | 89.1 | 65.1 | 88.4 | 73.6 | 86.5 | 88.9 | 85.3 | 84.6 | 59.1 | 85.0 | 80.4 | 87.4 | 81.2 |
Table 1: PASCAL VOC2007 test detection results. Both Fast and Faster R-CNN use input images whose minimum dimension is 600. The two SSD models have exactly the same settings except that they have different input sizes ( vs. ). It is obvious that larger input size leads to better results, and more data always helps. Data: ”07”: VOC2007 trainval, ”07+12”: union of VOC2007 and VOC2012 trainval. ”07+12+COCO”: first train on COCO trainval35k then fine-tune on 07+12.
| Method | data | mAP | aero | bike | bird | boat | bottle | bus | car | cat | chair | cow | table | dog | horse | mbike | person | plant | sheep | sofa | train | tv |
|---|---|---|---|---|---|---|---|---|---|---|---|---|---|---|---|---|---|---|---|---|---|
| Fast [6] | 07 | 66.9 | 74.5 | 78.3 | 69.2 | 53.2 | 36.6 | 77.3 | 78.2 | 82.0 | 40.7 | 72.7 | 67.9 | 79.6 | 79.2 | 73.0 | 69.0 | 30.1 | 65.4 | 70.2 | 75.8 | 65.8 |
| Fast [6] | 07+12 | 70.0 | 77.0 | 78.1 | 69.3 | 59.4 | 38.3 | 81.6 | 78.6 | 86.7 | 42.8 | 78.8 | 68.9 | 84.7 | 82.0 | 76.6 | 69.9 | 31.8 | 70.1 | 74.8 | 80.4 | 70.4 |
| Faster [2] | 07 | 69.9 | 70.0 | 80.6 | 70.1 | 57.3 | 49.9 | 78.2 | 80.4 | 82.0 | 52.2 | 75.3 | 67.2 | 80.3 | 79.8 | 75.0 | 76.3 | 39.1 | 68.3 | 67.3 | 81.1 | 67.6 |
| Faster [2] | 07+12 | 73.2 | 76.5 | 79.0 | 70.9 | 65.5 | 52.1 | 83.1 | 84.7 | 86.4 | 52.0 | 81.9 | 65.7 | 84.8 | 84.6 | 77.5 | 76.7 | 38.8 | 73.6 | 73.9 | 83.0 | 72.6 |
| Faster [2] | 07+12+COCO | 78.8 | 84.3 | 82.0 | 77.7 | 68.9 | 65.7 | 88.1 | 88.4 | 88.9 | 63.6 | 86.3 | 70.8 | 85.9 | 87.6 | 80.1 | 82.3 | 53.6 | 80.4 | 75.8 | 86.6 | 78.9 |
| SSD300 | 07 | 68.0 | 73.4 | 77.5 | 64.1 | 59.0 | 38.9 | 75.2 | 80.8 | 78.5 | 46.0 | 67.8 | 69.2 | 76.6 | 82.1 | 77.0 | 72.5 | 41.2 | 64.2 | 69.1 | 78.0 | 68.5 |
| SSD300 | 07+12 | 74.3 | 75.5 | 80.2 | 72.3 | 66.3 | 47.6 | 83.0 | 84.2 | 86.1 | 54.7 | 78.3 | 73.9 | 84.5 | 85.3 | 82.6 | 76.2 | 48.6 | 73.9 | 76.0 | 83.4 | 74.0 |
| SSD300 | 07+12+COCO | 79.6 | 80.9 | 86.3 | 79.0 | 76.2 | 57.6 | 87.3 | 88.2 | 88.6 | 60.5 | 85.4 | 76.7 | 87.5 | 89.2 | 84.5 | 81.4 | 55.0 | 81.9 | 81.5 | 85.9 | 78.9 |
| SSD512 | 07 | 71.6 | 75.1 | 81.4 | 69.8 | 60.8 | 46.3 | 82.6 | 84.7 | 84.1 | 48.5 | 75.0 | 67.4 | 82.3 | 83.9 | 79.4 | 76.6 | 44.9 | 69.9 | 69.1 | 78.1 | 71.8 |
| SSD512 | 07+12 | 76.8 | 82.4 | 84.7 | 78.4 | 73.8 | 53.2 | 86.2 | 87.5 | 86.0 | 57.8 | 83.1 | 70.2 | 84.9 | 85.2 | 83.9 | 79.7 | 50.3 | 77.9 | 73.9 | 82.5 | 75.3 |
| SSD512 | 07+12+COCO | 81.6 | 86.6 | 88.3 | 82.4 | 76.0 | 66.3 | 88.6 | 88.9 | 89.1 | 65.1 | 88.4 | 73.6 | 86.5 | 88.9 | 85.3 | 84.6 | 59.1 | 85.0 | 80.4 | 87.4 | 81.2 |
表 1:PASCAL VOC2007 test 检测结果。 Fast 与 Faster R-CNN 使用最小边为 600 的输入图像。两个 SSD 模型设置完全相同,仅输入尺寸不同( 对 )。显然更大输入更好,更多数据总是有帮助。数据:"07":VOC2007 trainval;"07+12":VOC2007 与 VOC2012 trainval 并集;"07+12+COCO":先在 COCO trainval35k 训练再在 07+12 微调。
To understand the performance of our two SSD models in more details, we used the detection analysis tool from [21]. Figure 3 shows that SSD can detect various object categories with high quality (large white area). The majority of its confident detections are correct. The recall is around 85-90%, and is much higher with “weak” (0.1 jaccard overlap) criteria. Compared to R-CNN [22], SSD has less localization error, indicating that SSD can localize objects better because it directly learns to regress the object shape and classify object categories instead of using two decoupled steps. However, SSD has more confusions with similar object categories (especially for animals), partly because we share locations for multiple categories. Figure 4 shows that SSD is very sensitive to the bounding box size. In other words, it has much worse performance on smaller objects than bigger objects. This is not surprising because those small objects may not even have any information at the very top layers. Increasing the input size (e.g. from to ) can help improve detecting small objects, but there is still a lot of room to improve. On the positive side, we can clearly see that SSD performs really well on large objects. And it is very robust to different object aspect ratios because we use default boxes of various aspect ratios per feature map location.
为更细理解两个 SSD 模型的表现,我们使用 [21] 的检测分析工具。图 3 显示 SSD 能高质量检测各类物体(大片白色区域)。多数高置信检测正确。召回约 85–90%,在「弱」(0.1 Jaccard 重叠)标准下更高。相对 R-CNN [22],SSD 定位误差更少,说明它因直接学习回归物体形状并分类,而非两步解耦,定位更好。但 SSD 与相似类别(尤其动物)混淆更多,部分因多类别共享位置。图 4 显示 SSD 对边界框尺寸非常敏感:小物体远差于大物体。这不奇怪,因为小物体在很顶层可能已无信息。增大输入(如从 到 )有助小物体,但仍有很大改进空间。积极一面是,SSD 在大物体上表现很好;由于每个特征图位置使用多种纵横比默认框,对不同物体纵横比也很鲁棒。
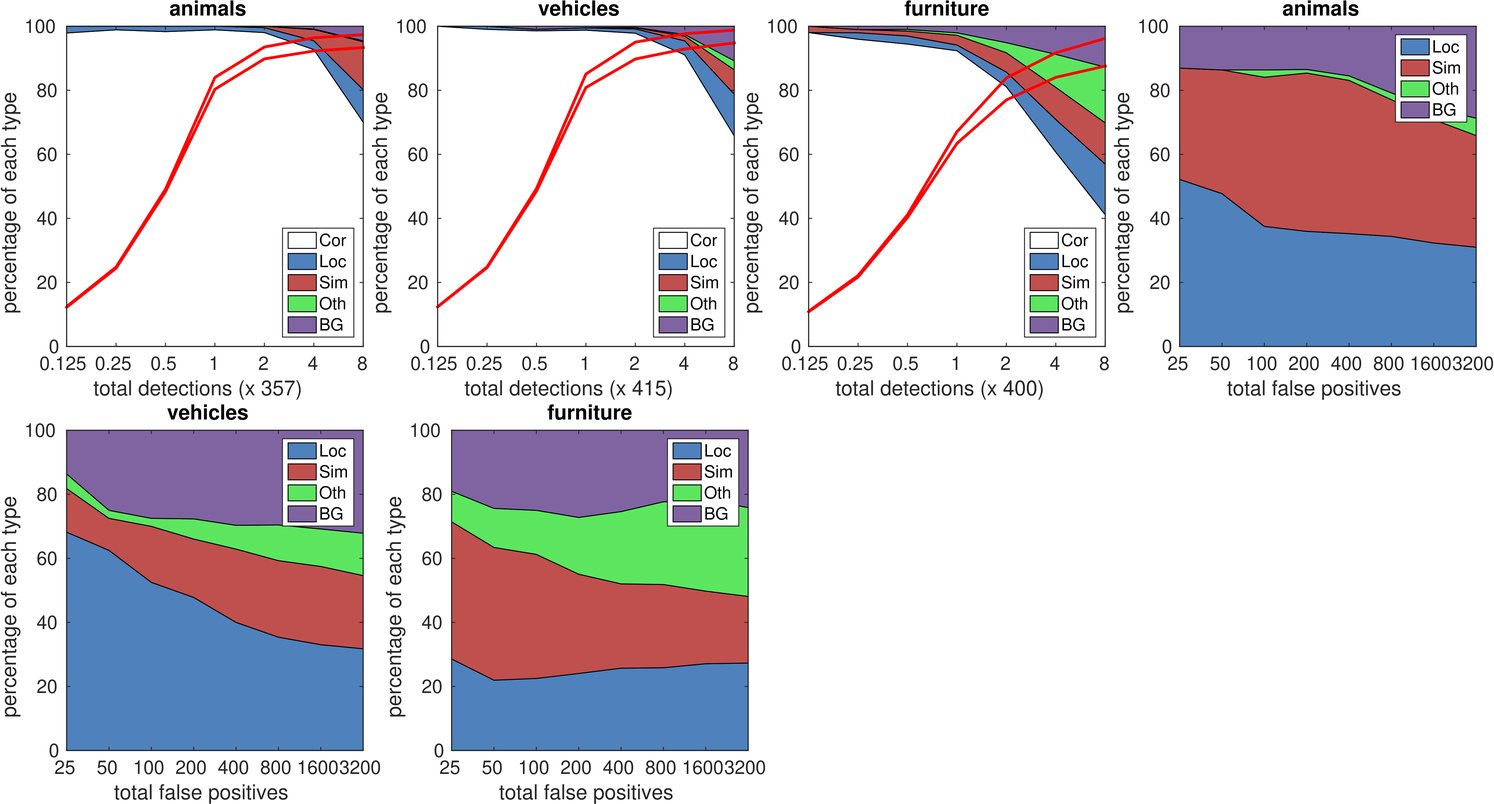
Figure 3: Visualization of performance for SSD512 on animals, vehicles, and furniture from VOC2007 test. The top row shows the cumulative fraction of detections that are correct (Cor) or false positive due to poor localization (Loc), confusion with similar categories (Sim), with others (Oth), or with background (BG). The solid red line reflects the change of recall with âstrongâ criteria (0.5 jaccard overlap) as the num- ber of detections increases. The dashed red line is using the âweakâ criteria (0.1 jaccard overlap). The bottom row shows the distribution of top-ranked false positive types.
图 3:SSD512 在 VOC2007 test 动物、车辆、家具上的表现可视化。 上行给出检测中正确(Cor),或因定位差(Loc)、与相似类混淆(Sim)、与其他类(Oth)、与背景(BG)造成的假正例的累积占比。实红线反映「强」标准(0.5 Jaccard)下召回随检测数增加的变化;虚红线为「弱」标准(0.1 Jaccard)。下行给出排名靠前的假正例类型分布。

Figure 4: Sensitivity and impact of different object characteristics on VOC2007 test set using [21]. The plot on the left shows the effects of BBox Area per category, and the right plot shows the effect of Aspect Ratio. Key: BBox Area: XS=extra-small; S=small; M=medium; L=large; XL =extra-large. Aspect Ratio: XT=extra-tall/narrow; T=tall; M=medium; W=wide; XW =extra-wide.
图 4:用 [21] 分析不同物体特性对 VOC2007 test 的敏感性与影响。 左图为各类别边界框面积效应,右图为纵横比效应。键:边界框面积 XS=特小;S=小;M=中;L=大;XL=特大。纵横比 XT=特高/窄;T=高;M=中;W=宽;XW=特宽。
3.2 Model analysis
3.2 模型分析
To understand SSD better, we carried out controlled experiments to examine how each component affects performance. For all the experiments, we use the same settings and input size (), except for specified changes to the settings or component(s).
为更好理解 SSD,我们做受控实验考察各组件如何影响性能。除标明的设置或组件改动外,全部实验使用相同设置与输入尺寸()。
| SSD300 | |||||
|---|---|---|---|---|---|
| more data augmentation? | ✔ | ✔ | ✔ | ✔ | |
| include {} box? | ✔ | ✔ | ✔ | ✔ | |
| include {} box? | ✔ | ✔ | ✔ | ||
| use atrous? | ✔ | ✔ | ✔ | ✔ | |
| VOC2007 test mAP | 65.5 | 71.6 | 73.7 | 74.2 | 74.3 |
Table 2: Effects of various design choices and components on SSD performance.
| SSD300 | |||||
|---|---|---|---|---|---|
| more data augmentation? | ✔ | ✔ | ✔ | ✔ | |
| include {} box? | ✔ | ✔ | ✔ | ✔ | |
| include {} box? | ✔ | ✔ | ✔ | ||
| use atrous? | ✔ | ✔ | ✔ | ✔ | |
| VOC2007 test mAP | 65.5 | 71.6 | 73.7 | 74.2 | 74.3 |
表 2:各设计选择与组件对 SSD 性能的影响。
Data augmentation is crucial. Fast and Faster R-CNN use the original image and the horizontal flip to train. We use a more extensive sampling strategy, similar to YOLO [5]. Table 2 shows that we can improve 8.8% mAP with this sampling strategy. We do not know how much our sampling strategy will benefit Fast and Faster R-CNN, but they are likely to benefit less because they use a feature pooling step during classification that is relatively robust to object translation by design.
数据增强至关重要。 Fast 与 Faster R-CNN 用原图与水平翻转训练。我们采用更充分的采样策略,类似 YOLO [5]。表 2 显示该采样策略可提升 8.8% mAP。我们不清楚该策略对 Fast/Faster R-CNN 帮助多大,但它们可能受益较少,因其分类阶段的特征池化设计上对物体平移相对鲁棒。
More default box shapes is better. As described in Sec. 2.2, by default we use 6 default boxes per location. If we remove the boxes with and 3 aspect ratios, the performance drops by 0.6%. By further removing the boxes with and 2 aspect ratios, the performance drops another 2.1%. Using a variety of default box shapes seems to make the task of predicting boxes easier for the network.
更多默认框形状更好。 如第 2.2 节所述,默认每位置用 6 个默认框。去掉纵横比 与 3 的框,性能掉 0.6%;再去掉 与 2,再掉 2.1%。多样默认框形状似乎让网络预测框更容易。
Atrous is faster. As described in Sec. 3, we used the atrous version of a subsampled VGG16, following DeepLab-LargeFOV [17]. If we use the full VGG16, keeping pool5 with and not subsampling parameters from fc6 and fc7, and add conv5_3 for prediction, the result is about the same while the speed is about 20% slower.
Atrous 更快。 如第 3 节所述,我们按 DeepLab-LargeFOV [17] 使用子采样 VGG16 的 atrous 版本。若用完整 VGG16,保留 的 pool5 且不从 fc6、fc7 子采样参数,并加入 conv5_3 做预测,结果大致相同,速度约慢 20%。
| Prediction source layers from: | mAP use boundary boxes? | # Boxes | ||||||
|---|---|---|---|---|---|---|---|---|
| conv4_3 | conv7 | conv8_2 | conv9_2 | conv10_2 | conv11_2 | Yes | No | |
| ✔ | ✔ | ✔ | ✔ | ✔ | ✔ | 74.3 | 63.4 | 8732 |
| ✔ | ✔ | ✔ | ✔ | ✔ | 74.6 | 63.1 | 8764 | |
| ✔ | ✔ | ✔ | ✔ | 73.8 | 68.4 | 8942 | ||
| ✔ | ✔ | ✔ | 70.7 | 69.2 | 9864 | |||
| ✔ | ✔ | 64.2 | 64.4 | 9025 | ||||
| ✔ | 62.4 | 64.0 | 8664 |
Table 3: Effects of using multiple output layers.
| 预测来源层 | 是否用边界框时的 mAP | 框数 |
|---|---|---|
| conv4_3+conv7+conv8_2+conv9_2+conv10_2+conv11_2 | Yes 74.3 / No 63.4 | 8732 |
| 去掉 conv11_2 | Yes 74.6 / No 63.1 | 8764 |
| 再去掉 conv10_2 | Yes 73.8 / No 68.4 | 8942 |
| 再去掉 conv9_2 | Yes 70.7 / No 69.2 | 9864 |
| 仅到 conv8_2 | Yes 64.2 / No 64.4 | 9025 |
| 仅 conv7 | Yes 62.4 / No 64.0 | 8664 |
表 3:使用多个输出层的影响。
Multiple output layers at different resolutions is better. A major contribution of SSD is using default boxes of different scales on different output layers. To measure the advantage gained, we progressively remove layers and compare results. For a fair comparison, every time we remove a layer, we adjust the default box tiling to keep the total number of boxes similar to the original (8732). This is done by stacking more scales of boxes on remaining layers and adjusting scales of boxes if needed. We do not exhaustively optimize the tiling for each setting. Table 3 shows a decrease in accuracy with fewer layers, dropping monotonically from 74.3 to 62.4. When we stack boxes of multiple scales on a layer, many are on the image boundary and need to be handled carefully. We tried the strategy used in Faster R-CNN [2], ignoring boxes which are on the boundary. We observe some interesting trends. For example, it hurts the performance by a large margin if we use very coarse feature maps (e.g. conv11_2 () or conv10_2 ()). The reason might be that we do not have enough large boxes to cover large objects after the pruning. When we use primarily finer resolution maps, the performance starts increasing again because even after pruning a sufficient number of large boxes remains. If we only use conv7 for prediction, the performance is the worst, reinforcing the message that it is critical to spread boxes of different scales over different layers. Besides, since our predictions do not rely on ROI pooling as in [6], we do not have the collapsing bins problem in low-resolution feature maps [23]. The SSD architecture combines predictions from feature maps of various resolutions to achieve comparable accuracy to Faster R-CNN, while using lower resolution input images.
不同分辨率的多输出层更好。 SSD 的一大贡献是在不同输出层使用不同尺度的默认框。为度量收益,我们逐步去掉层并对比结果。为公平,每去掉一层就调整默认框铺排,使总框数与原始(8732)相近:在剩余层上堆更多尺度的框,必要时调整尺度。我们未对每种设置穷尽优化铺排。表 3 显示层数减少时精度单调从 74.3 降到 62.4。在一层上堆多尺度框时,许多落在图像边界,需小心处理。我们尝试 Faster R-CNN [2] 的策略,忽略边界上的框,观察到有趣趋势:例如若用很粗的特征图(如 conv11_2()或 conv10_2()),性能会大幅受损,可能因剪枝后没有足够大框覆盖大物体。主要用更细分辨率图时,性能又回升,因剪枝后仍剩足够大框。若仅用 conv7 预测,性能最差,再次说明必须把不同尺度的框分散到不同层。此外,由于预测不像 [6] 依赖 ROI 池化,我们没有低分辨率特征图上的 collapsing bins 问题 [23]。SSD 架构融合多分辨率特征图预测,以较低分辨率输入达到与 Faster R-CNN 可比的精度。
3.3 PASCAL VOC2012
We use the same settings as those used for our basic VOC2007 experiments above, except that we use VOC2012 trainval and VOC2007 trainval and test (21503 images) for training, and test on VOC2012 test (10991 images). We train the models with learning rate for 60k iterations, then for 20k iterations. Table 4 shows the results of our SSD300 and SSD512[^4] model. We see the same performance trend as we observed on VOC2007 test. Our SSD300 improves accuracy over Fast/Faster R-CNN. By increasing the training and testing image size to , we are 4.5% more accurate than Faster R-CNN. Compared to YOLO, SSD is significantly more accurate, likely due to the use of convolutional default boxes from multiple feature maps and our matching strategy during training. When fine-tuned from models trained on COCO, our SSD512 achieves 80.0% mAP, which is 4.1% higher than Faster R-CNN.
设置与上述 VOC2007 基本实验相同,但训练用 VOC2012 trainval 与 VOC2007 trainval+test(21503 张),在 VOC2012 test(10991 张)上测试。以 训练 60k 迭代,再以 训练 20k。表 4 给出 SSD300 与 SSD512[^4] 结果。趋势与 VOC2007 test 一致。SSD300 精度超过 Fast/Faster R-CNN。把训练与测试图像扩到 后,比 Faster R-CNN 高 4.5%。相对 YOLO,SSD 显著更准,可能因多特征图上的卷积默认框以及训练时的匹配策略。从 COCO 训练模型微调后,SSD512 达到 80.0% mAP,比 Faster R-CNN 高 4.1%。
| Method | data | mAP | aero | bike | bird | boat | bottle | bus | car | cat | chair | cow | table | dog | horse | mbike | person | plant | sheep | sofa | train | tv |
|---|---|---|---|---|---|---|---|---|---|---|---|---|---|---|---|---|---|---|---|---|---|---|
| Fast[6] | 07++12 | 68.4 | 82.3 | 78.4 | 70.8 | 52.3 | 38.7 | 77.8 | 71.6 | 89.3 | 44.2 | 73.0 | 55.0 | 87.5 | 80.5 | 80.8 | 72.0 | 35.1 | 68.3 | 65.7 | 80.4 | 64.2 |
| Faster[2] | 07++12 | 70.4 | 84.9 | 79.8 | 74.3 | 53.9 | 49.8 | 77.5 | 75.9 | 88.5 | 45.6 | 77.1 | 55.3 | 86.9 | 81.7 | 80.9 | 79.6 | 40.1 | 72.6 | 60.9 | 81.2 | 61.5 |
| Faster[2] | 07++12+COCO | 75.9 | 87.4 | 83.6 | 76.8 | 62.9 | 59.6 | 81.9 | 82.0 | 91.3 | 54.9 | 82.6 | 59.0 | 89.0 | 85.5 | 84.7 | 84.1 | 52.2 | 78.9 | 65.5 | 85.4 | 70.2 |
| YOLO[5] | 07++12 | 57.9 | 77.0 | 67.2 | 57.7 | 38.3 | 22.7 | 68.3 | 55.9 | 81.4 | 36.2 | 60.8 | 48.5 | 77.2 | 72.3 | 71.3 | 63.5 | 28.9 | 52.2 | 54.8 | 73.9 | 50.8 |
| SSD300 | 07++12 | 72.4 | 85.6 | 80.1 | 70.5 | 57.6 | 46.2 | 79.4 | 76.1 | 89.2 | 53.0 | 77.0 | 60.8 | 87.0 | 83.1 | 82.3 | 79.4 | 45.9 | 75.9 | 69.5 | 81.9 | 67.5 |
| SSD300 | 07++12+COCO | 77.5 | 90.2 | 83.3 | 76.3 | 63.0 | 53.6 | 83.8 | 82.8 | 92.0 | 59.7 | 82.7 | 63.5 | 89.3 | 87.6 | 85.9 | 84.3 | 52.6 | 82.5 | 74.1 | 88.4 | 74.2 |
| SSD512 | 07++12 | 74.9 | 87.4 | 82.3 | 75.8 | 59.0 | 52.6 | 81.7 | 81.5 | 90.0 | 55.4 | 79.0 | 59.8 | 88.4 | 84.3 | 84.7 | 83.3 | 50.2 | 78.0 | 66.3 | 86.3 | 72.0 |
| SSD512 | 07++12+COCO | 80.0 | 90.7 | 86.8 | 80.5 | 67.8 | 60.8 | 86.3 | 85.5 | 93.5 | 63.2 | 85.7 | 64.4 | 90.9 | 89.0 | 88.9 | 86.8 | 57.2 | 85.1 | 72.8 | 88.4 | 75.9 |
Table 4: PASCAL VOC2012 test detection results. Fast and Faster R-CNN use images with minimum dimension 600, while the image size for YOLO is . data: ”07++12”: union of VOC2007 trainval and test and VOC2012 trainval. ”07++12+COCO”: first train on COCO trainval35k then fine-tune on 07++12.
| Method | data | mAP | aero | bike | bird | boat | bottle | bus | car | cat | chair | cow | table | dog | horse | mbike | person | plant | sheep | sofa | train | tv |
|---|---|---|---|---|---|---|---|---|---|---|---|---|---|---|---|---|---|---|---|---|---|---|
| Fast[6] | 07++12 | 68.4 | 82.3 | 78.4 | 70.8 | 52.3 | 38.7 | 77.8 | 71.6 | 89.3 | 44.2 | 73.0 | 55.0 | 87.5 | 80.5 | 80.8 | 72.0 | 35.1 | 68.3 | 65.7 | 80.4 | 64.2 |
| Faster[2] | 07++12 | 70.4 | 84.9 | 79.8 | 74.3 | 53.9 | 49.8 | 77.5 | 75.9 | 88.5 | 45.6 | 77.1 | 55.3 | 86.9 | 81.7 | 80.9 | 79.6 | 40.1 | 72.6 | 60.9 | 81.2 | 61.5 |
| Faster[2] | 07++12+COCO | 75.9 | 87.4 | 83.6 | 76.8 | 62.9 | 59.6 | 81.9 | 82.0 | 91.3 | 54.9 | 82.6 | 59.0 | 89.0 | 85.5 | 84.7 | 84.1 | 52.2 | 78.9 | 65.5 | 85.4 | 70.2 |
| YOLO[5] | 07++12 | 57.9 | 77.0 | 67.2 | 57.7 | 38.3 | 22.7 | 68.3 | 55.9 | 81.4 | 36.2 | 60.8 | 48.5 | 77.2 | 72.3 | 71.3 | 63.5 | 28.9 | 52.2 | 54.8 | 73.9 | 50.8 |
| SSD300 | 07++12 | 72.4 | 85.6 | 80.1 | 70.5 | 57.6 | 46.2 | 79.4 | 76.1 | 89.2 | 53.0 | 77.0 | 60.8 | 87.0 | 83.1 | 82.3 | 79.4 | 45.9 | 75.9 | 69.5 | 81.9 | 67.5 |
| SSD300 | 07++12+COCO | 77.5 | 90.2 | 83.3 | 76.3 | 63.0 | 53.6 | 83.8 | 82.8 | 92.0 | 59.7 | 82.7 | 63.5 | 89.3 | 87.6 | 85.9 | 84.3 | 52.6 | 82.5 | 74.1 | 88.4 | 74.2 |
| SSD512 | 07++12 | 74.9 | 87.4 | 82.3 | 75.8 | 59.0 | 52.6 | 81.7 | 81.5 | 90.0 | 55.4 | 79.0 | 59.8 | 88.4 | 84.3 | 84.7 | 83.3 | 50.2 | 78.0 | 66.3 | 86.3 | 72.0 |
| SSD512 | 07++12+COCO | 80.0 | 90.7 | 86.8 | 80.5 | 67.8 | 60.8 | 86.3 | 85.5 | 93.5 | 63.2 | 85.7 | 64.4 | 90.9 | 89.0 | 88.9 | 86.8 | 57.2 | 85.1 | 72.8 | 88.4 | 75.9 |
表 4:PASCAL VOC2012 test 检测结果。 Fast/Faster R-CNN 最小边 600,YOLO 图像尺寸 。数据:"07++12":VOC2007 trainval+test 与 VOC2012 trainval 并集;"07++12+COCO":先在 COCO trainval35k 训练再在 07++12 微调。
3.4 COCO
To further validate the SSD framework, we trained our SSD300 and SSD512 architectures on the COCO dataset. Since objects in COCO tend to be smaller than PASCAL VOC, we use smaller default boxes for all layers. We follow the strategy mentioned in Sec. 2.2, but now our smallest default box has a scale of 0.15 instead of 0.2, and the scale of the default box on conv4_3 is 0.07 (e.g. 21 pixels for a image)[^5].
为进一步验证 SSD 框架,我们在 COCO 上训练 SSD300 与 SSD512。COCO 物体往往比 PASCAL VOC 更小,因此各层使用更小默认框。仍按第 2.2 节策略,但最小默认框尺度改为 0.15(原 0.2),conv4_3 上默认框尺度为 0.07(例如对 图像约 21 像素)[^5]。
| Method | data | Avg. Precision, IoU: | Avg. Precision, Area: | Avg. Recall, #Dets: | Avg. Recall, Area: | ||||||||
|---|---|---|---|---|---|---|---|---|---|---|---|---|---|
| 0.5:0.95 | 0.5 | 0.75 | S | M | L | 1 | 10 | 100 | S | M | L | ||
| Fast [6] | train | 19.7 | 35.9 | - | - | - | - | - | - | - | - | - | - |
| Fast [24] | train | 20.5 | 39.9 | 19.4 | 4.1 | 20.0 | 35.8 | 21.3 | 29.5 | 30.1 | 7.3 | 32.1 | 52.0 |
| Faster [2] | trainval | 21.9 | 42.7 | - | - | - | - | - | - | - | - | - | - |
| ION [24] | train | 23.6 | 43.2 | 23.6 | 6.4 | 24.1 | 38.3 | 23.2 | 32.7 | 33.5 | 10.1 | 37.7 | 53.6 |
| Faster [25] | trainval | 24.2 | 45.3 | 23.5 | 7.7 | 26.4 | 37.1 | 23.8 | 34.0 | 34.6 | 12.0 | 38.5 | 54.4 |
| SSD300 | trainval35k | 23.2 | 41.2 | 23.4 | 5.3 | 23.2 | 39.6 | 22.5 | 33.2 | 35.3 | 9.6 | 37.6 | 56.5 |
| SSD512 | trainval35k | 26.8 | 46.5 | 27.8 | 9.0 | 28.9 | 41.9 | 24.8 | 37.5 | 39.8 | 14.0 | 43.5 | 59.0 |
Table 5: COCO test-dev2015 detection results.
| Method | data | Avg. Precision, IoU: | Avg. Precision, Area: | Avg. Recall, #Dets: | Avg. Recall, Area: | ||||||||
|---|---|---|---|---|---|---|---|---|---|---|---|---|---|
| 0.5:0.95 | 0.5 | 0.75 | S | M | L | 1 | 10 | 100 | S | M | L | ||
| Fast [6] | train | 19.7 | 35.9 | - | - | - | - | - | - | - | - | - | - |
| Fast [24] | train | 20.5 | 39.9 | 19.4 | 4.1 | 20.0 | 35.8 | 21.3 | 29.5 | 30.1 | 7.3 | 32.1 | 52.0 |
| Faster [2] | trainval | 21.9 | 42.7 | - | - | - | - | - | - | - | - | - | - |
| ION [24] | train | 23.6 | 43.2 | 23.6 | 6.4 | 24.1 | 38.3 | 23.2 | 32.7 | 33.5 | 10.1 | 37.7 | 53.6 |
| Faster [25] | trainval | 24.2 | 45.3 | 23.5 | 7.7 | 26.4 | 37.1 | 23.8 | 34.0 | 34.6 | 12.0 | 38.5 | 54.4 |
| SSD300 | trainval35k | 23.2 | 41.2 | 23.4 | 5.3 | 23.2 | 39.6 | 22.5 | 33.2 | 35.3 | 9.6 | 37.6 | 56.5 |
| SSD512 | trainval35k | 26.8 | 46.5 | 27.8 | 9.0 | 28.9 | 41.9 | 24.8 | 37.5 | 39.8 | 14.0 | 43.5 | 59.0 |
表 5:COCO test-dev2015 检测结果。
We use the trainval35k [24] for training. We first train the model with learning rate for 160k iterations, and then continue training for 40k iterations with and 40k iterations with . Table 5 shows the results on test-dev2015. Similar to what we observed on the PASCAL VOC dataset, SSD300 is better than Fast R-CNN in both mAP@0.5 and mAP@[0.5:0.95]. SSD300 has a similar mAP@0.75 as ION [24] and Faster R-CNN [25], but is worse in mAP@0.5. By increasing the image size to , our SSD512 is better than Faster R-CNN [25] in both criteria. Interestingly, we observe that SSD512 is 5.3% better in mAP@0.75, but is only 1.2% better in mAP@0.5. We also observe that it has much better AP (4.8%) and AR (4.6%) for large objects, but has relatively less improvement in AP (1.3%) and AR (2.0%) for small objects. Compared to ION, the improvement in AR for large and small objects is more similar (5.4% vs. 3.9%). We conjecture that Faster R-CNN is more competitive on smaller objects with SSD because it performs two box refinement steps, in both the RPN part and in the Fast R-CNN part. In Fig. 5, we show some detection examples on COCO test-dev with the SSD512 model.
我们用 trainval35k [24] 训练。先以 训练 160k 迭代,再以 、 各继续 40k。表 5 给出 test-dev2015 结果。与 PASCAL VOC 观察类似,SSD300 在 mAP@0.5 与 mAP@[0.5:0.95] 上均优于 Fast R-CNN。SSD300 的 mAP@0.75 与 ION [24]、Faster R-CNN [25] 相近,但 mAP@0.5 更差。把图像扩到 后,SSD512 在两项指标上都优于 Faster R-CNN [25]。有趣的是,SSD512 在 mAP@0.75 上高 5.3%,在 mAP@0.5 上仅高 1.2%。我们还观察到大物体的 AP(4.8%)与 AR(4.6%)改善明显,小物体 AP(1.3%)、AR(2.0%)改善相对较小。相对 ION,大、小物体 AR 改善更接近(5.4% 对 3.9%)。我们推测 Faster R-CNN 在小物体上相对 SSD 更有竞争力,因它在 RPN 与 Fast R-CNN 两部分各做一次框精修。图 5 给出 SSD512 在 COCO test-dev 上的部分检测示例。
3.5 Preliminary ILSVRC results
3.5 ILSVRC 初步结果
We applied the same network architecture we used for COCO to the ILSVRC DET dataset [16]. We train a SSD300 model using the ILSVRC2014 DET train and val1 as used in [22]. We first train the model with learning rate for 320k iterations, and then continue training for 80k iterations with and 40k iterations with . We can achieve 43.4 mAP on the val2 set [22]. Again, it validates that SSD is a general framework for high quality real-time detection.
我们把用于 COCO 的同一网络架构应用到 ILSVRC DET 数据集 [16]。用 [22] 所用的 ILSVRC2014 DET train 与 val1 训练 SSD300。先以 训练 320k 迭代,再以 训练 80k、 训练 40k。在 val2 集 [22] 上可达 43.4 mAP。这再次验证 SSD 是面向高质量实时检测的通用框架。
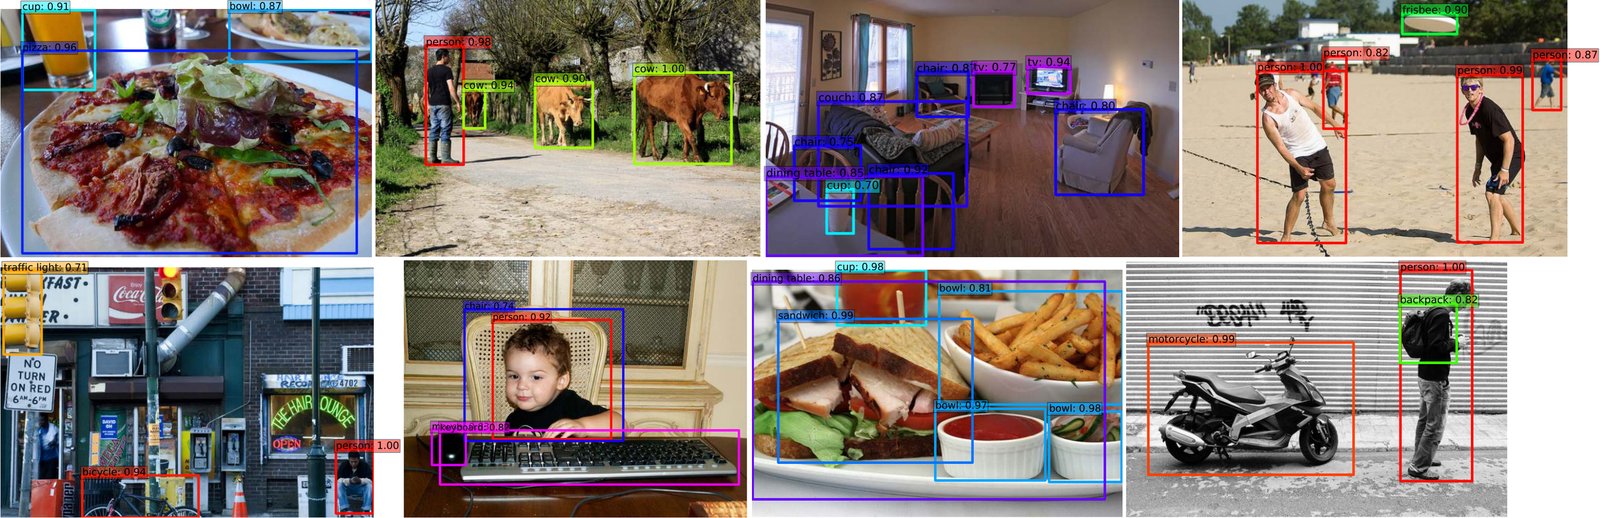
Figure 5: Detection examples on COCO test-dev with SSD512 model. We show detections with scores higher than 0.6. Each color corresponds to an object category.
图 5:SSD512 在 COCO test-dev 上的检测示例。 显示分数高于 0.6 的检测。每种颜色对应一个物体类别。
3.6 Data Augmentation for Small Object Accuracy
3.6 面向小物体精度的数据增强
Without a follow-up feature resampling step as in Faster R-CNN, the classification task for small objects is relatively hard for SSD, as demonstrated in our analysis (see Fig. 4). The data augmentation strategy described in Sec. 2.2 helps to improve the performance dramatically, especially on small datasets such as PASCAL VOC. The random crops generated by the strategy can be thought of as a ”zoom in” operation and can generate many larger training examples. To implement a ”zoom out” operation that creates more small training examples, we first randomly place an image on a canvas of of the original image size filled with mean values before we do any random crop operation. Because we have more training images by introducing this new ”expansion” data augmentation trick, we have to double the training iterations. We have seen a consistent increase of 2%-3% mAP across multiple datasets, as shown in Table 6. In specific, Figure 6 shows that the new augmentation trick significantly improves the performance on small objects. This result underscores the importance of the data augmentation strategy for the final model accuracy.
没有 Faster R-CNN 那种后续特征重采样步骤时,SSD 对小物体的分类相对困难,分析已显示(见图 4)。第 2.2 节的数据增强策略显著提升性能,在 PASCAL VOC 这类小数据集上尤甚。该策略生成的随机裁剪可视为「放大」操作,能产生许多更大的训练样本。为实现创造更多小训练样本的「缩小」操作,我们在做任何随机裁剪前,先把图像随机放到填充均值、面积为原图 的画布上。引入这一新的「扩展」数据增强后训练图像更多,须把训练迭代加倍。如表 6 所示,多个数据集上一致提升 2%–3% mAP。具体地,图 6 显示新增强显著改善小物体性能。这一结果强调数据增强策略对最终模型精度的重要性。
An alternative way of improving SSD is to design a better tiling of default boxes so that its position and scale are better aligned with the receptive field of each position on a feature map. We leave this for future work.
改进 SSD 的另一路径是设计更好的默认框铺排,使其位置与尺度更好对齐特征图各位置的感受野。留作未来工作。
| Method | VOC2007 test | VOC2012 test | COCO test-dev2015 | ||||
|---|---|---|---|---|---|---|---|
| 07+12 | 07+12+COCO | 07++12 | 07++12+COCO | trainval35k | |||
| 0.5 | 0.5 | 0.5 | 0.5 | 0.5:0.95 | 0.5 | 0.75 | |
| SSD300 | 74.3 | 79.6 | 72.4 | 77.5 | 23.2 | 41.2 | 23.4 |
| SSD512 | 76.8 | 81.6 | 74.9 | 80.0 | 26.8 | 46.5 | 27.8 |
| SSD300* | 77.2 | 81.2 | 75.8 | 79.3 | 25.1 | 43.1 | 25.8 |
| SSD512* | 79.8 | 83.2 | 78.5 | 82.2 | 28.8 | 48.5 | 30.3 |
Table 6: Results on multiple datasets when we add the image expansion data augmentation trick. SSD300* and SSD512* are the models that are trained with the new data augmentation.
| Method | VOC2007 test | VOC2012 test | COCO test-dev2015 | ||||
|---|---|---|---|---|---|---|---|
| 07+12 | 07+12+COCO | 07++12 | 07++12+COCO | trainval35k | |||
| 0.5 | 0.5 | 0.5 | 0.5 | 0.5:0.95 | 0.5 | 0.75 | |
| SSD300 | 74.3 | 79.6 | 72.4 | 77.5 | 23.2 | 41.2 | 23.4 |
| SSD512 | 76.8 | 81.6 | 74.9 | 80.0 | 26.8 | 46.5 | 27.8 |
| SSD300* | 77.2 | 81.2 | 75.8 | 79.3 | 25.1 | 43.1 | 25.8 |
| SSD512* | 79.8 | 83.2 | 78.5 | 82.2 | 28.8 | 48.5 | 30.3 |
表 6:加入图像扩展数据增强后在多个数据集上的结果。 SSD300* 与 SSD512* 为用新数据增强训练的模型。

Figure 6: Sensitivity and impact of object size with new data augmentation on VOC2007 test set using [21]. The top row shows the effects of BBox Area per category for the original SSD300 and SSD512 model, and the bottom row corresponds to the SSD300* and SSD512* model trained with the new data augmentation trick. It is obvious that the new data augmentation trick helps detecting small objects significantly.
图 6:用新数据增强后在 VOC2007 test 上物体尺寸敏感性与影响(工具 [21])。 上行是原始 SSD300、SSD512 的各类边界框面积效应;下行对应用新增强训练的 SSD300*、SSD512*。显然新增强显著帮助检测小物体。
3.7 Inference time
3.7 推理时间
Considering the large number of boxes generated from our method, it is essential to perform non-maximum suppression (nms) efficiently during inference. By using a confidence threshold of 0.01, we can filter out most boxes. We then apply nms with jaccard overlap of 0.45 per class and keep the top 200 detections per image. This step costs about 1.7 msec per image for SSD300 and 20 VOC classes, which is close to the total time (2.4 msec) spent on all newly added layers. We measure the speed with batch size 8 using Titan X and cuDNN v4 with Intel Xeon E5-2667v3@3.20GHz.
鉴于方法生成的框数量很大,推理时高效做非极大值抑制(nms)至关重要。用置信阈值 0.01 可滤掉多数框。再按类以 Jaccard 重叠 0.45 做 nms,每图保留前 200 个检测。对 SSD300 与 20 个 VOC 类,该步约耗 1.7 ms/图,接近全部新增层总耗时(2.4 ms)。速度在批大小 8、Titan X、cuDNN v4、Intel Xeon E5-2667v3@3.20GHz 上测量。
Table 7 shows the comparison between SSD, Faster R-CNN[2], and YOLO[5]. Both our SSD300 and SSD512 method outperforms Faster R-CNN in both speed and accuracy. Although Fast YOLO[5] can run at 155 FPS, it has lower accuracy by almost 22% mAP. To the best of our knowledge, SSD300 is the first real-time method to achieve above 70% mAP. Note that about 80% of the forward time is spent on the base network (VGG16 in our case). Therefore, using a faster base network could even further improve the speed, which can possibly make the SSD512 model real-time as well.
表 7 对比 SSD、Faster R-CNN[2] 与 YOLO[5]。SSD300 与 SSD512 在速度与精度上均超过 Faster R-CNN。Fast YOLO[5] 虽能跑到 155 FPS,精度低约 22% mAP。据我们所知,SSD300 是首个超过 70% mAP 的实时方法。注意前向时间约 80% 花在基网络(我们这里是 VGG16)上。因此用更快基网络还可进一步提速,有可能让 SSD512 也实时。
| Method | mAP | FPS | batch size | # Boxes | Input resolution |
|---|---|---|---|---|---|
| Faster R-CNN (VGG16) | 73.2 | 7 | 1 | ||
| Fast YOLO | 52.7 | 155 | 1 | 98 | |
| YOLO (VGG16) | 66.4 | 21 | 1 | 98 | |
| SSD300 | 74.3 | 46 | 1 | 8732 | |
| SSD512 | 76.8 | 19 | 1 | 24564 | |
| SSD300 | 74.3 | 59 | 8 | 8732 | |
| SSD512 | 76.8 | 22 | 8 | 24564 |
Table 7: Results on Pascal VOC2007 test. SSD300 is the only real-time detection method that can achieve above 70% mAP. By using a larger input image, SSD512 outperforms all methods on accuracy while maintaining a close to real-time speed.
| Method | mAP | FPS | batch size | # Boxes | Input resolution |
|---|---|---|---|---|---|
| Faster R-CNN (VGG16) | 73.2 | 7 | 1 | ||
| Fast YOLO | 52.7 | 155 | 1 | 98 | |
| YOLO (VGG16) | 66.4 | 21 | 1 | 98 | |
| SSD300 | 74.3 | 46 | 1 | 8732 | |
| SSD512 | 76.8 | 19 | 1 | 24564 | |
| SSD300 | 74.3 | 59 | 8 | 8732 | |
| SSD512 | 76.8 | 22 | 8 | 24564 |
表 7:Pascal VOC2007 test 结果。 SSD300 是唯一能超过 70% mAP 的实时检测方法。用更大输入后,SSD512 在精度上超过所有方法,同时保持接近实时的速度。
4 Related Work
4 相关工作
There are two established classes of methods for object detection in images, one based on sliding windows and the other based on region proposal classification. Before the advent of convolutional neural networks, the state of the art for those two approaches – Deformable Part Model (DPM) [26] and Selective Search [1] – had comparable performance. However, after the dramatic improvement brought on by R-CNN [22], which combines selective search region proposals and convolutional network based post-classification, region proposal object detection methods became prevalent.
图像物体检测有两类成熟方法:一类基于滑动窗口,一类基于区域提案分类。在卷积神经网络兴起前,两类的代表——可变形部件模型(DPM)[26] 与 Selective Search [1]——表现相当。但 R-CNN [22] 把选择性搜索提案与基于卷积网络的后分类结合起来带来剧变后,基于区域提案的检测方法成为主流。
The original R-CNN approach has been improved in a variety of ways. The first set of approaches improve the quality and speed of post-classification, since it requires the classification of thousands of image crops, which is expensive and time-consuming. SPPnet [9] speeds up the original R-CNN approach significantly. It introduces a spatial pyramid pooling layer that is more robust to region size and scale and allows the classification layers to reuse features computed over feature maps generated at several image resolutions. Fast R-CNN [6] extends SPPnet so that it can fine-tune all layers end-to-end by minimizing a loss for both confidences and bounding box regression, which was first introduced in MultiBox [7] for learning objectness.
原始 R-CNN 已从多方面改进。第一类改进后分类的质量与速度:它要对成千上万图像裁剪分类,昂贵耗时。SPPnet [9] 显著加速原 R-CNN:引入对区域尺寸与尺度更鲁棒的空间金字塔池化层,使分类层可复用在多分辨率图像特征图上算出的特征。Fast R-CNN [6] 扩展 SPPnet,通过同时最小化置信与边界框回归损失(该损失由 MultiBox [7] 为学习 objectness 率先引入)端到端微调所有层。
The second set of approaches improve the quality of proposal generation using deep neural networks. In the most recent works like MultiBox [7, 8], the Selective Search region proposals, which are based on low-level image features, are replaced by proposals generated directly from a separate deep neural network. This further improves the detection accuracy but results in a somewhat complex setup, requiring the training of two neural networks with a dependency between them. Faster R-CNN [2] replaces selective search proposals by ones learned from a region proposal network (RPN), and introduces a method to integrate the RPN with Fast R-CNN by alternating between fine-tuning shared convolutional layers and prediction layers for these two networks. This way region proposals are used to pool mid-level features and the final classification step is less expensive. Our SSD is very similar to the region proposal network (RPN) in Faster R-CNN in that we also use a fixed set of (default) boxes for prediction, similar to the anchor boxes in the RPN. But instead of using these to pool features and evaluate another classifier, we simultaneously produce a score for each object category in each box. Thus, our approach avoids the complication of merging RPN with Fast R-CNN and is easier to train, faster, and straightforward to integrate in other tasks.
第二类改进用深度网络提升提案生成质量。在 MultiBox [7, 8] 等近期工作中,基于低层图像特征的 Selective Search 提案被直接由单独深度网络生成的提案取代。这进一步提高检测精度,但设置略复杂:需训练两个相互依赖的网络。Faster R-CNN [2] 用区域提案网络(RPN)学到的提案替换选择性搜索,并引入在共享卷积层与两网络预测层之间交替微调、把 RPN 与 Fast R-CNN 集成的方法。这样区域提案用于池化中层特征,最终分类更便宜。我们的 SSD 与 Faster R-CNN 中的 RPN 很像:也用一组固定(默认)框做预测,类似 RPN 的锚框。但我们不用它们去池化特征再跑另一分类器,而是同时为每个框上每个物体类别产出分数。因此本方法避免合并 RPN 与 Fast R-CNN 的复杂,更易训练、更快,也便于集成到其他任务。
Another set of methods, which are directly related to our approach, skip the proposal step altogether and predict bounding boxes and confidences for multiple categories directly. OverFeat [4], a deep version of the sliding window method, predicts a bounding box directly from each location of the topmost feature map after knowing the confidences of the underlying object categories. YOLO [5] uses the whole topmost feature map to predict both confidences for multiple categories and bounding boxes (which are shared for these categories). Our SSD method falls in this category because we do not have the proposal step but use the default boxes. However, our approach is more flexible than the existing methods because we can use default boxes of different aspect ratios on each feature location from multiple feature maps at different scales. If we only use one default box per location from the topmost feature map, our SSD would have similar architecture to OverFeat [4]; if we use the whole topmost feature map and add a fully connected layer for predictions instead of our convolutional predictors, and do not explicitly consider multiple aspect ratios, we can approximately reproduce YOLO [5].
另一类与我们直接相关的方法完全跳过提案步骤,直接预测多类别的边界框与置信度。OverFeat [4] 作为滑动窗口的深度版本,在得知底层物体类别置信后,从最顶特征图每个位置直接预测边界框。YOLO [5] 用整张最顶特征图同时预测多类置信与(这些类别共享的)边界框。SSD 也属此类,因没有提案步骤而使用默认框。但我们的方法更灵活:可在多尺度多特征图的每个特征位置使用不同纵横比的默认框。若只在最顶特征图每位置用一个默认框,SSD 架构会类似 OverFeat [4];若用整张最顶特征图并加全连接层做预测(而非卷积预测器),且不显式考虑多纵横比,则可近似复现 YOLO [5]。
5 Conclusions
5 结论
This paper introduces SSD, a fast single-shot object detector for multiple categories. A key feature of our model is the use of multi-scale convolutional bounding box outputs attached to multiple feature maps at the top of the network. This representation allows us to efficiently model the space of possible box shapes. We experimentally validate that given appropriate training strategies, a larger number of carefully chosen default bounding boxes results in improved performance. We build SSD models with at least an order of magnitude more box predictions sampling location, scale, and aspect ratio, than existing methods [5, 7]. We demonstrate that given the same VGG-16 base architecture, SSD compares favorably to its state-of-the-art object detector counterparts in terms of both accuracy and speed. Our SSD512 model significantly outperforms the state-of-the-art Faster R-CNN [2] in terms of accuracy on PASCAL VOC and COCO, while being faster. Our real time SSD300 model runs at 59 FPS, which is faster than the current real time YOLO [5] alternative, while producing markedly superior detection accuracy.
本文提出 SSD:面向多类别的快速单次物体检测器。模型关键特征是:把多尺度卷积边界框输出接到网络顶部多张特征图上。该表示使我们能高效建模可能的框形状空间。实验验证:在合适训练策略下,更多精心选择的默认边界框带来更好性能。我们构建的 SSD 模型在位置、尺度、纵横比上的框预测采样量至少比已有方法 [5, 7] 高一个数量级。在相同 VGG-16 基架构下,SSD 在精度与速度上均优于当时前沿物体检测对照。SSD512 在 PASCAL VOC 与 COCO 精度上显著超过前沿 Faster R-CNN [2],同时快约 。实时 SSD300 跑到 59 FPS,快于当时实时 YOLO [5] 方案,检测精度也明显更高。
Apart from its standalone utility, we believe that our monolithic and relatively simple SSD model provides a useful building block for larger systems that employ an object detection component. A promising future direction is to explore its use as part of a system using recurrent neural networks to detect and track objects in video simultaneously.
除独立用途外,我们认为这一整体、相对简单的 SSD 模型可为更大系统中的物体检测组件提供有用积木。有前景的方向是探索把它接入用循环神经网络同时检测并跟踪视频中物体的系统。
6 Acknowledgment
6 致谢
This work was started as an internship project at Google and continued at UNC. We would like to thank Alex Toshev for helpful discussions and are indebted to the Image Understanding and DistBelief teams at Google. We also thank Philip Ammirato and Patrick Poirson for helpful comments. We thank NVIDIA for providing GPUs and acknowledge support from NSF 1452851, 1446631, 1526367, 1533771.
本工作始于 Google 实习项目,并在 UNC 继续。感谢 Alex Toshev 的有益讨论,并感谢 Google 的 Image Understanding 与 DistBelief 团队。也感谢 Philip Ammirato 与 Patrick Poirson 的意见。感谢 NVIDIA 提供 GPU,并感谢 NSF 1452851、1446631、1526367、1533771 的支持。
References
参考文献
[1] Uijlings, J.R., van de Sande, K.E., Gevers, T., Smeulders, A.W.: Selective search for object recognition. IJCV (2013)
[2] Ren, S., He, K., Girshick, R., Sun, J.: Faster R-CNN: Towards real-time object detection with region proposal networks. In: NIPS. (2015)
[3] He, K., Zhang, X., Ren, S., Sun, J.: Deep residual learning for image recognition. In: CVPR. (2016)
[4] Sermanet, P., Eigen, D., Zhang, X., Mathieu, M., Fergus, R., LeCun, Y.: Overfeat: Integrated recognition, localization and detection using convolutional networks. In: ICLR. (2014)
[5] Redmon, J., Divvala, S., Girshick, R., Farhadi, A.: You only look once: Unified, real-time object detection. In: CVPR. (2016)
[6] Girshick, R.: Fast R-CNN. In: ICCV. (2015)
[7] Erhan, D., Szegedy, C., Toshev, A., Anguelov, D.: Scalable object detection using deep neural networks. In: CVPR. (2014)
[8] Szegedy, C., Reed, S., Erhan, D., Anguelov, D.: Scalable, high-quality object detection. arXiv preprint arXiv:1412.1441 v3 (2015)
[9] He, K., Zhang, X., Ren, S., Sun, J.: Spatial pyramid pooling in deep convolutional networks for visual recognition. In: ECCV. (2014)
[10] Long, J., Shelhamer, E., Darrell, T.: Fully convolutional networks for semantic segmentation. In: CVPR. (2015)
[11] Hariharan, B., Arbeláez, P., Girshick, R., Malik, J.: Hypercolumns for object segmentation and fine-grained localization. In: CVPR. (2015)
[12] Liu, W., Rabinovich, A., Berg, A.C.: ParseNet: Looking wider to see better. In: ILCR. (2016)
[13] Zhou, B., Khosla, A., Lapedriza, A., Oliva, A., Torralba, A.: Object detectors emerge in deep scene cnns. In: ICLR. (2015)
[14] Howard, A.G.: Some improvements on deep convolutional neural network based image classification. arXiv preprint arXiv:1312.5402 (2013)
[15] Simonyan, K., Zisserman, A.: Very deep convolutional networks for large-scale image recognition. In: NIPS. (2015)
[16] Russakovsky, O., Deng, J., Su, H., Krause, J., Satheesh, S., Ma, S., Huang, Z., Karpathy, A., Khosla, A., Bernstein, M., Berg, A.C., Fei-Fei, L.: Imagenet large scale visual recognition challenge. IJCV (2015)
[17] Chen, L.C., Papandreou, G., Kokkinos, I., Murphy, K., Yuille, A.L.: Semantic image segmentation with deep convolutional nets and fully connected crfs. In: ICLR. (2015)
[18] Holschneider, M., Kronland-Martinet, R., Morlet, J., Tchamitchian, P.: A real-time algorithm for signal analysis with the help of the wavelet transform. In: Wavelets. Springer (1990) 286–297
[19] Jia, Y., Shelhamer, E., Donahue, J., Karayev, S., Long, J., Girshick, R., Guadarrama, S., Darrell, T.: Caffe: Convolutional architecture for fast feature embedding. In: MM. (2014)
[20] Glorot, X., Bengio, Y.: Understanding the difficulty of training deep feedforward neural networks. In: AISTATS. (2010)
[21] Hoiem, D., Chodpathumwan, Y., Dai, Q.: Diagnosing error in object detectors. In: ECCV 2012. (2012)
[22] Girshick, R., Donahue, J., Darrell, T., Malik, J.: Rich feature hierarchies for accurate object detection and semantic segmentation. In: CVPR. (2014)
[23] Zhang, L., Lin, L., Liang, X., He, K.: Is faster r-cnn doing well for pedestrian detection. In: ECCV. (2016)
[24] Bell, S., Zitnick, C.L., Bala, K., Girshick, R.: Inside-outside net: Detecting objects in context with skip pooling and recurrent neural networks. In: CVPR. (2016)
[25] COCO: Common Objects in Context. http://mscoco.org/dataset/#detections-leaderboard (2016) [Online; accessed 25-July-2016].
[26] Felzenszwalb, P., McAllester, D., Ramanan, D.: A discriminatively trained, multiscale, deformable part model. In: CVPR. (2008)