Generalizable Slum Detection from Satellite Imagery with Mixture-of-Experts
Generalizable Slum Detection from Satellite Imagery with Mixture-of-Experts
用混合专家从卫星影像中做可泛化的贫民窟检测
Sumin Lee † † thanks: Equal contribution to this work. Sungwon Park 1 1 footnotemark: 1 Jeasurk Yang † † thanks: Co-corresponding authors. Jihee Kim 2 2 footnotemark: 2 Meeyoung Cha 2 2 footnotemark: 2
Abstract
摘要
Satellite-based slum segmentation holds significant promise in generating global estimates of urban poverty. However, the morphological heterogeneity of informal settlements presents a major challenge, hindering the ability of models trained on specific regions to generalize effectively to unseen locations. To address this, we introduce a large-scale high-resolution dataset and propose GRAM (Generalized Region-Aware Mixture-of-Experts), a two-phase test-time adaptation framework that enables robust slum segmentation without requiring labeled data from target regions. We compile a million-scale satellite imagery dataset from 12 cities across four continents for source training. Using this dataset, the model employs a Mixture-of-Experts architecture to capture region-specific slum characteristics while learning universal features through a shared backbone. During adaptation, prediction consistency across experts filters out unreliable pseudo-labels, allowing the model to generalize effectively to previously unseen regions. GRAM outperforms state-of-the-art baselines in low-resource settings such as African cities, offering a scalable and label-efficient solution for global slum mapping and data-driven urban planning.
基于卫星影像的贫民窟分割,有望用来估计全球城市贫困规模。不过,非正规住区的形态差异很大,在特定地区上训练的模型往往难以有效泛化到未见过的地点。为此,我们整理了一套大规模高分辨率数据集,并提出 GRAM(Generalized Region-Aware Mixture-of-Experts,泛化的区域感知混合专家)。这是一个两阶段的测试时适应(test-time adaptation)框架,无需目标区域的标注数据即可稳健地分割贫民窟。我们汇集来自四大洲 12 座城市、规模达百万级的卫星影像,用于源域训练。模型采用混合专家(Mixture-of-Experts)结构,在共享主干上学习通用特征的同时,捕捉各地区特有的贫民窟形态。适应阶段则利用各专家预测的一致性,过滤不可靠的伪标签,从而使模型能够泛化到此前未见过的区域。在非洲城市这类低资源设定中,GRAM 优于现有先进基线,为全球贫民窟制图和数据驱动的城市规划提供了一种可扩展、标注需求较低的方案。
1 Max Planck Institute for Security and Privacy (MPI-SP)
2 Korea Advanced Institute of Science and Technology (KAIST)
Datasets — https://github.com/DS4H-GIS/GRAM
Introduction
引言
In 2003, UN-Habitat introduced a globally standardized definition to describe deprived urban settlements—commonly referred to as slums—marking a pivotal shift in how urban poverty was conceptualized and measured worldwide (UN-Habitat 2003). This universal framework, formally adopted by the United Nations, was established to identify and quantify urban deprivation. It defines slums as settlements lacking one or more basic living conditions, such as durable housing, sufficient living space, access to safe water and sanitation, and secure tenure. This standardized definition enabled the production of comparable global estimates of slum populations, shaping major policy agendas like the Sustainable Development Goals (SDGs) and supporting cross-national research efforts (UN-Habitat 2025).
2003 年,联合国人居署(UN-Habitat)提出了一套用于描述城市贫困住区的全球标准定义,这类住区通常被称为贫民窟(slums),这改变了世界范围内理解和度量城市贫困的方式 (UN-Habitat 2003)。这一后来由联合国正式采纳的通用框架,旨在识别并量化城市剥夺。它把贫民窟定义为缺少耐久住房、足够居住面积、安全用水与卫生设施、住房保障等基本居住条件中至少一项的住区。标准化定义使各国贫民窟人口规模可以相互比较,也影响了可持续发展目标(SDGs)等主要政策议程,并支撑了跨国研究 (UN-Habitat 2025)。
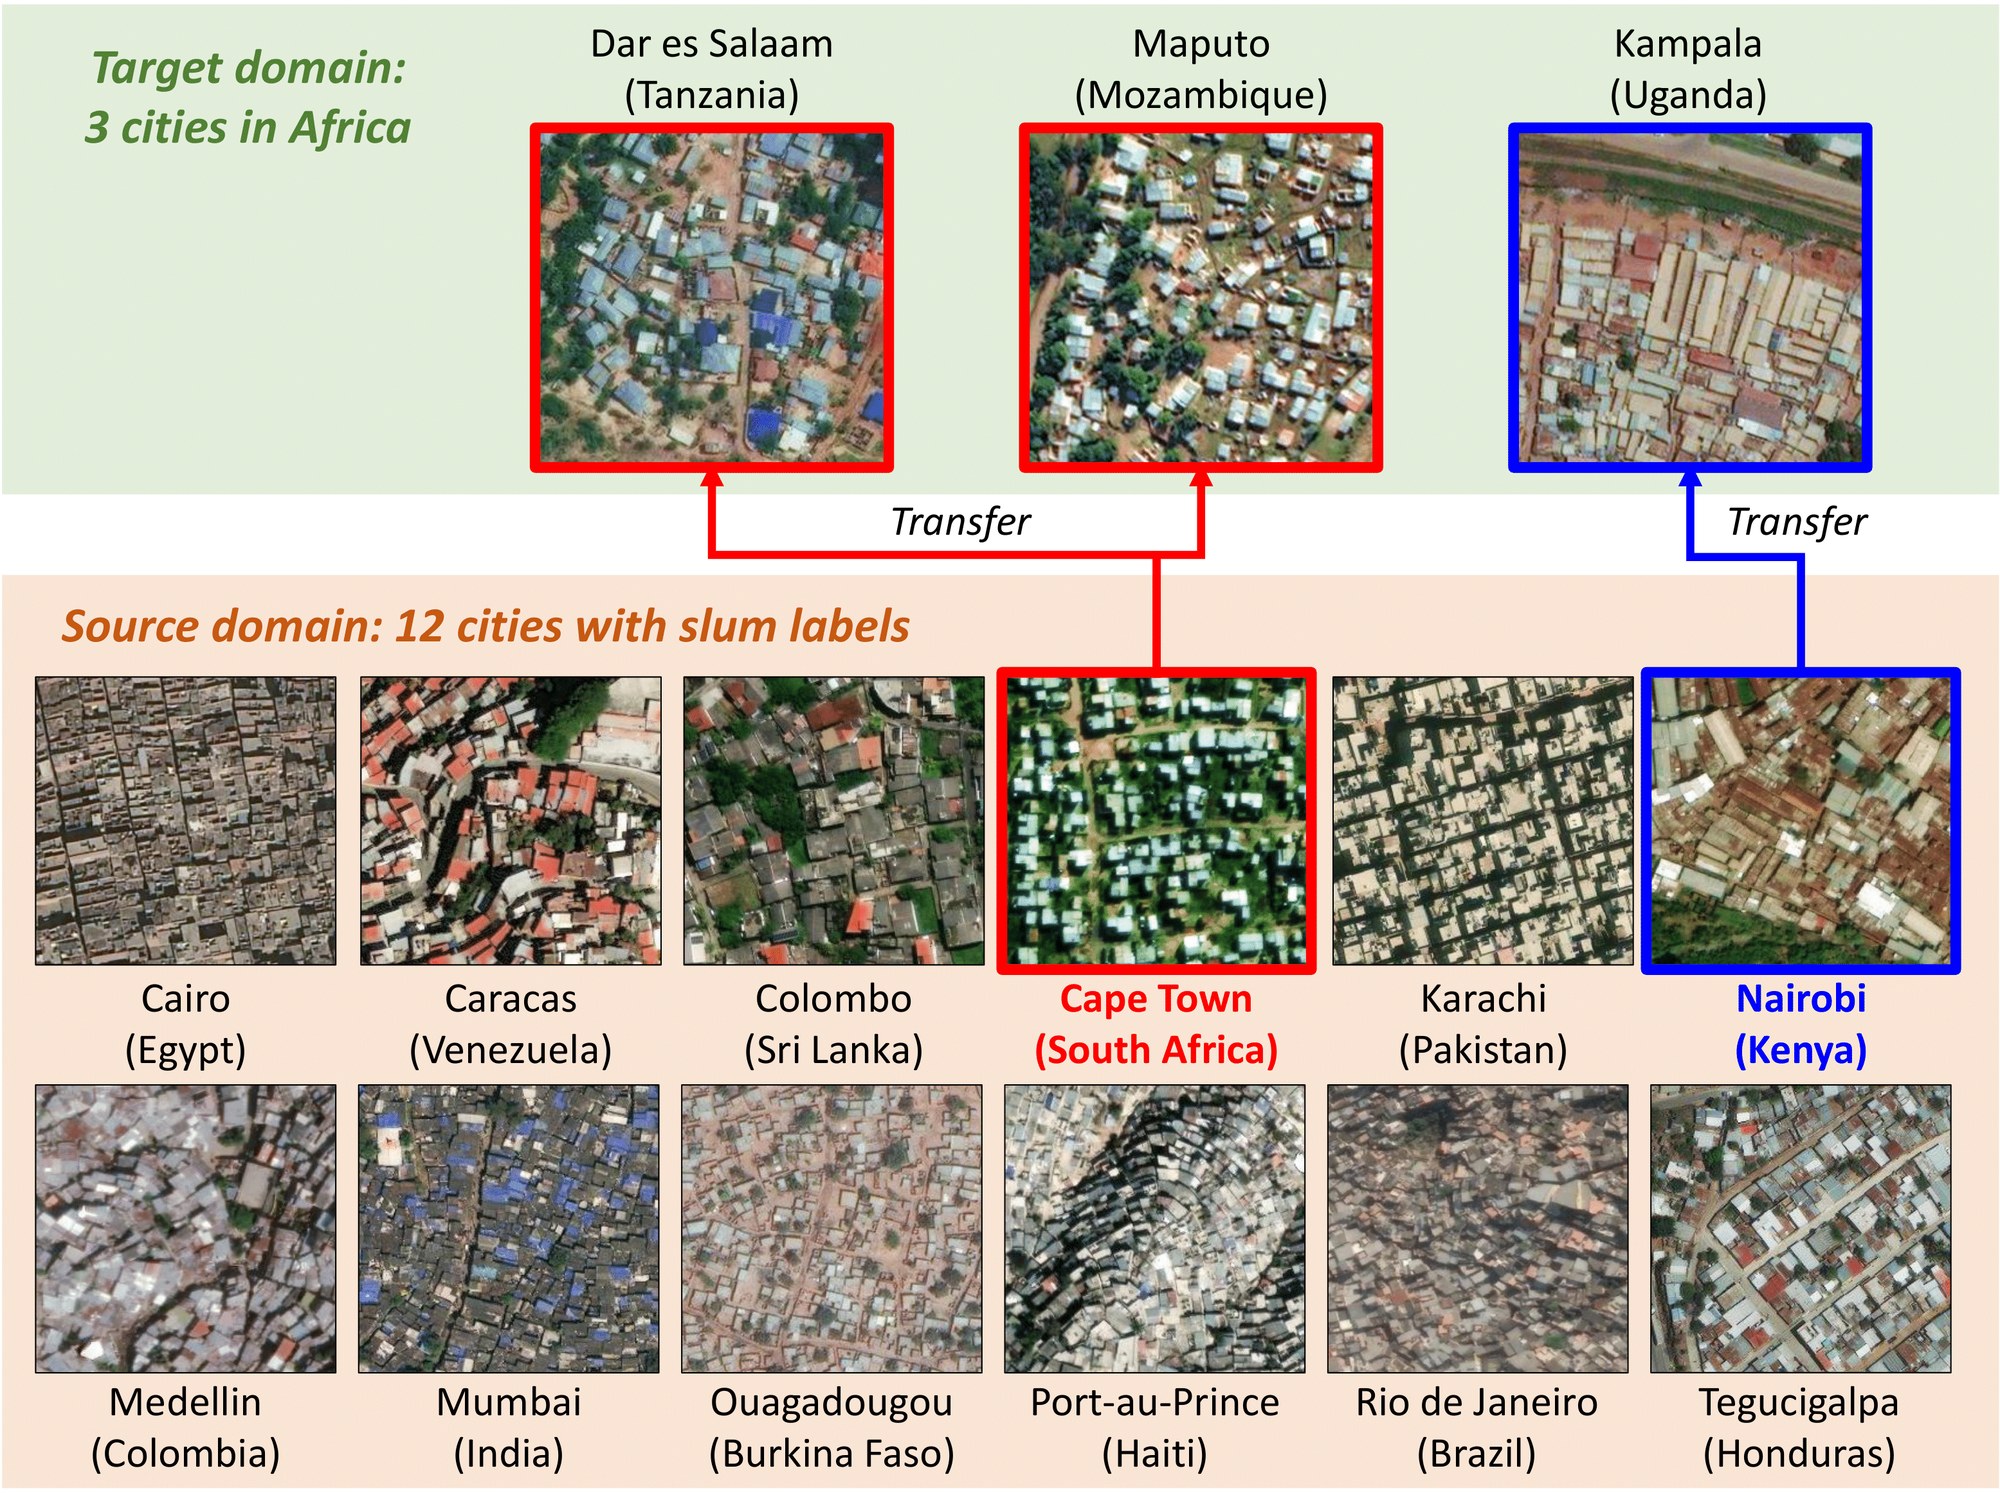
Figure 1: Our source domain spans 12 cities across four continents; the target domain covers three African cities. Morphological similarities guide the model to prioritize Cape Town features for detecting slums in Dar es Salaam and Maputo (red), and Nairobi features for Kampala (blue).
图 1:我们的源域覆盖四大洲的 12 座城市;目标域是三座非洲城市。形态上的相近关系会引导模型优先使用开普敦的特征来检测达累斯萨拉姆和马普托的贫民窟(红色),并用内罗毕的特征来检测坎帕拉的贫民窟(蓝色)。
Despite continued efforts, the worsening socioeconomic conditions in slums continue to present substantial challenges (Kohli et al. 2012). Measuring these conditions is complex, as the physical form and living conditions vary widely—not only across continents but also within individual countries—reflecting differences in geography, governance, cultural norms, and historical trajectories of urbanization (Taubenböck and Kraff 2014). These localized differences make it difficult to apply standardized criteria for identification and comparison, thereby complicating conventional data collection methods (Yang et al. 2025a). A key limitation of traditional approaches to identifying slum settlements—such as surveys, censuses, and field assessments—is their variability in definitions and implementation. These methods differ across countries in how they conceptualize “slum,” the spatial scales they employ, and the degree to which political and institutional factors shape data collection. They are also resource-intensive to conduct. As a result, global estimates remain uneven, and cross-national comparisons are constrained by divergent definitions, methodologies, and practices on the ground (Simon 2011).
尽管相关工作一直在推进,贫民窟里持续恶化的社会经济状况仍带来很大困难 (Kohli et al. 2012)。度量这些状况并不容易,因为物质形态和居住条件差异很大,不仅跨大陆如此,在同一国家内部也是如此,这反映了地理、治理、文化规范和城市化历史路径的不同 (Taubenböck and Kraff 2014)。这些地方性差异使标准化的识别与比较标准难以直接套用,也让传统数据采集方法更加复杂 (Yang et al. 2025a)。调查、普查和实地评估等传统识别方式的一个关键局限,是定义和实施并不统一。各国对“贫民窟”的概念、采用的空间尺度,以及政治与制度因素对数据采集的影响都不一样,而且这些方法本身耗资费力。因此,全球估计仍然不均衡,跨国比较也受到定义、方法和实地操作差异的限制 (Simon 2011)。
Recent research has increasingly turned to satellite data and deep learning to measure urban deprivation (Kuffer et al. 2016). High-resolution remote sensing data provide a globally accessible, frequently updated, and non-intrusive source of information, while convolutional neural networks and other computer vision techniques have shown promise in detecting spatial patterns associated with slum conditions (Kit and Lüdeke 2013; Wurm et al. 2019; Duque et al. 2017). Although promising, developing a computational approach is non-trivial due to visual heterogeneity (Verma et al. 2019; Stark et al. 2020). Models trained on imagery from one country fail to generalize to other regions, as architectural styles, building materials, and spatial organization of slums differ (Figure 1). As a result, cross-country and regional applications suffer from limited transferability and unreliable performance (Stark et al. 2024).
近来,越来越多研究转向用卫星数据和深度学习来度量城市剥夺 (Kuffer et al. 2016)。高分辨率遥感数据可以全球获取、更新较勤,也不必进入现场;卷积神经网络和其他计算机视觉方法,则在检测与贫民窟状况相关的空间模式上显示出潜力 (Kit and Lüdeke 2013; Wurm et al. 2019; Duque et al. 2017)。前景虽然不错,但由于视觉差异很大,要做成一套计算方法并不简单 (Verma et al. 2019; Stark et al. 2020)。在一个国家的影像上训练的模型,往往无法泛化到其他地区,因为贫民窟的建筑风格、建材和空间组织并不相同(图 1)。因此,跨国和跨区域应用的可迁移性有限,表现也不稳定 (Stark et al. 2024)。
To transfer knowledge from labeled source regions to unlabeled targets, we propose GRAM, a test-time adaptation (TTA) framework for slum segmentation. Unlike conventional methods that require annotated samples for targets, GRAM dynamically adapts a model pre-trained on source domains to the distributional characteristics of the test imagery for cross-regional generalization. To implement this idea, we construct a new slum segmentation dataset from very-high-resolution (VHR) satellite imagery of 12 cities in four continents, each representing distinct morphological, architectural, and socio-spatial patterns of informal settlements. These cities encompass diverse urban forms and regional contexts, offering a strong foundation for learning transferable representations. Using this multi-continent dataset and adaptation at inference time, we show how GRAM bridges the gap between universal slum definitions and region-specific visual characteristics.
为了把有标注源区域上的知识迁移到无标注目标区域,我们提出 GRAM,这是一个用于贫民窟分割的测试时适应(TTA)框架。与需要目标域标注样本的常规方法不同,GRAM 会把在源域上预训练好的模型,按测试影像的分布特征做动态适应,以实现跨区域泛化。为实现这一思路,我们基于 12 座城市、四大洲的甚高分辨率(VHR)卫星影像,构建了一套新的贫民窟分割数据集。这些城市各自代表不同的形态、建筑和社会空间模式,城市形态和区域背景多样,有助于学习可迁移的表征。借助这套跨大陆数据集,并在推理时做适应,我们展示了 GRAM 如何在通用的贫民窟定义与各地特有的视觉特征之间建立桥梁。
The framework comprises two distinct training components. The first is the source model training phase, where Mixture-of-Experts (MoE) layers are integrated into the segmentation backbone. This architecture organizes the model into expert groups specialized in learning region-specific slum characteristics, while a shared backbone captures universal features across all regions. The second component is the target adaptation phase. For each unlabeled target image, a classifier identifies the source region with the most similar visual characteristics. The pseudo-label generated from that corresponding expert is used as a primary prediction. The model then assesses the image’s reliability by evaluating the consistency of this reference against the predictions from all other experts. Images with the highest cross-expert agreement, measured by a “stability score,” are selected as reliable, effectively filtering out noise from uncertain pseudo-labels before the model is fine-tuned.
该框架包含两个相互区分的训练部分。第一部分是源模型训练阶段,把混合专家(MoE)层接入分割主干。这一结构把模型组织成若干专家组,专门学习各地区特有的贫民窟特征,同时由共享主干捕捉所有区域共有的特征。第二部分是目标适应阶段。对每张无标注的目标影像,分类器会找出视觉特征最相近的源区域,并采用对应专家生成的伪标签作为主要预测。模型再把这一参照与其余所有专家的预测做一致性比较,以评估该影像是否可靠。跨专家一致性最高、也就是“稳定性分数”最高的影像会被选为可靠样本,从而在微调之前滤掉不确定伪标签带来的噪声。
We validate GRAM using a diverse benchmark of slum segmentation tasks in three African cities with distinct urban morphologies and socio-spatial patterns. Our model consistently outperforms state-of-the-art baselines in low-resource settings, demonstrating its potential as a scalable and label-efficient solution for slum monitoring. These findings highlight the practical value of TTA for enabling more inclusive, data-driven urban development policies.
我们在三座非洲城市上验证 GRAM,这些城市的城市形态和社会空间模式各不相同,构成一套多样的贫民窟分割基准。在低资源设定下,我们的模型持续优于现有先进基线,显示出它作为可扩展、标注需求较低的贫民窟监测方案的潜力。这些结果也说明,TTA 有助于支撑更具包容性、由数据驱动的城市发展政策。
Satellite Data
卫星数据
Satellite imagery provides a scalable and efficient alternative to traditional ground-based surveys of slums (Ahn et al. 2023; Han et al. 2020a; Han et al. 2020b). Early approaches relied on proxy indicators, such as nighttime light intensity, to infer socioeconomic conditions from medium-resolution data (Jean et al. 2016; Park et al. 2022). With advances in deep learning and VHR imagery, subsequent research shifted toward pixel-level segmentation. For example, convolutional neural networks (CNNs) have been adapted for semantic segmentation of slum areas (Lumban-Gaol et al. 2023). Comparative studies have assessed various deep learning models in capturing the distinctive morphological characteristics of informal settlements, such as high-density and irregularly shaped structures (Gadiraju et al. 2018; Leonita et al. 2018). Transfer learning (Verma et al. 2019; Wurm et al. 2019), semi-supervised learning (Rehman et al. 2022; Lin et al. 2024), and foundation model (Zhang et al. 2024) have also been applied, enabling models trained on large-scale datasets to adapt to slum segmentation tasks with limited labels.
卫星影像为传统的贫民窟地面调查提供了一种可扩展、效率更高的替代方案 (Ahn et al. 2023; Han et al. 2020a; Han et al. 2020b)。早期方法依赖夜光强度等代理指标,从中等分辨率数据推断社会经济状况 (Jean et al. 2016; Park et al. 2022)。随着深度学习和甚高分辨率影像的发展,后续研究转向像素级分割。例如,卷积神经网络(CNN)已被改用于贫民窟区域的语义分割 (Lumban-Gaol et al. 2023)。比较研究评估了各类深度学习模型在捕捉非正规住区独特形态特征方面的能力,例如高密度、形状不规则的建筑 (Gadiraju et al. 2018; Leonita et al. 2018)。迁移学习 (Verma et al. 2019; Wurm et al. 2019)、半监督学习 (Rehman et al. 2022; Lin et al. 2024) 和基础模型 (Zhang et al. 2024) 也被应用进来,使在大规模数据上训练的模型,能够在标注有限的情况下适应贫民窟分割任务。
In terms of data quality, both high- and medium-resolution imagery are being used for slum detection. One study explored the trade-offs between spatial detail and data accessibility (Verma et al. 2019). Low-resolution multispectral data have also helped extend coverage in areas lacking VHR imagery (Gram-Hansen et al. 2019). Additionally, machine learning–based slum mapping supports urban improvement efforts and enables monitoring of informal settlement dynamics over time (Leonita et al. 2018; Maiya and Babu 2018; Yang et al. 2025b). Despite recent advances, segmenting slum settlements remains difficult due to significant variation in urban morphology across geographies. The scarcity of large-scale, pixel-level annotated datasets limits the development of fully supervised models. This constraint continues to drive research into developing new approaches including TTA that leverages abundant unlabeled satellite imagery to address data gaps.
在数据质量方面,高分辨率和中等分辨率影像都被用于贫民窟检测。有研究探讨了空间细节与数据可获取性之间的取舍 (Verma et al. 2019)。低分辨率多光谱数据也被用来,在缺少甚高分辨率影像的地区扩大覆盖范围 (Gram-Hansen et al. 2019)。此外,基于机器学习的贫民窟制图可以支持城市改善工作,并监测非正规住区随时间的变化 (Leonita et al. 2018; Maiya and Babu 2018; Yang et al. 2025b)。尽管近来进展不少,由于各地城市形态差异很大,分割贫民窟住区仍然困难。缺少大规模、像素级标注数据集,限制了全监督模型的发展。这一约束继续推动人们研究新方法,包括利用大量无标注卫星影像来弥补数据缺口的测试时适应(TTA)。
Test-Time Adaptation (TTA)
测试时适应(TTA)
Unsupervised domain adaptation improves model generalization by adapting a model trained on labeled data to a different, unlabeled domain with similar structure but differing data distribution. TTA builds on this idea under the stricter constraint that the source data is inaccessible during adaptation. Instead, TTA methods adapt a pre-trained source model during inference using only the test sample data (Ahn et al. 2025; Liang et al. 2025).
无监督域适应通过把在有标注数据上训练的模型,适配到结构相近但数据分布不同的无标注域,来提高泛化能力。测试时适应(TTA)在此基础上加上更严的约束:适应过程中无法再访问源数据。相反,TTA 方法只利用测试样本,在推理过程中适配已经预训练好的源模型 (Ahn et al. 2025; Liang et al. 2025)。
Two widely used strategies include batch normalization (BN) adaptation and entropy minimization. In BN-based approaches (Nado et al. 2020), the running statistics of the BN layers, originally computed during training, are updated using statistics from the target data, without requiring gradient computation (Ioffe and Szegedy 2015). This provides a lightweight yet effective adaptation mechanism. Entropy-based methods aim to reduce the task uncertainty by minimizing the entropy of predictions on target samples. A typical approach is to fine-tune parameters, such as the affine components of BN layers, through backpropagation at test time (Wang et al. 2021). While both strategies perform well on static domains, they face challenges in dynamic environments where target distributions shift over time or multiple domains are encountered sequentially. Under such conditions, performance tends to degrade due to accumulated errors and catastrophic forgetting. Recent work has explored continual adaptation to enhance model robustness across evolving and diverse target domains (Wang et al. 2022; Lee et al. 2024).
两类常用策略是批归一化(BN)适应和熵最小化。在基于 BN 的方法中 (Nado et al. 2020),原先在训练阶段计算的 BN 层运行统计量,会用目标数据上的统计量来更新,而不需要计算梯度 (Ioffe and Szegedy 2015)。这提供了一种轻量但有效的适应机制。基于熵的方法则希望通过最小化目标样本预测的熵,来降低任务不确定性。一种典型做法是在测试时通过反向传播微调参数,例如 BN 层的仿射分量 (Wang et al. 2021)。这两类策略在静态域上表现不错,但在目标分布随时间变化、或多个域依次出现的动态环境中会遇到困难。在这类条件下,误差累积和灾难性遗忘往往会使性能下降。近期工作开始探索持续适应,以增强模型在不断变化、多样化的目标域上的稳健性 (Wang et al. 2022; Lee et al. 2024)。
Data
数据
For detecting slums, we construct a diverse labeled dataset of 12 cities listed below to cover a broad representation of urban morphologies and socio-economic conditions:
为检测贫民窟,我们构建了覆盖下列 12 座城市的多样化标注数据集,以较广地代表不同的城市形态和社会经济状况:
- • Africa (4 cities): Cairo in Egypt, Cape Town in South Africa, Nairobi in Kenya, Ouagadougou in Burkina Faso
- • 非洲(4 座城市):埃及开罗、南非开普敦、肯尼亚内罗毕、布基纳法索瓦加杜古
- • Asia (3 cities): Colombo in Sri Lanka, Karachi in Pakistan, and Mumbai in India
- • 亚洲(3 座城市):斯里兰卡科伦坡、巴基斯坦卡拉奇,以及印度孟买
- • South America (3 cities): Caracas in Venezuela, Medellín in Colombia, and Rio de Janeiro in Brazil
- • 南美洲(3 座城市):委内瑞拉加拉加斯、哥伦比亚麦德林,以及巴西里约热内卢
- • Central America (2 cities): Port-au-Prince in Haiti, and Tegucigalpa in Honduras
- • 中美洲(2 座城市):海地太子港,以及洪都拉斯特古西加尔巴
Satellite imagery of these selected urban centers, sourced from the ESRI World Imagery Wayback[^1], is preprocessed into uniform 256256-pixel tiles at zoom level 16, corresponding to an approximate spatial resolution of 1.2 meters per pixel, subject to latitudinal variation.
这些城市中心的卫星影像来自 ESRI World Imagery Wayback[^1],被预处理为统一的 像素瓦片,缩放等级为 16,对应的空间分辨率约为每像素 1.2 米,并会随纬度变化。
Ground-truth annotations are from the Atlas of Informality (Samper 2025), a global mapping initiative that documents the growth and transformation of informal settlements. We supplemented the labels with city-specific datasets (University of Edinburgh 2020; Earth Observation for Sustainable Development 2018; Slum Rehabilitation Authority 2016; Alcaldia de Medellin 2010; Prefeitura da Cidade do Rio de Janeiro 2021), each of which provides spatial delineations of informal settlements. Based on this resource, binary masks are manually generated by geography experts, where pixels corresponding to informal housing areas are assigned a value of 1, and all remaining pixels are set to 0. Each annotation is spatially aligned with its corresponding satellite tile, resulting in a 1256256 label image. An illustrative example is provided in Figure 2.
真值标注来自 Atlas of Informality (Samper 2025),这是一项记录非正规住区生长与演变的全球制图计划。我们还用若干城市自己的数据作了补充 (University of Edinburgh 2020; Earth Observation for Sustainable Development 2018; Slum Rehabilitation Authority 2016; Alcaldia de Medellin 2010; Prefeitura da Cidade do Rio de Janeiro 2021),这些数据都提供了非正规住区的空间边界。据此,地理专家手工生成二值掩膜:对应非正规住房区域的像素赋值为 1,其余像素为 0。每份标注都与对应的卫星瓦片在空间上对齐,得到 的标签图像。图 2 给出了一个示意例子。
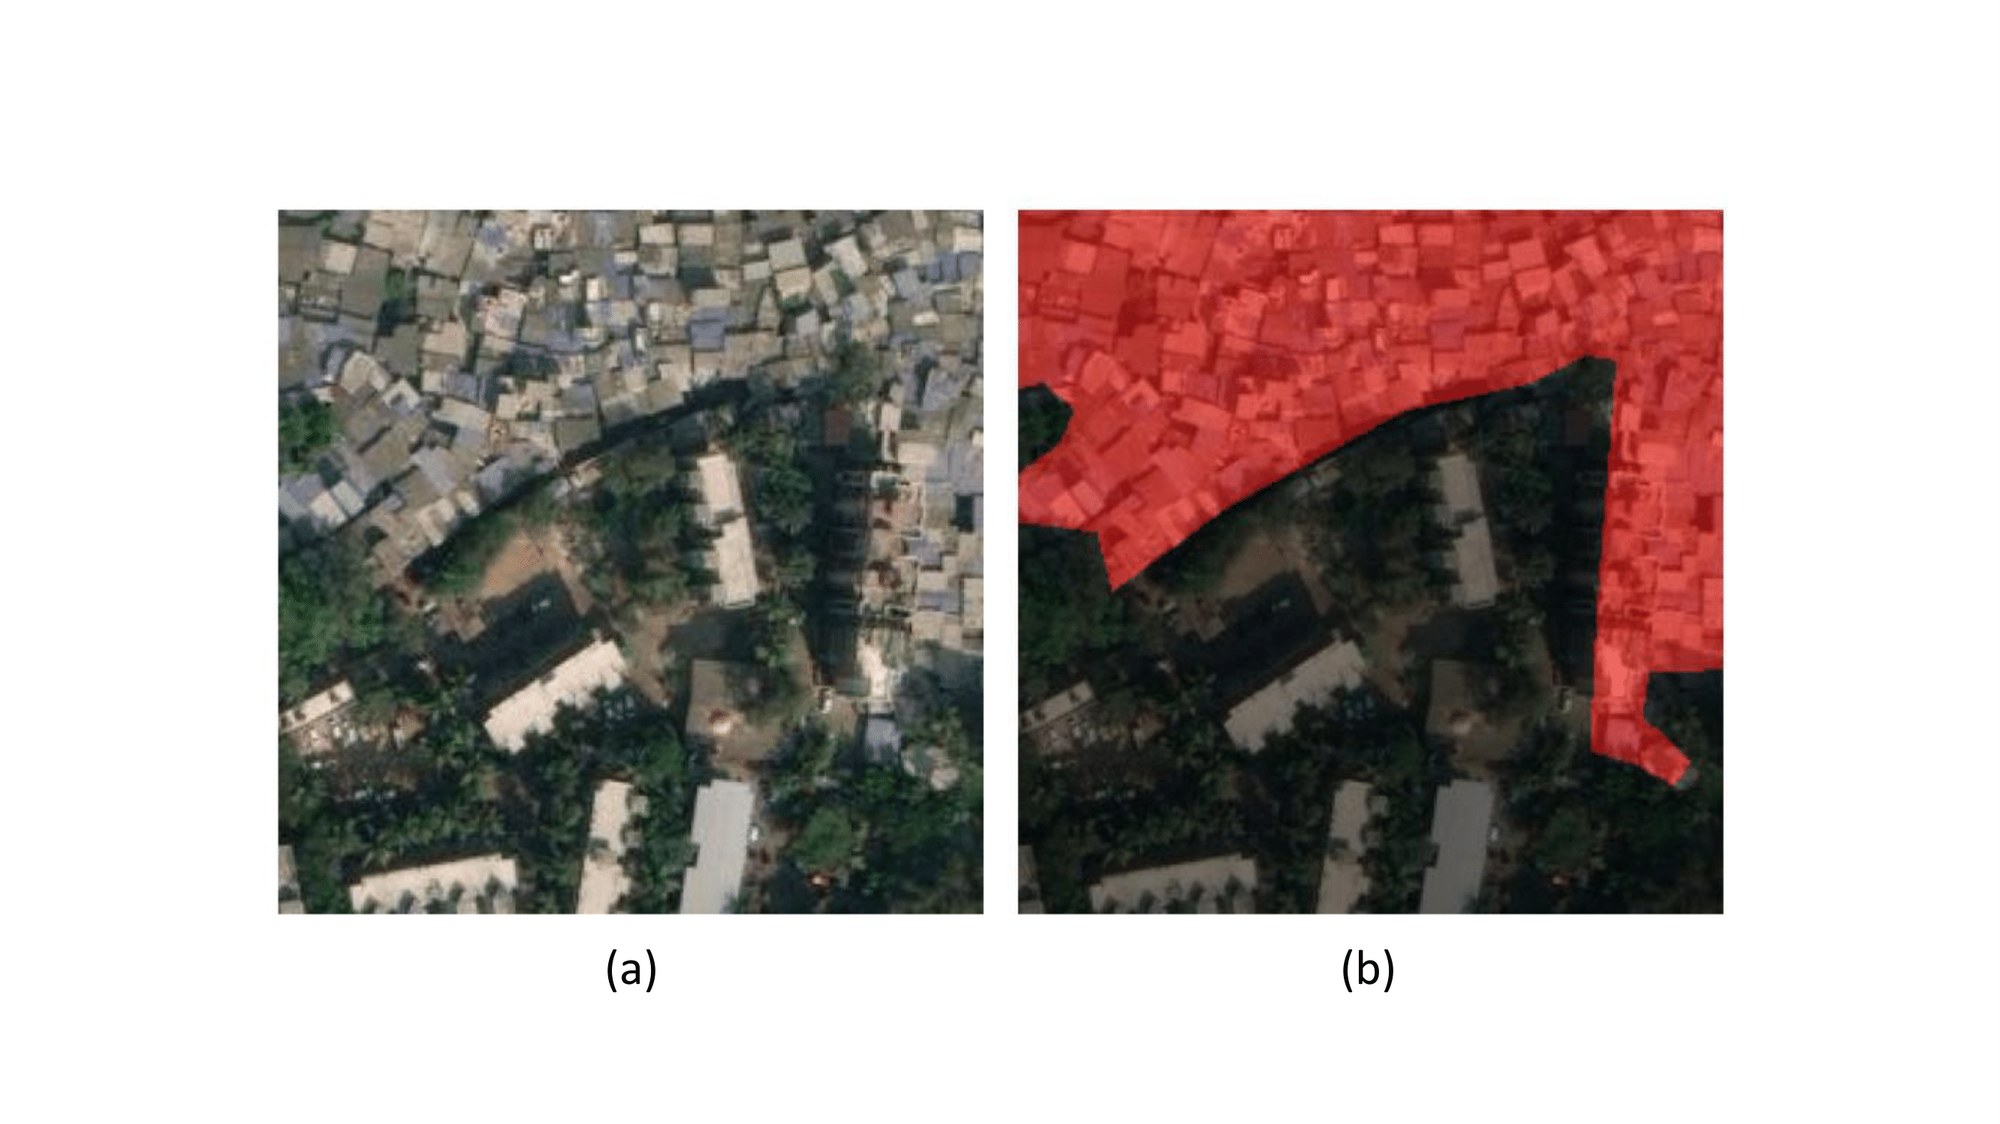
Figure 2: Example of labeled satellite imagery used for training. (a) Original satellite image tile. (b) Corresponding binary mask overlaid in red, indicating slum areas (label=1), while black regions denote non-slum areas (label=0).
图 2:用于训练的标注卫星影像示例。(a) 原始卫星影像瓦片。(b) 对应的二值掩膜以红色叠加,表示贫民窟区域(标签为 1),黑色区域表示非贫民窟(标签为 0)。
Using the manually labeled subset, we initially train a semi-supervised segmentation model based on the ST++ architecture (Yang et al. 2022). The model is trained on the full dataset comprising 2,714,489 image tiles, of which 86,752 have ground-truth annotations. This approach facilitates the integration of both labeled and unlabeled data to enhance segmentation performance under limited supervision. Subsequently, we use the model’s predictions to generate pseudo-labels across the dataset. These pseudo-labels are then used to supervise the training of a fully supervised baseline model, enabling the use of a broader and more heterogeneous image set.
我们先用人工标注的子集,基于 ST++ 架构训练一个半监督分割模型 (Yang et al. 2022)。模型在全部 2,714,489 张影像瓦片上训练,其中 86,752 张带有真值标注。这种方法可以把有标注和无标注数据结合起来,在监督有限时提升分割效果。随后,我们用该模型的预测在整套数据上生成伪标签,再用这些伪标签监督训练一个全监督基线模型,从而用上范围更广、差异更大的影像集合。
To test generalizability, we hold out a separate set of cities from the training process and use them exclusively for TTA and evaluation. This evaluation set comprises Dar es Salaam (Tanzania), Kampala (Uganda), and Maputo (Mozambique), totaling 529,633 image tiles, of which 17,536 are manually annotated using the AoI Database. The dataset details can be found in the Appendix.
为检验泛化能力,我们在训练过程中单独留出一组城市,只用于测试时适应和评估。该评估集包括坦桑尼亚达累斯萨拉姆、乌干达坎帕拉和莫桑比克马普托,共 529,633 张影像瓦片,其中 17,536 张依据 AoI 数据库做了人工标注。数据集细节见附录。
To facilitate further research in slum detection and urban analysis, we release the dataset utilized in this study publicly available. This release includes both manually annotated segmentation labels and GRAM-derived masks across our 12 training and 3 testing cities. As of 2025, these 15 cities have an aggregated population of 120,174,837, with 215,148 informal settlement polygons identified by GRAM. This extensive coverage enables robust, cross-regional analyses of urban informality at scale. Each image tile has a spatial resolution of 10 meters per pixel at 256256 pixels, with corresponding geospatial coordinates aligned to the satellite imagery.
为便于贫民窟检测和城市分析方面的后续研究,我们公开发布本研究所用的数据集。这次发布包括 12 座训练城市和 3 座测试城市上的人工分割标注,以及由 GRAM 得到的掩膜。截至 2025 年,这 15 座城市合计人口为 120,174,837,GRAM 识别出 215,148 个非正规住区多边形。这样的覆盖范围有助于在较大尺度上做稳健的跨区域非正规性分析。每张影像瓦片的空间分辨率为每像素 10 米,尺寸为 像素,并带有与卫星影像对齐的地理坐标。
Method
方法
Overview. Let denote the source training dataset and the target test dataset. Each sample in the source dataset is a triplet , where is a satellite image, is the corresponding ground truth slum segmentation mask, and is the region label, with denoting the total number of source regions. Our goal is to develop a TTA framework that enables a source-trained model to generalize effectively to unseen target region images .
概述。 记 为源训练数据集, 为目标测试数据集。源数据集中的每个样本是一个三元组 ,其中 是卫星影像, 是对应的贫民窟分割真值掩膜, 是区域标签, 表示源区域总数。我们的目标是建立一个测试时适应框架,使在源域上训练的模型能够有效泛化到未见过的目标区域影像 。
Slum segmentation poses substantial difficulties due to the high variability in visual characteristics across geographies, cultures, and imaging conditions. This heterogeneity hampers the ability of a single model to generalize across domains. We propose GRAM, a two-stage training framework leveraging a MoE architecture to enhance adaptability and robustness in diverse environments, as outlined below:
由于地理、文化和成像条件带来的视觉特征差异很大,贫民窟分割相当困难。这种异质性削弱了单一模型跨域泛化的能力。我们提出 GRAM,这是一个利用混合专家结构的两阶段训练框架,用以增强在多样环境中的适应能力和稳健性,步骤如下:
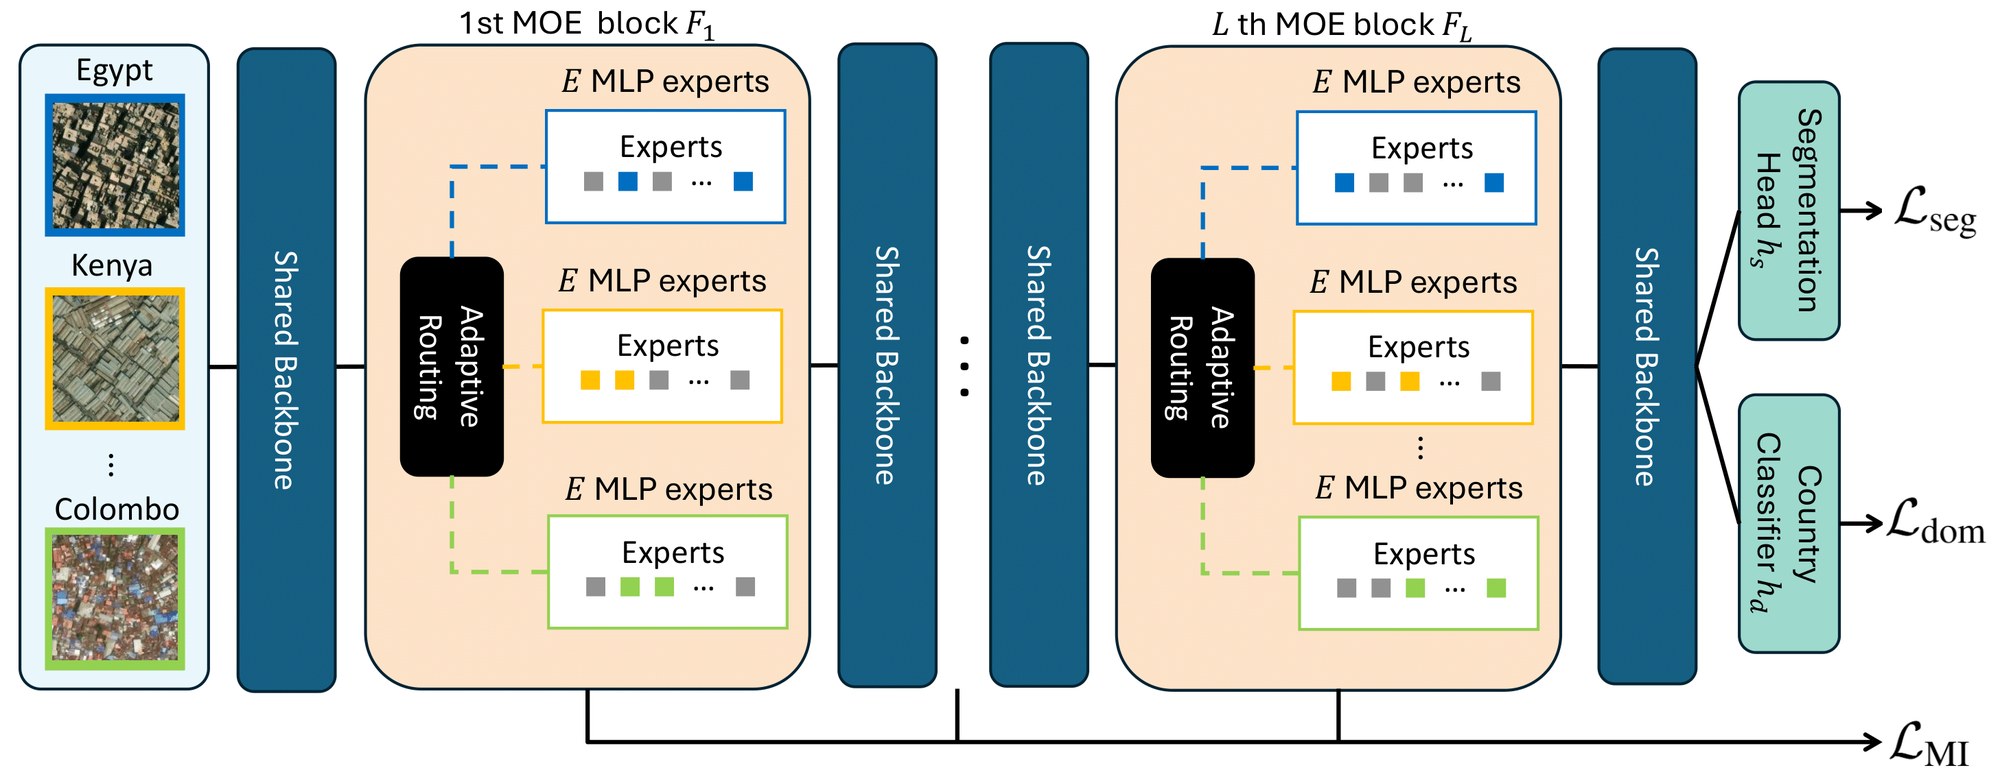
Figure 3: Overview of the Mixture-of-Experts (MoE) architecture in GRAM. The diagram illustrates the integration of lightweight MoE blocks into the transformer encoder, with region-specific gating networks dynamically routing token features to a top- subset of expert adapters .
图 3:GRAM 中混合专家(MoE)结构的概览。图中展示了如何把轻量 MoE 块 接入 Transformer 编码器,并由区域特定的门控网络 把词元特征 动态路由到 top- 个专家适配器 。
- • Step 1. Train the segmentation model using modular expert routing and region-aware learning on the multi-region slum dataset .
- • 步骤 1. 在多区域贫民窟数据集 上,用模块化的专家路由和区域感知学习,训练分割模型 。
- • Step 2. Adapt the model on using pseudo-labels generated with routing guided by an external classifier , filtering out unreliable labels via cross-region prediction consistency, and fine-tuning on a high-stability subset .
- • 步骤 2. 在 上适应模型 :用外部分类器 引导路由来生成伪标签,再按跨区域预测一致性滤掉不可靠标签,并在高稳定性子集 上微调。
Step 1. Source Training with Mixture-of-Experts
步骤 1. 用混合专家做源域训练
While slums often share common morphological features—such as dense roof coverage and spatial layout—they also display region-specific variations in roof materials and construction styles. To disentangle these localized features from globally shared representations, we integrate lightweight Mixture-of-Experts (MoE) blocks into intermediate layers of the transformer encoder, followed by a segmentation head (i.e., ), as illustrated in Figure 3. Each MoE block contains a set of lightweight MLP expert adapters , where is the number of experts. These experts capture region-specific slum characteristics, while the shared transformer backbone learns generalizable representations across diverse geographical contexts.
贫民窟常常具有一些共同的形态特征,例如稠密的屋顶覆盖和空间布局,但屋顶材料和建造风格也会因地区而异。为了把这些局部特征与全局共享表征分开,我们在 Transformer 编码器的 个中间层中插入轻量混合专家(MoE)块 ,后面再接分割头 (即 ),如图 3 所示。每个 MoE 块 包含一组轻量 MLP 专家适配器 ,其中 是专家数量。这些专家捕捉各地区特有的贫民窟特征,而共享的 Transformer 主干则在多样的地理背景中学习可泛化的表征。
Adaptive Expert Routing within MoE Blocks
To enable region-specific specialization, we initialize a lightweight gating network for each source region . Given a token feature extracted from an input image , each MoE block dynamically selects a top- subset of experts for using a noisy top- routing strategy. The gating network for region computes logits , where each element indicates the relevance of an expert for processing . To promote diversity and prevent overconfident expert selection (Chen et al. 2023), we add Gaussian noise to the logits:
MoE 块内的自适应专家路由
为了实现按区域的专门化,我们为每个源区域 初始化一个轻量门控网络 。给定从输入影像 中抽出的词元特征 ,每个 MoE 块采用带噪声的 top- 路由策略,为 动态选出一个 top- 专家子集。区域 的门控网络计算 logits ,其中每个分量表示某个专家处理 的相关程度。为了增加多样性并避免专家选择过于自信 (Chen et al. 2023),我们向 logits 加入高斯噪声:
After injecting noise, we select the top- experts with the highest scores. Then, a softmax is applied over just these top- scores to produce a normalized set of weights , which determine how much each selected expert contributes:
加入噪声后,我们选出分数最高的 top- 个专家。然后只在这 top- 个分数上做 softmax,得到一组归一化权重 ,用来决定每个入选专家的贡献:
where is the output of expert -th expert and reflects how much that expert should contribute for token . This routing mechanism allows the model to flexibly adapt to different region by selectively activating experts that are most relevant to the token’s region-specific context.
其中 是第 个专家的输出, 表示该专家应对词元 贡献多少。这一路由机制使模型能够灵活适应不同区域,有选择地激活与该词元的区域上下文最相关的专家。
Region-Aware Regularization
In a MoE setup, the model learns to route tokens to different experts. Without proper regularization, experts may converge to similar behaviors, undermining specialization. To encourage diversity, we introduce a mutual information (MI)-based regularization term that promotes distinct expert selections across regions.
区域感知正则
在 MoE 设定中,模型学习把词元路由到不同专家。如果没有适当的正则,专家可能收敛到相近的行为,削弱专门化。为了鼓励多样性,我们引入一项基于互信息(MI)的正则项,促使不同区域选择不同的专家。
During training, we estimate the joint distribution for -th MoE layer, representing the frequency of expert being selected for samples from region in that layer. The mutual information between domains and experts for each layer is:
训练时,我们估计第 个 MoE 层的联合分布 ,表示该层中来自区域 的样本被选到专家 的频率。每一层上域与专家之间的互信息为:
By maximizing for each layer, we encourage a strong dependence between the region and the selected experts, ensuring that different regions activate distinct sets of experts across the MoE blocks. This fosters expert specialization and prevents mode collapse, where experts learn redundant representations. To achieve this, we minimize the loss , which effectively maximizes the mutual information across all layers and promotes the desired domain-expert alignment.
通过最大化每一层的 ,我们鼓励区域与所选专家之间有较强依赖,从而保证不同区域在各个 MoE 块中激活不同的专家集合。这有助于专家专门化,并防止出现专家学到冗余表征的模式坍缩。为此,我们最小化损失 ,这实际上是在所有层上最大化互信息,并促进所期望的域—专家对齐。
Additionally, to complement the MI regularization and further promote expert specialization, we incorporate a lightweight region classifier into the training framework. This classifier operates on intermediate features extracted from the shared backbone, encouraging the model to learn domain-discriminative representations that enhance the dependence between cities and expert selections. It is trained to predict the region label using standard cross-entropy loss :
此外,为补充互信息正则并进一步促进专家专门化,我们在训练框架中加入一个轻量区域分类器 。该分类器作用在共享主干抽出的中间特征上,促使模型学习对域有判别力的表征,从而加强城市与专家选择之间的依赖。它用标准交叉熵损失 来预测区域标签:
where denotes the predicted region probabilities for the sample . This auxiliary supervision synergizes with the MI term by improving the quality of features used in routing, thereby preventing mode collapse and fostering region-specific expertise in the MoE layers.
其中 表示样本 的预测区域概率。这一辅助监督与互信息项相互配合,改善路由所用特征的质量,从而防止模式坍缩,并在 MoE 层中培养区域特定的专长。
Training Objectives
For segmentation supervision, we apply pixel-wise cross-entropy loss between the predicted segmentation map , and the ground truth . The segmentation loss over the entire source dataset is
训练目标
在分割监督上,我们对预测分割图 与真值 使用逐像素交叉熵损失。整个源数据集 上的分割损失为
where the cross entropy loss is averaged over all pixels and classes. Finally, the overall training objective combines segmentation accuracy, expert diversity, and domain awareness:
其中交叉熵损失 对所有像素和类别取平均。最后,总体训练目标把分割精度、专家多样性和域感知结合在一起:
where and are hyperparameters controlling the influence of each regularization component.
其中 和 是控制各项正则影响的超参数。
Step 2. Target Adaptation with Pseudo Label
步骤 2. 用伪标签做目标适应
Given the trained source model , we perform TTA on the target dataset by generating pseudo-labels for unlabeled target images. An external region classifier predicts the source region index most similar to the target region, which is used to guide the routing in predicts segmentation masks for samples in . The model is refined using self-training with these pseudo-labeled samples, minimizing a segmentation loss. However, the variability in slum characteristics introduces significant distribution shifts relative to the source data, potentially leading to unreliable pseudo-labels from the source model trained on a different distribution. To address this, we propose an image-level selection strategy that filters out the unreliable pseudo label via consistency of predictions across region-routed experts, followed by self-training to refine the model by minimizing a segmentation loss on the selected pseudo-labeled samples (Park et al. 2021; Yang et al. 2022).
在得到训练好的源模型 后,我们在目标数据集 上做测试时适应,为无标注的目标影像生成伪标签。外部分类器 预测与目标区域最相近的源区域索引,并用它来引导 中的路由,从而为 中的样本预测分割掩膜。模型再在这些伪标注样本上做自训练,最小化分割损失。不过,贫民窟特征的变异会相对于源数据引入显著的分布偏移,使在不同分布上训练的源模型可能给出不可靠的伪标签。为此,我们提出一种影像级选择策略:利用经区域路由的各专家预测的一致性,滤掉不可靠伪标签,再在入选的伪标注样本上最小化分割损失,用自训练来精炼模型 (Park et al. 2021; Yang et al. 2022)。
Adaptive Self-Training via Cross-Region Prediction Consistency
For a target sample , we first infer the target region index using the external classifier . Using this index , we generate a pseudo-labeled dataset as follows:
基于跨区域预测一致性的自适应自训练
对目标样本 ,我们先用外部分类器 推断目标区域索引 。利用该索引 ,按如下方式生成伪标注数据集 :
where outputs the predicted probabilities for source region indices, and where is the pseudo-mask generated by routing through region index .
其中 输出各源区域索引的预测概率, 是经区域索引 路由后生成的伪掩膜。
Next, we assess the uncertainty of each image by evaluating the consistency of predictions across different region-specific routings. The stability score for an image is computed as the mean intersection-over-union (mIoU) between the pseudo-label generated with and the pseudo-masks obtained from routing through all other source region indices . The stability score is defined as:
接下来,我们通过比较不同区域路由下的预测一致性,来评估每张影像的不确定性。影像 的稳定性分数 ,定义为用 生成的伪标签 ,与经所有其他源区域索引 路由得到的伪掩膜之间的平均交并比(mIoU)。稳定性分数定义为:
Finally, we construct the adaptive target dataset by selecting the most reliable images with the highest stability scores, constituting a fraction of the target dataset (i.e., ). The model is fine-tuned on using self-training, minimizing a pixel-wise cross-entropy loss:
最后,我们按稳定性分数选出最可靠的影像,构成目标数据集的比例 (即 ),从而得到自适应目标数据集 。模型在 上用自训练微调,最小化逐像素交叉熵损失:
Experiment
实验
We evaluate our model in terms of its generalizability for slum segmentation across domains, focusing on three African cities as unseen target regions.
我们从跨域贫民窟分割的泛化能力来评估模型,重点把三座非洲城市作为未见过的目标区域。
| Method | Dar es Salaam (Tanzania) | Kampala (Uganda) | Maputo (Mozambique) | |||||||||
|---|---|---|---|---|---|---|---|---|---|---|---|---|
| mIoU | F1-score | Precision | Recall | mIoU | F1-score | Precision | Recall | mIoU | F1-score | Precision | Recall | |
| Vanilla Source | 0.681 | 0.792 | 0.746 | 0.890 | 0.716 | 0.814 | 0.805 | 0.824 | 0.800 | 0.888 | 0.877 | 0.902 |
| MoE Source | 0.806 | 0.885 | 0.895 | 0.876 | 0.800 | 0.881 | 0.831 | 0.956 | 0.900 | 0.947 | 0.942 | 0.953 |
| SHOT | 0.712 | 0.813 | 0.847 | 0.786 | 0.713 | 0.810 | 0.846 | 0.782 | 0.813 | 0.895 | 0.890 | 0.901 |
| TENT | 0.691 | 0.800 | 0.755 | 0.889 | 0.716 | 0.814 | 0.809 | 0.819 | 0.802 | 0.889 | 0.878 | 0.903 |
| CoTTA | 0.762 | 0.853 | 0.857 | 0.850 | 0.821 | 0.900 | 0.894 | 0.908 | 0.821 | 0.900 | 0.895 | 0.905 |
| SAR | 0.700 | 0.807 | 0.764 | 0.889 | 0.748 | 0.843 | 0.829 | 0.859 | 0.804 | 0.890 | 0.881 | 0.900 |
| BeCoTTA | 0.741 | 0.836 | 0.900 | 0.793 | 0.844 | 0.911 | 0.965 | 0.866 | 0.904 | 0.949 | 0.938 | 0.965 |
| GRAM | 0.859 | 0.921 | 0.911 | 0.931 | 0.870 | 0.927 | 0.932 | 0.921 | 0.907 | 0.951 | 0.939 | 0.966 |
Table 1: Comparison of various metrics (mIoU, F1-score, Precision, Recall) across baseline and proposed methods in three regions: Dar es Salaam (Tanzania), Kampala (Uganda), and Maputo (Mozambique).
| 方法 | 达累斯萨拉姆(坦桑尼亚) | 坎帕拉(乌干达) | 马普托(莫桑比克) | |||||||||
|---|---|---|---|---|---|---|---|---|---|---|---|---|
| mIoU | F1 分数 | 精确率 | 召回率 | mIoU | F1 分数 | 精确率 | 召回率 | mIoU | F1 分数 | 精确率 | 召回率 | |
| 普通源模型 | 0.681 | 0.792 | 0.746 | 0.890 | 0.716 | 0.814 | 0.805 | 0.824 | 0.800 | 0.888 | 0.877 | 0.902 |
| MoE 源模型 | 0.806 | 0.885 | 0.895 | 0.876 | 0.800 | 0.881 | 0.831 | 0.956 | 0.900 | 0.947 | 0.942 | 0.953 |
| SHOT | 0.712 | 0.813 | 0.847 | 0.786 | 0.713 | 0.810 | 0.846 | 0.782 | 0.813 | 0.895 | 0.890 | 0.901 |
| TENT | 0.691 | 0.800 | 0.755 | 0.889 | 0.716 | 0.814 | 0.809 | 0.819 | 0.802 | 0.889 | 0.878 | 0.903 |
| CoTTA | 0.762 | 0.853 | 0.857 | 0.850 | 0.821 | 0.900 | 0.894 | 0.908 | 0.821 | 0.900 | 0.895 | 0.905 |
| SAR | 0.700 | 0.807 | 0.764 | 0.889 | 0.748 | 0.843 | 0.829 | 0.859 | 0.804 | 0.890 | 0.881 | 0.900 |
| BeCoTTA | 0.741 | 0.836 | 0.900 | 0.793 | 0.844 | 0.911 | 0.965 | 0.866 | 0.904 | 0.949 | 0.938 | 0.965 |
| GRAM | 0.859 | 0.921 | 0.911 | 0.931 | 0.870 | 0.927 | 0.932 | 0.921 | 0.907 | 0.951 | 0.939 | 0.966 |
表 1:在达累斯萨拉姆(坦桑尼亚)、坎帕拉(乌干达)和马普托(莫桑比克)三个区域上,比较各基线方法与本文方法在多项指标(mIoU、F1 分数、精确率、召回率)上的结果。
Performance Evaluation
性能评估
Implementation details
Adaptation is performed in a fully unsupervised setting, without access to any ground truth labels from the target domain. We use the SegFormer (Xie et al. 2021) backbone and train all models under identical settings using SGD with a learning rate of 0.0001 and momentum of 0.99. In our experiments, we set , , and . Please refer to the Appendix for additional details on training details. We release the code of our model to facilitate broader adoption and greater impact within the research community: https://github.com/DS4H-GIS/GRAM
实现细节
适应在完全无监督的设定下进行,无法获得目标域的任何真值标签。我们使用 SegFormer (Xie et al. 2021) 作为主干,并在相同设置下用 SGD 训练所有模型,学习率为 0.0001,动量为 0.99。实验中我们取 、、。更多训练细节见附录。为便于研究社区采用并扩大影响,我们发布了模型代码:https://github.com/DS4H-GIS/GRAM
Result
We compare its performance against several state-of-the-art TTA methods. The compared baselines include: (1) Vanilla Source: A standard segmentation model without MoE; (2) MoE Source: An MoE-based model without TTA; (3) SHOT (Liang et al. 2020): Aligns target features to a frozen source classifier via information maximization and self-supervised learning; (4) TENT (Wang et al. 2021): Adapts the model during inference by minimizing the prediction entropy by updating the batch normalization statistics; (5) CoTTA (Wang et al. 2022): A mean-teacher-based approach that incorporates stochastic weight restoration to mitigate error accumulation over time; (6) SAR (Niu et al. 2023): Improves robustness by optimizing the sharpness of the entropy surface; (7) BeCoTTA (Lee et al. 2024): Extends continual TTA with a MoE adapter architecture. We modify its target adaptation mechanism by incorporating our cross-region consistency sampling, which better leverages region-specific experts and filters unreliable pseudo-labels during target adaptation.
结果
我们把它的表现与若干先进的测试时适应方法进行比较。对照基线包括:(1) 普通源模型:不含 MoE 的标准分割模型;(2) MoE 源模型:基于 MoE、但不做测试时适应的模型;(3) SHOT (Liang et al. 2020):通过信息最大化和自监督学习,把目标特征对齐到冻结的源分类器;(4) TENT (Wang et al. 2021):在推理时通过更新批归一化统计量来最小化预测熵,从而适应模型;(5) CoTTA (Wang et al. 2022):一种基于均值教师的方法,加入随机权重恢复以减缓误差随时间累积;(6) SAR (Niu et al. 2023):通过优化熵曲面的锐度来提高稳健性;(7) BeCoTTA (Lee et al. 2024):用 MoE 适配器结构扩展持续测试时适应。我们把它的目标适应机制改成加入我们的跨区域一致性采样,以便更好地利用区域特定专家,并在目标适应时过滤不可靠伪标签。
Table 1 displays the performance with respect to mIoU, F1-score, precision, and recall. Our model consistently outperforms all evaluated baselines across multiple cities. The superior performance of the MoE Source over the Vanilla Source demonstrates that the MoE architecture enhances generalizability during the source training process. Although BeCoTTA outperforms other baselines, it inadequately captures target prediction reliability. These results highlight our model’s robustness and effectiveness in slum detection, particularly under severe cross-regional domain shifts. While conservative approaches (e.g., entropy regularization) suffice for limited shifts, they struggle in slum segmentation due to significant source-target divergences. In contrast, our self-training framework utilize pseudo-labels filtered by cross-expert consistency, enabling aggressive adaptation, noise robustness, and enhanced generalization in diverse urban contexts.
表 1 给出了 mIoU、F1 分数、精确率和召回率。我们的模型在多座城市上持续优于所有被评估的基线。MoE 源模型优于普通源模型,说明 MoE 结构在源域训练阶段就增强了泛化能力。BeCoTTA 虽然好于其他基线,但对目标预测可靠性的把握并不充分。这些结果突出了我们的模型在贫民窟检测中的稳健性和有效性,尤其是在跨区域域偏移很严重时。熵正则一类较为保守的做法,在偏移有限时也许够用,但由于源域与目标域差异很大,它们在贫民窟分割中会遇到困难。相比之下,我们的自训练框架使用由跨专家一致性过滤后的伪标签,能够进行更积极的适应,对噪声更稳健,并在多样的城市环境中增强泛化。
| Component | mIoU | F1-score | Precision | Recall |
|---|---|---|---|---|
| w/o | 0.836 | 0.906 | 0.876 | 0.944 |
| w/o | 0.734 | 0.823 | 0.898 | 0.786 |
| No Filtering | 0.818 | 0.893 | 0.910 | 0.878 |
| Confidence Filtering | 0.463 | 0.501 | 0.821 | 0.514 |
| Temporal Consistency | 0.837 | 0.907 | 0.884 | 0.933 |
| Full Component | 0.859 | 0.921 | 0.911 | 0.931 |
Table 2: Average performance across slum and non-slum classes for various ablation settings on Dar es Salaam
| 组件 | mIoU | F1 分数 | 精确率 | 召回率 |
|---|---|---|---|---|
| 去掉 | 0.836 | 0.906 | 0.876 | 0.944 |
| 去掉 | 0.734 | 0.823 | 0.898 | 0.786 |
| 不过滤 | 0.818 | 0.893 | 0.910 | 0.878 |
| 置信度过滤 | 0.463 | 0.501 | 0.821 | 0.514 |
| 时间一致性 | 0.837 | 0.907 | 0.884 | 0.933 |
| 完整组件 | 0.859 | 0.921 | 0.911 | 0.931 |
表 2:在达累斯萨拉姆上,不同消融设置下贫民窟与非贫民窟两类的平均表现
Ablation Study
To evaluate the contribution of each component within our framework, we conduct an ablation study on the Dar es Salaam region. Table 2 summarizes the average performance across slum and non-slum classes under different ablation settings. We evaluate five configurations: the first two examine modifications to source training, while the remaining three focus on the target adaptation phase.
消融实验
为评估框架中各组件的贡献,我们在达累斯萨拉姆地区做了消融实验。表 2 汇总了不同消融设置下,贫民窟与非贫民窟两类的平均表现。我们评估了五种配置:前两种考察对源域训练的修改,后三种聚焦目标适应阶段。
Removing either the domain alignment loss or the mutual information loss results in a performance decline, confirming the necessity of both components. The impact is particularly pronounced for , whose removal leads to a significant drop in mIoU (0.734) and F1-score (0.823), underscoring its central role in promoting expert consistency and preserving informative predictions.
去掉域对齐损失 或互信息损失 都会导致性能下降,说明这两个组件都有必要。影响在 上尤其明显:去掉后,mIoU 降到 0.734,F1 分数降到 0.823,凸显了它在促进专家一致、保留有信息量的预测上的核心作用。
We evaluate the impact of pseudo-label selection by comparing three strategies: no filtering, confidence-based filtering, and temporal consistency filtering. Omitting filtering results in moderate degradation, indicating that noisy pseudo-labels impair adaptation. Confidence-based filtering performs the worst (mIoU: 0.463), likely due to overconfidence under domain shift. Temporal consistency filtering enhances robustness by leveraging temporal agreement across source training checkpoints. (mIoU: 0.837, F1: 0.907). Our full method achieves the best performance (mIoU: 0.859, F1: 0.921), validating the effectiveness of combining mutual information regularization, domain alignment, and consistency-aware pseudo-labeling. See the Appendix for additional baseline comparisons and component analysis.
我们通过比较三种策略来评估伪标签选择的影响:不过滤、基于置信度的过滤,以及时间一致性过滤。省略过滤会带来中等程度的下降,说明嘈杂的伪标签会损害适应。基于置信度的过滤表现最差(mIoU 为 0.463),很可能是因为在域偏移下出现过度自信。时间一致性过滤利用源训练各检查点之间的时间一致性,提高了稳健性(mIoU 为 0.837,F1 为 0.907)。我们的完整方法取得最好结果(mIoU 为 0.859,F1 为 0.921),验证了把互信息正则、域对齐和考虑一致性的伪标注结合起来是有效的。更多基线比较和组件分析见附录。
Discussion
讨论
Region-Aware Routing Mirrors Visual Similarity
区域感知路由与视觉相似性相一致
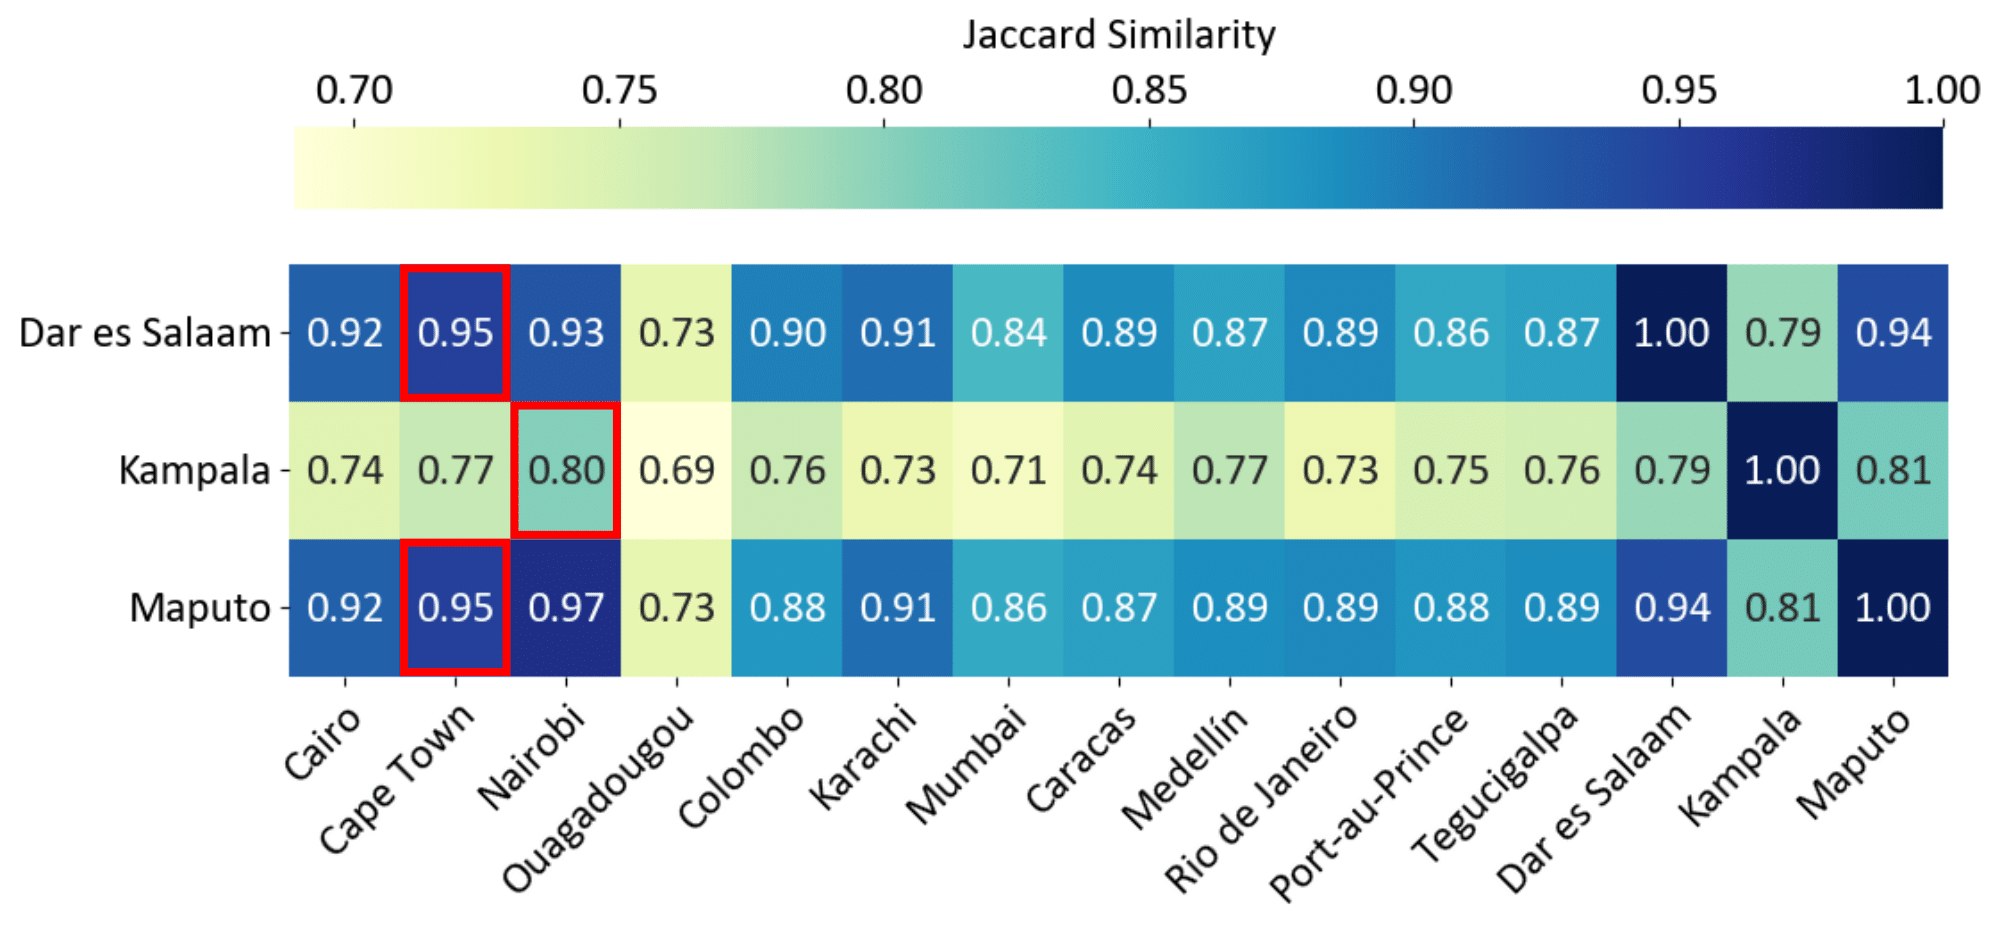
Figure 4: Jaccard similarity between the image sets of the three test cities (Dar es Salaam, Kampala, and Maputo) and those in the training set. Higher values indicate greater visual similarity in slum characteristics across cities. Red boxes denote the predictions made by the region classifier.
图 4:三座测试城市(达累斯萨拉姆、坎帕拉和马普托)的影像集合与训练集影像集合之间的 Jaccard 相似度。数值越高,表示城市之间贫民窟特征的视觉相似性越大。红框标出区域分类器给出的预测。
Starting from the data complexity of capturing heterogeneous geographical patterns of slums, our method leverages the Mixture-of-Experts architecture for region-specific specialization in slum segmentation. During target adaptation, we utilize the output of an external region classifier to identify the source region most visually similar to the target region. Target samples are then dynamically routed through the corresponding expert set to facilitate adaptation.
面对刻画贫民窟异质地理模式的数据复杂性,我们的方法利用混合专家结构,在贫民窟分割中实现按区域的专门化。在目标适应阶段,我们利用外部分类器 的输出,找出与目标区域视觉上最相近的源区域,再把目标样本动态路由到相应的专家集合,以促成适应。
To validate the effectiveness of this region-aware routing, we compute the Jaccard similarity between the image sets of source and target regions using visual features extracted from a pretrained CLIP model (Radford et al. 2021). Specifically, we extract features from all images in the source and target datasets, apply K-means clustering in the feature space to assign discrete cluster labels, and calculate the Jaccard similarity between the label sets for regions and . The results are visualized in Figure 4.
为验证这种区域感知路由的有效性,我们用预训练 CLIP 模型抽出的视觉特征,计算源区域与目标区域影像集合之间的 Jaccard 相似度 (Radford et al. 2021)。具体做法是:从源数据集和目标数据集的全部影像中提取特征,在特征空间中做 K-means 聚类以赋予离散簇标签,再计算区域 与 的标签集合之间的 Jaccard 相似度。结果见图 4。
Region pairs predicted by the classifier (highlighted in red boxes—for example, Dar es Salaam and Cape Town) consistently exhibit higher similarity scores, indicated by the darker shades within the boxes. This correlation further supports the visual coherence of the classifier’s predictions. These matched pairs also reflect real-world geographic and socio-spatial patterns. For instance, Cape Town, Dar es Salaam, and Maputo are coastal port cities, while Nairobi and Kampala are neighboring inland cities in East Africa. We can further associate the specific patterns of informal settlements with the examples shown in Figure 1: where Cape Town, Dar es Salaam, and Maputo share square-like and light-gray features, whereas those in Nairobi and Kampala tend to be more rectangular and rusty brown. Importantly, the classifier is trained without explicit geographic information, suggesting that these associations are derived solely from the visual characteristics of slum regions.
分类器预测的区域对(红框标出,例如达累斯萨拉姆与开普敦)始终具有更高的相似度分数,框内颜色也更深。这种对应进一步支持了分类器预测在视觉上是自洽的。这些匹配对也反映出真实的地理和社会空间模式。例如,开普敦、达累斯萨拉姆和马普托都是沿海港口城市,内罗毕和坎帕拉则是东非相邻的内陆城市。我们还可以把非正规住区的具体形态与图 1 中的例子联系起来:开普敦、达累斯萨拉姆和马普托具有偏方形、浅灰色的特征,内罗毕和坎帕拉则更偏向长方形和锈棕色。重要的是,分类器训练时并未使用显式的地理信息,说明这些关联完全来自贫民窟区域的视觉特征。
Slum Tracking Can Guide Policy
贫民窟追踪可以给政策提供参照
One of the goals of this work was to find a generalizable framework to help compute slum-related statistics for diverse regions where official data are scarce or unavailable. By applying our model to multi-temporal satellite imagery, stakeholders can now produce quantitative baseline estimates and monitor the evolution of informal settlements over time. For instance, our analysis revealed divergent trends in the three target cities: In Kampala, slum areas increased slightly from 8.4% in 2015 to 8.6% in 2023 (Figure 5); Maputo experienced a sharp increase, from 35.3% in 2016 to 41.2% in 2023; while Dar es Salaam experienced a gradual decrease from 17.3% in 2015 to 12.6% in 2022.
这项工作的目标之一,是找到一个可泛化的框架,帮助在官方数据稀缺或缺失的多样地区计算与贫民窟相关的统计量。把模型用到多时相卫星影像上,利益相关方现在可以给出定量的基线估计,并监测非正规住区随时间的演变。例如,我们的分析显示三座目标城市趋势并不相同:在坎帕拉,贫民窟面积占比从 2015 年的 8.4% 略升至 2023 年的 8.6%(图 5);马普托上升较快,从 2016 年的 35.3% 升至 2023 年的 41.2%;达累斯萨拉姆则从 2015 年的 17.3% 逐渐降至 2022 年的 12.6%。
These divergent outcomes are informative given that all three countries have experienced a comparable pace of economic growth. The ability to computationally track such nuanced, on-the-ground changes that broad economic indicators often overlook is tremendously valuable for urban policy making. Moreover, because the framework is label-efficient and required substantially little human effort compared to previous work, it can be scaled across a broader set of regions without requiring new, resource-intensive ground-truth data collection.
这三种不同走向之所以有信息量,是因为这三个国家的经济增长速度大体相当。能够从计算上追踪这类宽泛经济指标常常忽略的、落地的细微变化,对城市政策制定很有价值。此外,由于该框架对标注需求较低,所需人工也比以往工作少得多,它可以扩展到更广的地区,而不必再做耗资费力的新一轮地面真值采集。
This capability is a critical advantage, especially in low- and middle-income settings, where field surveys can be costly, politically sensitive, or logistically challenging. The ability to accurately identify areas of greatest need allows for a more strategic and targeted allocation of resources, which is paramount for effective data-driven interventions. Furthermore, by publicly releasing a computation method to assess the long-term impact of urban policies, the framework ultimately empowers local decision-makers with the actionable evidence needed to address urban poverty, even in the absence of traditional census data.
这一能力是一项关键优势,尤其是在中低收入环境中,实地调查可能成本高、政治敏感或后勤困难。准确识别需求最迫切的区域,有助于更有策略、更有针对性的资源配置,这对有效的数据驱动干预至关重要。此外,通过公开发布一套评估城市政策长期影响的计算方法,该框架最终能在缺少传统普查数据时,为地方决策者提供可用的证据,以应对城市贫困。
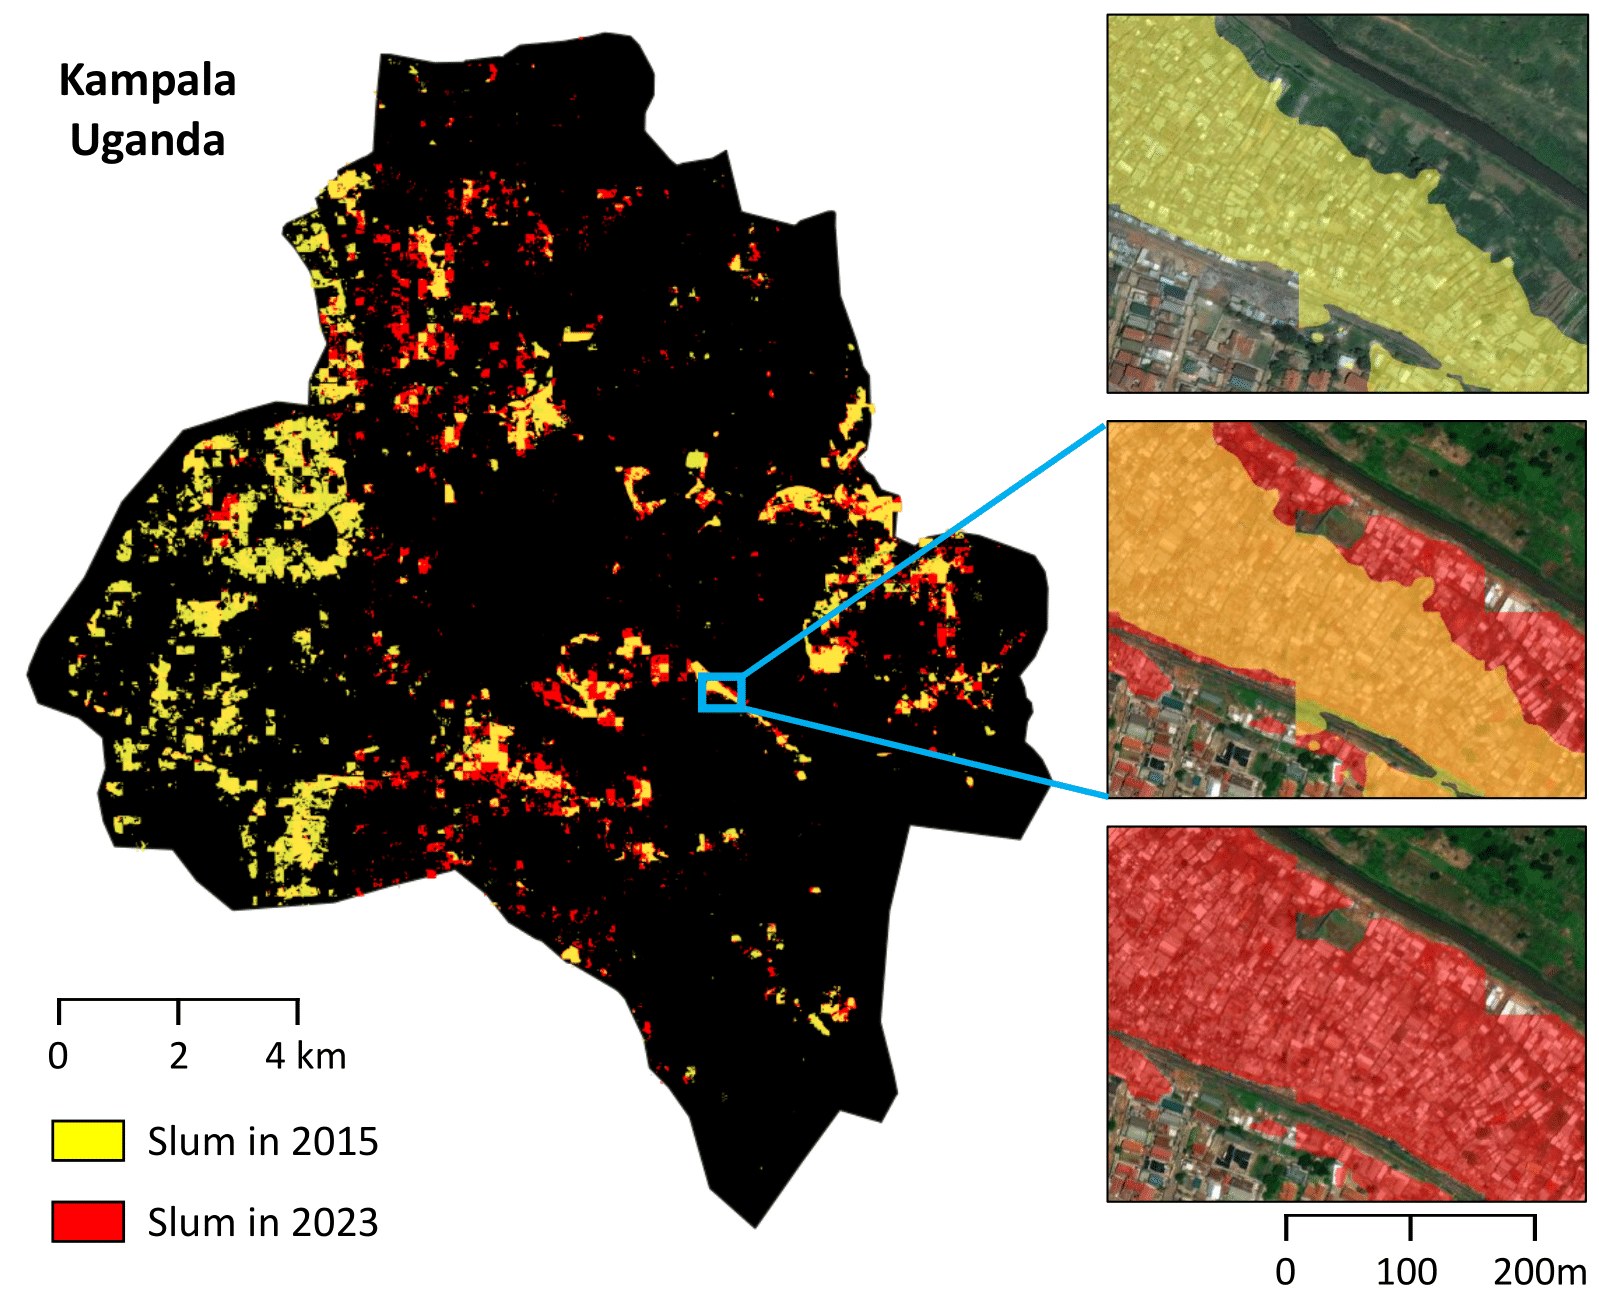
Figure 5: Slum segmentation results in Kampala in 2015 (yellow) and 2023 (red). Over the eight-year period, the slum ratio in the city increased from 8.4% to 8.6%.
图 5:坎帕拉 2015 年(黄色)和 2023 年(红色)的贫民窟分割结果。在这八年里,该市贫民窟占比从 8.4% 升至 8.6%。
Conclusion
结论
We present GRAM, a TTA framework for slum detection in unseen regions, designed to tackle domain shifts in cross-regional settings. By integrating an MoE architecture with adaptive routing and cross-country prediction consistency, GRAM captures both shared and region-specific features while filtering unreliable pseudo-labels during self-training. Experiments on three African cities show that GRAM outperforms state-of-the-art baselines, demonstrating its effectiveness as a scalable, label-efficient solution for global slum monitoring. This approach holds promise in supporting inclusive, data-driven urban policy and can be extended to broader geographic contexts in future work.
我们提出 GRAM,这是一个面向未见区域贫民窟检测的测试时适应框架,旨在应对跨区域设定中的域偏移。通过把 MoE 结构与自适应路由和跨国预测一致性结合起来,GRAM 既能捕捉共享特征也能捕捉区域特定特征,并在自训练中过滤不可靠的伪标签。在三座非洲城市上的实验表明,GRAM 优于现有先进基线,显示出它作为可扩展、标注需求较低的全球贫民窟监测方案是有效的。这一方法有望支持包容的、由数据驱动的城市政策,并可以在后续工作中扩展到更广的地理范围。
Acknowledgments
致谢
JKim was supported by the National Research Foundation of Korea (NRF) grant funded by the Korea government (MSIT) (No. RS-2022-NR068758 and RS-2025-00563196). We also thank the anonymous reviewers for their valuable comments and suggestions.
JKim 的工作得到韩国国家研究基金会(NRF)由韩国政府(MSIT)资助的项目支持(编号 RS-2022-NR068758 和 RS-2025-00563196)。我们也感谢匿名审稿人提出的宝贵意见和建议。
References
参考文献
Ahn et al. (2023) D. Ahn, J. Yang, M. Cha, H. Yang, J. Kim, S. Park, S. Han, E. Lee, S. Lee, and S. Park A human-machine collaborative approach measures economic development using satellite imagery . Nature Communications 14 ( 1 ), pp. 6811 . Cited by: Satellite Data .
Ahn et al. (2025) K. Ahn, S. Han, S. Park, J. Kim, S. Park, and M. Cha Generalizable disaster damage assessment via change detection with vision foundation model . In proc. of the 39th AAAI Conference on Artificial Intelligence , Vol. 39 , pp. 27784–27792 . Cited by: Test-Time Adaptation (TTA) .
Alcaldia de Medellin (2010) Alcaldia de Medellin Informal settlement map . Empresa de Desarrollio Urbano . Note: https://datacatalog.worldbank.org/search/dataset/0039832/Karachi–Pakistan—-Informal-Settlements–ESA-EO4SD-Urban- Cited by: Appendix A , Table S7 , Data .
Chen et al. (2023) Z. Chen, Y. Shen, M. Ding, Z. Chen, H. Zhao, E. G. Learned-Miller, and C. Gan Mod-squad: designing mixtures of experts as modular multi-task learners . In proc. of the 2023 Computer Vision and Pattern Recognition , pp. 11828–11837 . Cited by: Adaptive Expert Routing within MoE Blocks .
Duque et al. (2017) J. C. Duque, J. E. Patino, and A. Betancourt Exploring the potential of machine learning for automatic slum identification from vhr imagery . Remote Sensing 9 ( 9 ), pp. 895 . Cited by: Introduction .
Earth Observation for Sustainable Development (2018) Earth Observation for Sustainable Development Service operations report - karachi . European Space Agency . Note: https://datacatalog.worldbank.org/search/dataset/0039832/Karachi–Pakistan—-Informal-Settlements–ESA-EO4SD-Urban- Cited by: Appendix A , Table S7 , Data .
Gadiraju et al. (2018) K. K. Gadiraju, R. R. Vatsavai, N. Kaza, E. Wibbels, and A. Krishna Machine learning approaches for slum detection using very high resolution satellite images . In proc. of the 2018 IEEE International Conference on Data Mining Workshops , pp. 1397–1404 . Cited by: Satellite Data .
Gram-Hansen et al. (2019) B. J. Gram-Hansen, P. Helber, I. Varatharajan, F. Azam, A. Coca-Castro, V. Kopackova, and P. Bilinski Mapping informal settlements in developing countries using machine learning and low resolution multi-spectral data . In proc. of the 2019 AAAI/ACM Conference on AI, Ethics, and Society , pp. 361–368 . Cited by: Satellite Data .
Han et al. (2020a) S. Han, D. Ahn, H. Cha, J. Yang, S. Park, and M. Cha Lightweight and robust representation of economic scales from satellite imagery . In proc. of the 34th AAAI Conference on Artificial Intelligence , Vol. 34 , pp. 428–436 . Cited by: Satellite Data .
Han et al. (2020b) S. Han, D. Ahn, S. Park, J. Yang, S. Lee, J. Kim, H. Yang, S. Park, and M. Cha Learning to score economic development from satellite imagery . In proc. of the 26th ACM SIGKDD International Conference on Knowledge Discovery & Data Mining , pp. 2970–2979 . Cited by: Satellite Data .
Ioffe and Szegedy (2015) S. Ioffe and C. Szegedy Batch normalization: accelerating deep network training by reducing internal covariate shift . In proc. of the 32nd International Conference on International Conference on Machine Learning , pp. 448–456 . Cited by: Test-Time Adaptation (TTA) .
Jean et al. (2016) N. Jean, M. Burke, M. Xie, W. Davis, D. Lobell, and S. Ermon Combining satellite imagery and machine learning to predict poverty . Science 353 ( 6301 ), pp. 790–794 . Cited by: Satellite Data .
Kit and Lüdeke (2013) O. Kit and M. Lüdeke Automated detection of slum area change in hyderabad, india using multitemporal satellite imagery . ISPRS journal of photogrammetry and remote sensing 83 , pp. 130–137 . Cited by: Introduction .
Kohli et al. (2012) D. Kohli, R. Sliuzas, N. Kerle, and A. Stein An ontology of slums for image-based classification . Computers, environment and urban systems 36 ( 2 ), pp. 154–163 . Cited by: Introduction .
Kuffer et al. (2016) M. Kuffer, K. Pfeffer, and R. Sliuzas Slums from space—15 years of slum mapping using remote sensing . Remote Sensing 8 ( 6 ), pp. 455 . Cited by: Introduction .
Lee et al. (2024) D. Lee, J. Yoon, and S. J. Hwang BECoTTA: input-dependent online blending of experts for continual test-time adaptation . In proc. of the 41st International Conference on Machine Learning , pp. 27072–27093 . Cited by: Test-Time Adaptation (TTA) , Result .
Leonita et al. (2018) G. Leonita, M. Kuffer, R. Sliuzas, and C. Persello Machine learning-based slum mapping in support of slum upgrading programs: the case of bandung city, indonesia . Remote Sensing 10 ( 10 ). External Links: ISSN 2072-4292 Cited by: Satellite Data , Satellite Data .
Liang et al. (2025) J. Liang, R. He, and T. Tan A comprehensive survey on test-time adaptation under distribution shifts . International Journal of Computer Vision 133 ( 1 ), pp. 31–64 . Cited by: Test-Time Adaptation (TTA) .
Liang et al. (2020) J. Liang, D. Hu, and J. Feng Do we really need to access the source data? Source hypothesis transfer for unsupervised domain adaptation . In proc. of the 37th International Conference on Machine Learning , Vol. 119 , pp. 6028–6039 . Cited by: Result .
Lin et al. (2024) Y. Lin, X. Zhang, Y. Liu, Z. Han, Q. Liao, and Y. Li Long-term detection and monitory of chinese urban village using satellite imagery . In proc. of the 33rd International Joint Conferences on Artificial Intelligence , pp. 7349–7357 . Cited by: Appendix A , Satellite Data .
Lumban-Gaol et al. (2023) Y. A. Lumban-Gaol, A. Rizaldy, and M. Amadi Comparison of deep learning architectures for the semantic segmentation of slum areas from satellite images . The International Archives of the Photogrammetry, Remote Sensing and Spatial Information Sciences XLVIII-1/W2-2023 , pp. 1439–1444 . Cited by: Satellite Data .
Maiya and Babu (2018) S. R. Maiya and S. C. Babu Slum segmentation and change detection: a deep learning approach . External Links: 1811.07896 Cited by: Satellite Data .
Nado et al. (2020) Z. Nado, S. Padhy, D. Sculley, A. D’Amour, B. Lakshminarayanan, and J. Snoek Evaluating prediction-time batch normalization for robustness under covariate shift . External Links: 2006.10963 Cited by: Test-Time Adaptation (TTA) .
Niu et al. (2023) S. Niu, J. Wu, Y. Zhang, Z. Wen, Y. Chen, P. Zhao, and M. Tan Towards stable test-time adaptation in dynamic wild world . In proc. of the 2023 International Conference on Learning Representations , Cited by: Result .
Park et al. (2022) S. Park, S. Han, D. Ahn, J. Kim, J. Yang, S. Lee, S. Hong, J. Kim, S. Park, H. Yang, et al. Learning economic indicators by aggregating multi-level geospatial information . In proc. of the 36th AAAI Conference on Artificial Intelligence , Vol. 36 , pp. 12053–12061 . Cited by: Satellite Data .
Park et al. (2021) S. Park, S. Han, S. Kim, D. Kim, S. Park, S. Hong, and M. Cha Improving unsupervised image clustering with robust learning . In proc. of the 2021 Computer Vision and Pattern Recognition , pp. 12278–12287 . Cited by: Step 2. Target Adaptation with Pseudo Label .
Prefeitura da Cidade do Rio de Janeiro (2021) Prefeitura da Cidade do Rio de Janeiro Limite de favelas 2019 . Prefeitura da Cidade do Rio de Janeiro . Note: https://www.data.rio/datasets/limite-favelas-2019/explore Cited by: Appendix A , Table S7 , Data .
Radford et al. (2021) A. Radford, J. W. Kim, C. Hallacy, A. Ramesh, G. Goh, S. Agarwal, G. Sastry, A. Askell, P. Mishkin, J. Clark, G. Krueger, and I. Sutskever Learning transferable visual models from natural language supervision . In proc. of the 38th International Conference on Machine Learning , Cited by: Region-Aware Routing Mirrors Visual Similarity .
Rehman et al. (2022) M. F. U. Rehman, I. Aftab, W. Sultani, and M. Ali Mapping temporary slums from satellite imagery using a semi-supervised approach . IEEE Geoscience and Remote Sensing Letters 19 ( ), pp. 1–5 . Cited by: Appendix A , Satellite Data .
Samper (2025) J. Samper Atlas of informality . Note: https://www.atlasofinformality.com/ Accessed: 2025-11-13 Cited by: Appendix A , Table S7 , Table S7 , Table S7 , Table S7 , Table S7 , Table S7 , Table S7 , Table S7 , Table S7 , Table S7 , Data .
Simon (2011) D. Simon Situating slums: discourse, scale and place . City 15 ( 6 ), pp. 674–685 . Cited by: Introduction .
Slum Rehabilitation Authority (2016) Slum Rehabilitation Authority Georeferenced city survey plan of mumbai city & suburban district showing area boundaries of slum clusters . Slum Rehabilitation Authority, the Government of Maharashtra . Note: https://sra.gov.in/page/innerpage/gis-mis-slum-data.php Cited by: Appendix A , Table S7 , Data .
Stark et al. (2020) T. Stark, M. Wurm, X. X. Zhu, and H. Taubenböck Satellite-based mapping of urban poverty with transfer-learned slum morphologies . IEEE Journal of Selected Topics in Applied Earth Observations and Remote Sensing 13 , pp. 5251–5263 . Cited by: Introduction .
Stark et al. (2024) T. Stark, M. Wurm, X. X. Zhu, and H. Taubenböck Quantifying uncertainty in slum detection: advancing transfer-learning with limited data in noisy urban environments . IEEE Journal of Selected Topics in Applied Earth Observations and Remote Sensing. 17 , pp. 4552–4565 . Cited by: Introduction .
Taubenböck and Kraff (2014) H. Taubenböck and N. Kraff The physical face of slums: a structural comparison of slums in mumbai, india, based on remotely sensed data . Journal of Housing and the Built Environment 29 ( 1 ), pp. 15–38 . Cited by: Introduction .
UN-Habitat (2003) UN-Habitat The challenge of slums: global report on human settlements, 2003 . Routledge . Cited by: Introduction .
UN-Habitat (2025) UN-Habitat Urban indicators database . Note: https://data.unhabitat.org/ Accessed: 2025-11-13 Cited by: Introduction .
University of Edinburgh (2020) University of Edinburgh Dwelling outline - informal settlements of cape town, 2018 . School of Engineering. Infrastructure and Environment, University of Edinburgh . External Links: Document Cited by: Appendix A , Table S7 , Data .
Verma et al. (2019) D. Verma, A. Jana, and K. Ramamritham Transfer learning approach to map urban slums using high and medium resolution satellite imagery . Habitat International 88 , pp. 101981 . External Links: ISSN 0197-3975 Cited by: Introduction , Satellite Data , Satellite Data .
Wang et al. (2021) D. Wang, E. Shelhamer, S. Liu, B. Olshausen, and T. Darrell Tent: fully test-time adaptation by entropy minimization . In proc. of the 2021 International Conference on Learning Representations , Cited by: Test-Time Adaptation (TTA) , Result .
Wang et al. (2022) Q. Wang, O. Fink, L. Van Gool, and D. Dai Continual test-time domain adaptation . In proc. of the 2022 Computer Vision and Pattern Recognition , Cited by: Test-Time Adaptation (TTA) , Result .
Wurm et al. (2019) M. Wurm, T. Stark, X. X. Zhu, M. Weigand, and H. Taubenöck Semantic segmentation of slums in satellite images using transfer learning on fully convolutional neural networks . ISPRS Journal of Photogrammetry and Remote Sensing 150 , pp. 59–69 . Cited by: Introduction , Satellite Data .
Xie et al. (2021) E. Xie, W. Wang, Z. Yu, A. Anandkumar, J. M. Alvarez, and P. Luo SegFormer: simple and efficient design for semantic segmentation with transformers . In proc. of the 35th International Conference on Neural Information Processing Systems , Cited by: Appendix A , Implementation details .
Yang et al. (2025a) J. Yang, S. Lee, S. Park, D. Ahn, and M. Cha Towards consistent and robust slum detection using multi-year satellite data . In proc. of IEEE Joint Urban Remote Sensing Event , pp. 1–4 . Cited by: Introduction .
Yang et al. (2025b) J. Yang, S. Lee, S. Park, M. Lee, and M. Cha AI-based ger detection reveals post-pandemic delay in informal housing progress in mongolia . npj Urban Sustainability 5 ( 1 ), pp. 78 . Cited by: Satellite Data .
Yang et al. (2022) L. Yang, W. Zhuo, L. Qi, Y. Shi, and Y. Gao ST++: make self-training work better for semi-supervised semantic segmentation . In proc. of 2022 Computer Vision and Pattern Recognition , Cited by: Data , Step 2. Target Adaptation with Pseudo Label .
Zhang et al. (2024) X. Zhang, Y. Liu, Y. Lin, Q. Liao, and Y. Li UV-sam: adapting segment anything model for urban village identification . In proc. of the 38th AAAI Conference on Artificial Intelligence , Vol. 38 , pp. 22520–22528 . Cited by: Appendix A , Satellite Data .
Appendix A Appendix
附录 A 附录
Additional Results
补充结果
| Dar es Salaam | IoU | F1-score | Precision | Recall | ||||
|---|---|---|---|---|---|---|---|---|
| Non-slum | Slum | Non-slum | Slum | Non-slum | Slum | Non-slum | Slum | |
| Vanilla Source | 0.885 | 0.476 | 0.939 | 0.645 | 0.984 | 0.508 | 0.898 | 0.882 |
| MOE Source | 0.953 | 0.659 | 0.976 | 0.794 | 0.973 | 0.818 | 0.979 | 0.773 |
| SHOT | 0.930 | 0.494 | 0.964 | 0.661 | 0.953 | 0.741 | 0.975 | 0.597 |
| TENT | 0.893 | 0.489 | 0.943 | 0.657 | 0.983 | 0.527 | 0.907 | 0.871 |
| CoTTA | 0.940 | 0.585 | 0.969 | 0.738 | 0.968 | 0.746 | 0.970 | 0.730 |
| SAR | 0.899 | 0.502 | 0.947 | 0.668 | 0.983 | 0.545 | 0.914 | 0.864 |
| BeCoTTA | 0.942 | 0.540 | 0.970 | 0.702 | 0.954 | 0.846 | 0.987 | 0.599 |
| Ours | 0.966 | 0.752 | 0.983 | 0.859 | 0.986 | 0.835 | 0.979 | 0.883 |
| Kampala | IoU | F1-score | Precision | Recall | ||||
|---|---|---|---|---|---|---|---|---|
| Non-slum | Slum | Non-slum | Slum | Non-slum | Slum | Non-slum | Slum | |
| Vanilla Source | 0.942 | 0.490 | 0.970 | 0.658 | 0.973 | 0.637 | 0.967 | 0.680 |
| MOE Source | 0.956 | 0.645 | 0.977 | 0.784 | 0.996 | 0.667 | 0.960 | 0.952 |
| SHOT | 0.948 | 0.478 | 0.973 | 0.647 | 0.965 | 0.726 | 0.981 | 0.584 |
| TENT | 0.943 | 0.490 | 0.970 | 0.657 | 0.972 | 0.646 | 0.969 | 0.669 |
| CoTTA | 0.885 | 0.756 | 0.939 | 0.861 | 0.952 | 0.835 | 0.926 | 0.889 |
| SAR | 0.932 | 0.564 | 0.965 | 0.721 | 0.971 | 0.687 | 0.959 | 0.759 |
| BeCoTTA | 0.969 | 0.720 | 0.984 | 0.837 | 0.994 | 0.935 | 0.975 | 0.758 |
| Ours | 0.978 | 0.762 | 0.989 | 0.865 | 0.988 | 0.877 | 0.990 | 0.853 |
| Maputo | IoU | F1-score | Precision | Recall | ||||
|---|---|---|---|---|---|---|---|---|
| Non-slum | Slum | Non-slum | Slum | Non-slum | Slum | Non-slum | Slum | |
| Vanilla Source | 0.868 | 0.733 | 0.930 | 0.846 | 0.955 | 0.798 | 0.905 | 0.899 |
| MOE Source | 0.938 | 0.862 | 0.968 | 0.926 | 0.977 | 0.906 | 0.959 | 0.947 |
| SHOT | 0.881 | 0.745 | 0.937 | 0.854 | 0.947 | 0.834 | 0.927 | 0.875 |
| TENT | 0.870 | 0.735 | 0.930 | 0.847 | 0.955 | 0.802 | 0.907 | 0.898 |
| CoTTA | 0.886 | 0.755 | 0.940 | 0.861 | 0.949 | 0.842 | 0.931 | 0.880 |
| SAR | 0.873 | 0.735 | 0.932 | 0.847 | 0.950 | 0.813 | 0.915 | 0.885 |
| BeCoTTA | 0.939 | 0.870 | 0.968 | 0.930 | 0.993 | 0.882 | 0.945 | 0.985 |
| Ours | 0.940 | 0.873 | 0.969 | 0.932 | 0.994 | 0.884 | 0.946 | 0.987 |
Table S1: Segmentation performance on Dar es Salaam (Tanzania), Kampala (Uganda), and Maputo (Mozam- bique), reported separately for two classes across various metrics.
| 达累斯萨拉姆 | IoU | F1 分数 | 精确率 | 召回率 | ||||
|---|---|---|---|---|---|---|---|---|
| 非贫民窟 | 贫民窟 | 非贫民窟 | 贫民窟 | 非贫民窟 | 贫民窟 | 非贫民窟 | 贫民窟 | |
| 普通源模型 | 0.885 | 0.476 | 0.939 | 0.645 | 0.984 | 0.508 | 0.898 | 0.882 |
| MoE 源模型 | 0.953 | 0.659 | 0.976 | 0.794 | 0.973 | 0.818 | 0.979 | 0.773 |
| SHOT | 0.930 | 0.494 | 0.964 | 0.661 | 0.953 | 0.741 | 0.975 | 0.597 |
| TENT | 0.893 | 0.489 | 0.943 | 0.657 | 0.983 | 0.527 | 0.907 | 0.871 |
| CoTTA | 0.940 | 0.585 | 0.969 | 0.738 | 0.968 | 0.746 | 0.970 | 0.730 |
| SAR | 0.899 | 0.502 | 0.947 | 0.668 | 0.983 | 0.545 | 0.914 | 0.864 |
| BeCoTTA | 0.942 | 0.540 | 0.970 | 0.702 | 0.954 | 0.846 | 0.987 | 0.599 |
| 本文方法 | 0.966 | 0.752 | 0.983 | 0.859 | 0.986 | 0.835 | 0.979 | 0.883 |
| 坎帕拉 | IoU | F1 分数 | 精确率 | 召回率 | ||||
|---|---|---|---|---|---|---|---|---|
| 非贫民窟 | 贫民窟 | 非贫民窟 | 贫民窟 | 非贫民窟 | 贫民窟 | 非贫民窟 | 贫民窟 | |
| 普通源模型 | 0.942 | 0.490 | 0.970 | 0.658 | 0.973 | 0.637 | 0.967 | 0.680 |
| MoE 源模型 | 0.956 | 0.645 | 0.977 | 0.784 | 0.996 | 0.667 | 0.960 | 0.952 |
| SHOT | 0.948 | 0.478 | 0.973 | 0.647 | 0.965 | 0.726 | 0.981 | 0.584 |
| TENT | 0.943 | 0.490 | 0.970 | 0.657 | 0.972 | 0.646 | 0.969 | 0.669 |
| CoTTA | 0.885 | 0.756 | 0.939 | 0.861 | 0.952 | 0.835 | 0.926 | 0.889 |
| SAR | 0.932 | 0.564 | 0.965 | 0.721 | 0.971 | 0.687 | 0.959 | 0.759 |
| BeCoTTA | 0.969 | 0.720 | 0.984 | 0.837 | 0.994 | 0.935 | 0.975 | 0.758 |
| 本文方法 | 0.978 | 0.762 | 0.989 | 0.865 | 0.988 | 0.877 | 0.990 | 0.853 |
| 马普托 | IoU | F1 分数 | 精确率 | 召回率 | ||||
|---|---|---|---|---|---|---|---|---|
| 非贫民窟 | 贫民窟 | 非贫民窟 | 贫民窟 | 非贫民窟 | 贫民窟 | 非贫民窟 | 贫民窟 | |
| 普通源模型 | 0.868 | 0.733 | 0.930 | 0.846 | 0.955 | 0.798 | 0.905 | 0.899 |
| MoE 源模型 | 0.938 | 0.862 | 0.968 | 0.926 | 0.977 | 0.906 | 0.959 | 0.947 |
| SHOT | 0.881 | 0.745 | 0.937 | 0.854 | 0.947 | 0.834 | 0.927 | 0.875 |
| TENT | 0.870 | 0.735 | 0.930 | 0.847 | 0.955 | 0.802 | 0.907 | 0.898 |
| CoTTA | 0.886 | 0.755 | 0.940 | 0.861 | 0.949 | 0.842 | 0.931 | 0.880 |
| SAR | 0.873 | 0.735 | 0.932 | 0.847 | 0.950 | 0.813 | 0.915 | 0.885 |
| BeCoTTA | 0.939 | 0.870 | 0.968 | 0.930 | 0.993 | 0.882 | 0.945 | 0.985 |
| 本文方法 | 0.940 | 0.873 | 0.969 | 0.932 | 0.994 | 0.884 | 0.946 | 0.987 |
表 S1:在达累斯萨拉姆(坦桑尼亚)、坎帕拉(乌干达)和马普托(莫桑比克)上的分割表现,按两个类别分别报告各项指标。
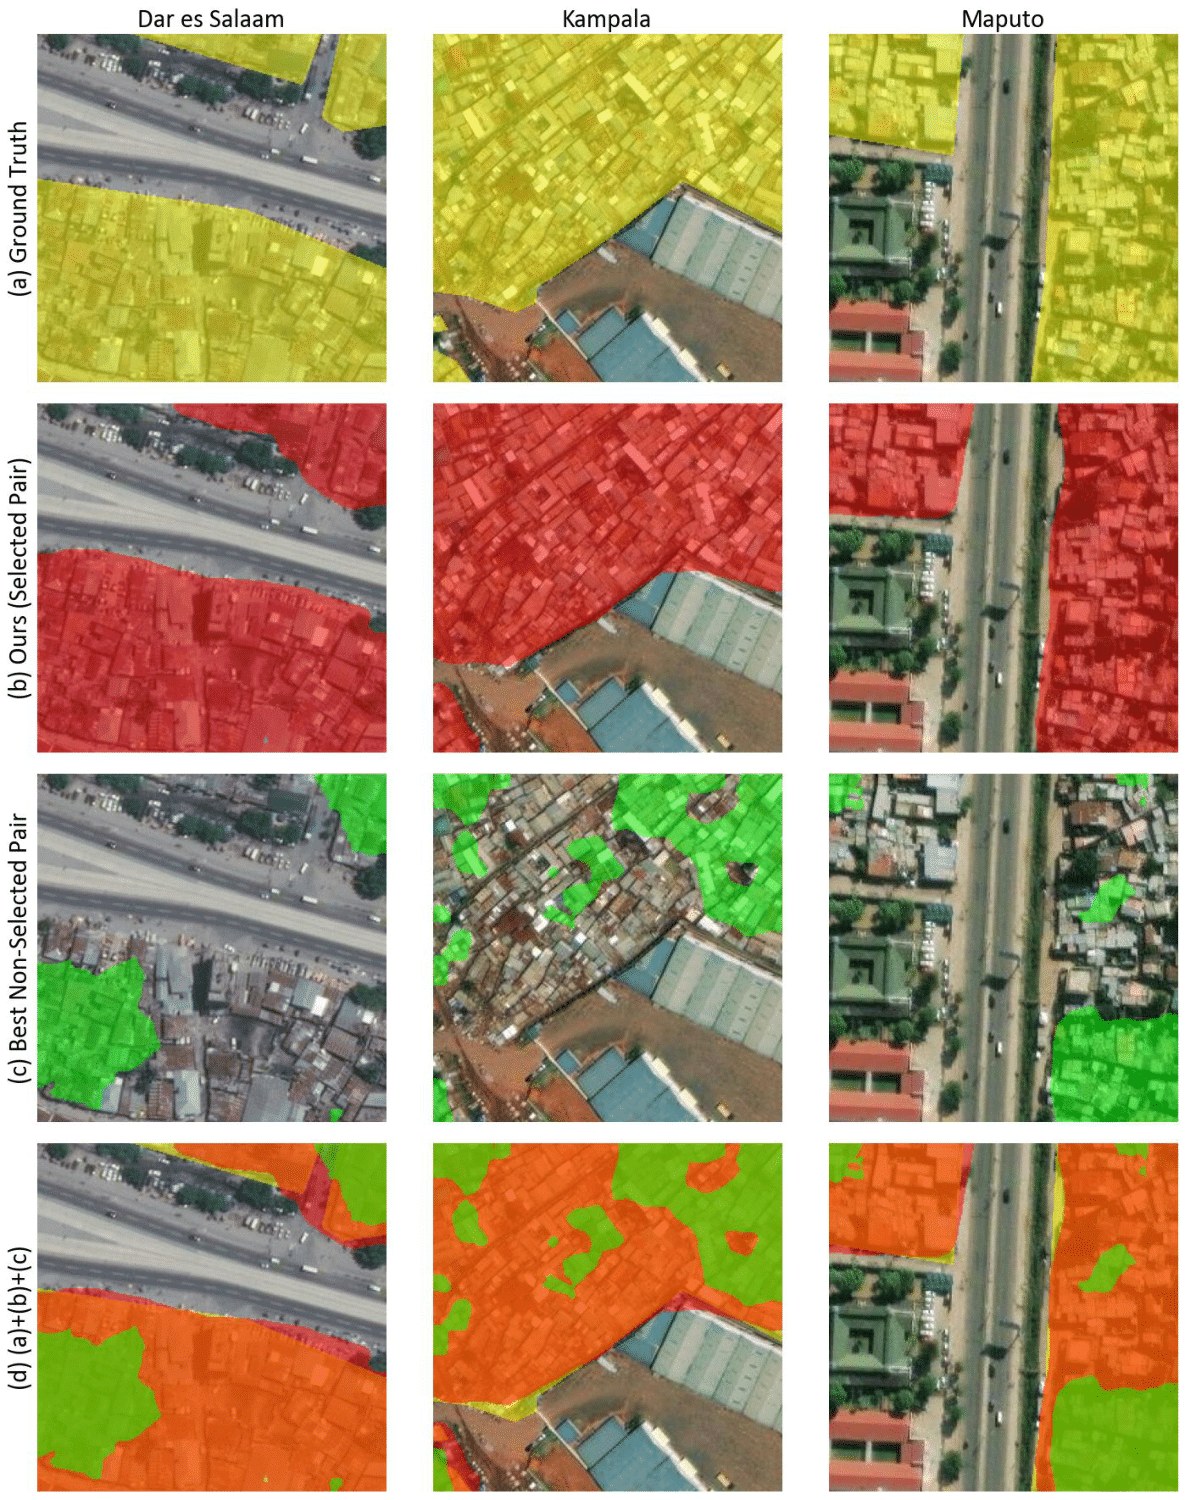
Figure S1: Visual comparison of segmentation results for Dar es Salaam (Tanzania), Kampala (Uganda), and Maputo (Mozambique) using different region pair configurations. (a) Ground truth (GT) segmentation maps. (b) Predictions generated using selected region pairs with external region classifier : Dar es Salaam & Cape Town, Kampala & Nairobi, and Maputo & Cape Town. (c) Predictions obtained from non-selected region pairs: Dar es Salaam & Ouagadougou, Kampala & Tegucigalpa, and Maputo & Mumbai. (d) Overlay of (a), (b), and (c).
图 S1:在达累斯萨拉姆(坦桑尼亚)、坎帕拉(乌干达)和马普托(莫桑比克)上,不同区域配对配置的分割结果可视化比较。(a) 真值(GT)分割图。(b) 使用外部分类器 选出的区域对所得到的预测:达累斯萨拉姆与开普敦、坎帕拉与内罗毕、马普托与开普敦。(c) 使用未选中区域对得到的预测:达累斯萨拉姆与瓦加杜古、坎帕拉与特古西加尔巴、马普托与孟买。(d) 将 (a)、(b) 和 (c) 叠加显示。
Class-wise Results
Table S1 present the class-wise segmentation performance for each test region. As shown in the tables, GRAM consistently outperforms all baseline methods in both IoU and F1-score, with particular improvements in Dar es Salaam (with the increase in the IoU value from 0.659 to 0.752). While the MOE Source and BeCoTTA baselines achieve competitive results in terms of precision and recall, they fail to reach comparable IoU and F1-scores, which are metrics that better reflect overall segmentation performance and therefore suggest that GRAM is more robust under class-imbalanced conditions.
按类别的结果
表 S1 给出了各测试区域按类别划分的分割表现。如表所示,GRAM 在 IoU 和 F1 分数上持续优于所有基线方法,在达累斯萨拉姆上的提升尤为明显(IoU 从 0.659 升至 0.752)。MoE 源模型和 BeCoTTA 基线在精确率和召回率上也能取得有竞争力的结果,但达不到可比较的 IoU 和 F1 分数;后两项指标更能反映总体分割表现,因此也说明 GRAM 在类别不均衡条件下更为稳健。
Comparison with Alternative Region Pairs
To evaluate the effectiveness of our external region classifier and region-aware expert routing, we compare the performance of our selected region pairs against all alternative region pairs involving the same target city.
与其他区域配对的比较
为评估外部分类器 和区域感知专家路由的有效性,我们把所选区域对的表现,与同一目标城市上所有其他区域对进行比较。
Across all three cities, the selected source regions consistently outperform alternative pairings. For Dar es Salaam, pairing with Cape Town yields a mean IoU of 0.859 and a slum IoU of 0.752, compared to 0.815 and 0.680 for the average of non-selected pairs. In Kampala, the selected source region, Nairobi, results in a mean IoU of 0.868 and a slum IoU of 0.759, again exceeding the corresponding averages (0.784 and 0.605). Maputo also benefits from pairing with Cape Town, achieving a mean IoU of 0.906 and a slum IoU of 0.873—surpassing the alternative pair average of 0.880 and 0.835, respectively.
在全部三座城市上,入选的源区域都持续优于其他配对。对达累斯萨拉姆而言,与开普敦配对得到的平均 IoU 为 0.859,贫民窟 IoU 为 0.752,而未入选配对的平均值分别为 0.815 和 0.680。在坎帕拉,入选的源区域内罗毕给出平均 IoU 0.868、贫民窟 IoU 0.759,同样高于相应平均值(0.784 和 0.605)。马普托与开普敦配对也有收益,平均 IoU 为 0.906,贫民窟 IoU 为 0.873,超过其他配对的平均值 0.880 和 0.835。
| Method | Dar es Salaam | Kampala | Maputo | |||
|---|---|---|---|---|---|---|
| mIoU | F1-score | mIoU | F1-score | mIoU | F1-score | |
| TempSlum | 0.818 | 0.894 | 0.857 | 0.919 | 0.872 | 0.931 |
| UV-SAM | 0.826 | 0.899 | 0.833 | 0.906 | 0.850 | 0.887 |
| LtCUV | 0.831 | 0.903 | 0.845 | 0.911 | 0.890 | 0.941 |
| Ours | 0.859 | 0.921 | 0.870 | 0.927 | 0.907 | 0.951 |
Table S2: Performance comparison of baseline and proposed methods in Dar es Salaam (Tanzania), Kampala (Uganda), and Maputo (Mozambique)
| 方法 | 达累斯萨拉姆 | 坎帕拉 | 马普托 | |||
|---|---|---|---|---|---|---|
| mIoU | F1 分数 | mIoU | F1 分数 | mIoU | F1 分数 | |
| TempSlum | 0.818 | 0.894 | 0.857 | 0.919 | 0.872 | 0.931 |
| UV-SAM | 0.826 | 0.899 | 0.833 | 0.906 | 0.850 | 0.887 |
| LtCUV | 0.831 | 0.903 | 0.845 | 0.911 | 0.890 | 0.941 |
| 本文方法 | 0.859 | 0.921 | 0.870 | 0.927 | 0.907 | 0.951 |
表 S2:在达累斯萨拉姆(坦桑尼亚)、坎帕拉(乌干达)和马普托(莫桑比克)上,基线方法与本文方法的性能比较
These consistent improvements across all three cities suggest that our external classifier reliably identifies source domains that are better aligned with the target distribution. This targeted pairing allows GRAM to route inputs to more compatible experts, resulting in significantly improved segmentation, particularly in densely built-up slum areas. The strong results observed in three target regions demonstrate the robustness and generalizability of our region-pairing strategy. As illustrated in Figure S1, this informed routing leads to more precise delineation of slum boundaries across diverse urban landscapes.
这三座城市上持续出现的提升表明,我们的外部分类器能够可靠地找出与目标分布更对齐的源域。这种有针对性的配对使 GRAM 可以把输入路由到更兼容的专家,从而显著改善分割,尤其是在建筑密集的贫民窟区域。在三个目标区域上观察到的较强结果,说明我们的区域配对策略是稳健且可泛化的。如图 S1 所示,这种有依据的路由能够在多样的城市景观中更精确地勾勒贫民窟边界。
Additional Baselines
We conducted additional comparisons against previous slum and urban village detection baselines. The baselines include: (1) TempSlum (Rehman et al. 2022), which expands seed labels through embedding-based pseudo-labeling; (2) UV-SAM (Zhang et al. 2024), which adapts a vision foundation model via fine-tuning on urban village imagery; and (3) LtCUV (Lin et al. 2024), which leverages a limited labeled dataset through a curriculum labeling strategy. As shown in Table S2, our model outperforms these baselines by approximately 4.0% in mIoU and 2.5% in F1-score on average across the three test cities, demonstrating superior adaptability to diverse spatial morphologies and imaging conditions compared with prior approaches for informal or urban settlement mapping.
更多基线
我们还与此前的贫民窟和城中村检测基线做了补充比较。这些基线包括:(1) TempSlum (Rehman et al. 2022),通过基于嵌入的伪标注来扩展种子标签;(2) UV-SAM (Zhang et al. 2024),在城中村影像上微调,以适配视觉基础模型;(3) LtCUV (Lin et al. 2024),借助课程标注策略利用有限的标注数据。如表 S2 所示,我们的模型在三座测试城市上平均高出这些基线约 4.0% 的 mIoU 和 2.5% 的 F1 分数,说明与此前用于非正规或城市住区制图的方法相比,它对多样的空间形态和成像条件有更强的适应能力。
Dataset Contribution
Existing slum ground-truth datasets were often misaligned with satellite imagery due to geometric errors (Ref). We recalibrate these reference data to align with the RGB imagery while preserving original criteria (Aligned), with geographers manually re-labeling and achieving an inter-annotator mIoU of 0.84 for Mumbai. Using these manual labels, we trained a semi-supervised model to generate pseudo-labels for regions or periods lacking ground-truth, which were added to the source dataset. The table S3 reports target mIoU from training SegFormer (Xie et al. 2021) on the source dataset without pseudo-labels (Ref and Aligned) and with pseudo-labels (+PL), demonstrating that our aligned and augmented dataset enhances transferability.
数据集贡献
已有的贫民窟真值数据集常常因几何误差而与卫星影像错位(Ref)。我们在保留原有标准的前提下,把这些参照数据重新校准并与 RGB 影像对齐(Aligned),由地理学者手工重新标注,并在孟买上达到 0.84 的标注者间 mIoU。利用这些人工标签,我们训练了一个半监督模型,为缺少真值的区域或时期生成伪标签,再把它们加入源数据集。表 S3 报告了用 SegFormer (Xie et al. 2021) 在不含伪标签(Ref 和 Aligned)以及含伪标签(+PL)的源数据集上训练后,在目标域上的 mIoU,说明经过对齐并扩充的数据集提高了可迁移性。
| Method | Dar es Salaam | Kampala | Maputo |
|---|---|---|---|
| Ref | 0.40 | 0.46 | 0.59 |
| Aligned | 0.45 | 0.54 | 0.66 |
| +PL | 0.68 | 0.72 | 0.80 |
Table S3: mIoU of SegFormer trained on source datasets with different labeling schemes: original misaligned ground truth (Ref), geometrically aligned and re-labeled data (Aligned), and our semi-supervised extension with pseudo-labels (+PL).
| 方法 | 达累斯萨拉姆 | 坎帕拉 | 马普托 |
|---|---|---|---|
| 参照(Ref) | 0.40 | 0.46 | 0.59 |
| 对齐(Aligned) | 0.45 | 0.54 | 0.66 |
| 加伪标签(+PL) | 0.68 | 0.72 | 0.80 |
表 S3:在不同标注方案的源数据集上训练 SegFormer 得到的 mIoU:原始错位真值(Ref)、经过几何对齐并重新标注的数据(Aligned),以及我们用伪标签做的半监督扩展(+PL)。
Dataset Splitting
To assess the temporal robustness of our approach, we divided the dataset according to acquisition time periods (see Implementation Details for the detailed timeline). As shown in Table S4, our model maintained consistently stable performance, with a standard deviation of mIoU not exceeding 0.061 across all cities. On average, our model achieved mIoU of 0.871 and mF1 of 0.916, outperforming the vanilla source baseline (mIoU: 0.730, mF1: 0.763). These results highlight the effectiveness of test-time adaptation (TTA) in mitigating temporal domain shifts in satellite imagery. Furthermore, the minimal performance fluctuation across time indicates that our model generalizes well to unseen temporal conditions, demonstrating its reliability for long-term monitoring and mapping tasks.
数据划分
为评估方法在时间上的稳健性,我们按采集时段划分数据集(详细时间线见实现细节)。如表 S4 所示,我们的模型保持了稳定表现,各城市 mIoU 的标准差不超过 0.061。平均而言,我们的模型达到 mIoU 0.871、mF1 0.916,优于普通源模型基线(mIoU 为 0.730,mF1 为 0.763)。这些结果突出了测试时适应(TTA)在缓解卫星影像时间域偏移上的作用。此外,跨时间的性能波动很小,说明模型对未见过的时间条件也能较好泛化,适合长期监测和制图任务。
| City | Metric | Ours | Vanilla Source |
|---|---|---|---|
| Dar es Salaam | mIoU | 0.8420.050 | 0.6790.048 |
| mF1 | 0.9040.048 | 0.7410.086 | |
| mPrecision | 0.8970.027 | 0.7470.083 | |
| Kampala | mIoU | 0.8620.061 | 0.7100.093 |
| mF1 | 0.8990.007 | 0.6760.217 | |
| mPrecision | 0.8820.012 | 0.7300.158 | |
| Maputo | mIoU | 0.9090.015 | 0.8000.020 |
| mF1 | 0.9450.007 | 0.8510.019 | |
| mPrecision | 0.9350.004 | 0.8290.045 |
Table S4: Temporal robustness evaluation of GRAM and vanilla source model across different time splits.
| 城市 | 指标 | 本文方法 | 普通源模型 |
|---|---|---|---|
| 达累斯萨拉姆 | mIoU | 0.8420.050 | 0.6790.048 |
| mF1 | 0.9040.048 | 0.7410.086 | |
| 平均精确率 | 0.8970.027 | 0.7470.083 | |
| 坎帕拉 | mIoU | 0.8620.061 | 0.7100.093 |
| mF1 | 0.8990.007 | 0.6760.217 | |
| 平均精确率 | 0.8820.012 | 0.7300.158 | |
| 马普托 | mIoU | 0.9090.015 | 0.8000.020 |
| mF1 | 0.9450.007 | 0.8510.019 | |
| 平均精确率 | 0.9350.004 | 0.8290.045 |
表 S4:在不同时间划分上评估 GRAM 与普通源模型的时间稳健性。
Ablation Details
To investigate the effect of the pseudo-label selection threshold , we conduct an ablation study of Dar es Salaam (Tanzania) with different values from 0.1 to 0.5. Table S5 shows the result, where the best overall performance is achieved when with the highest IoU and F1 Score for both slum and non-slum classes. Although lower thresholds such as 0.4 and 0.3 lead to slightly higher precision and recall, they mark decreased performance for other classes. This exploration suggests that filtering pseudo-labels with moderate strictness, such as selecting the top 50% most stable predictions, can effectively offer a balance between label reliability and coverage under class-imbalanced conditions.
消融细节
为考察伪标签选择阈值 的影响,我们在达累斯萨拉姆(坦桑尼亚)上对 0.1 到 0.5 的不同 值做了消融。表 S5 给出结果:当 时总体最好,贫民窟与非贫民窟两类的 IoU 和 F1 分数都最高。0.4 和 0.3 这类较低阈值会在精确率或召回率上略高,但其他类别的表现会下降。这一探索表明,用中等严格程度过滤伪标签,例如选出最稳定的前 50% 预测,可以在类别不均衡条件下较好地兼顾标签可靠性和覆盖范围。
Implementation Details
实现细节
| IoU | F1 Score | Precision | Recall | |||||
|---|---|---|---|---|---|---|---|---|
| non-slum | slum | non-slum | slum | non-slum | slum | non-slum | slum | |
| 0.5 | 0.966 | 0.752 | 0.983 | 0.859 | 0.986 | 0.835 | 0.979 | 0.883 |
| 0.4 | 0.966 | 0.752 | 0.983 | 0.858 | 0.985 | 0.840 | 0.980 | 0.878 |
| 0.3 | 0.964 | 0.747 | 0.982 | 0.855 | 0.988 | 0.811 | 0.975 | 0.904 |
| 0.2 | 0.958 | 0.713 | 0.978 | 0.833 | 0.987 | 0.780 | 0.970 | 0.893 |
| 0.1 | 0.956 | 0.704 | 0.977 | 0.826 | 0.987 | 0.771 | 0.968 | 0.890 |
Table S5: Ablation study on the effect of the pseudo-label selection threshold in the Dar es Salaam (Tanzania) region. The results shows yields the best performance.
| IoU | F1 分数 | 精确率 | 召回率 | |||||
|---|---|---|---|---|---|---|---|---|
| 非贫民窟 | 贫民窟 | 非贫民窟 | 贫民窟 | 非贫民窟 | 贫民窟 | 非贫民窟 | 贫民窟 | |
| 0.5 | 0.966 | 0.752 | 0.983 | 0.859 | 0.986 | 0.835 | 0.979 | 0.883 |
| 0.4 | 0.966 | 0.752 | 0.983 | 0.858 | 0.985 | 0.840 | 0.980 | 0.878 |
| 0.3 | 0.964 | 0.747 | 0.982 | 0.855 | 0.988 | 0.811 | 0.975 | 0.904 |
| 0.2 | 0.958 | 0.713 | 0.978 | 0.833 | 0.987 | 0.780 | 0.970 | 0.893 |
| 0.1 | 0.956 | 0.704 | 0.977 | 0.826 | 0.987 | 0.771 | 0.968 | 0.890 |
表 S5:在达累斯萨拉姆(坦桑尼亚)地区,关于伪标签选择阈值 影响的消融实验。结果显示 时表现最好。
Data Labeling
| Cairo | Cape Town | Nairobi | Ouagadougou | Colombo | Karachi | Mumbai | Caracas |
|---|---|---|---|---|---|---|---|
| Jul 2015 | Oct 2015 | Jan 2014 | Dec 2019 | Dec 2015 | Nov 2014 | Jan 2016 | Mar 2013 |
| Jan 2019 | Nov 2016 | Jan 2017 | Jan 2021 | Dec 2016 | Jan 2017 | Dec 2016 | Mar 2014 |
| Jul 2020 | Jan 2017 | Feb 2019 | Jan 2022 | Jan 2020 | Oct 2018 | Oct 2018 | Apr 2017 |
| Nov 2021 | Jan 2019 | Feb 2020 | Nov 2022 | May 2022 | Nov 2020 | Jan 2020 | Mar 2018 |
| May 2022 | Jan 2022 | Aug 2021 | Jan 2024 | Mar 2023 | Sep 2021 | Oct 2021 | Jan 2019 |
| Mar 2023 | Jan 2023 | Feb 2023 | Mar 2022 | Feb 2022 | Apr 2020 | ||
| Jul 2023 | Jan 2024 | Jan 2023 | Jan 2023 | Dec 2021 | |||
| Nov 2023 | Mar 2024 |
| Medellín | Rio de Janeiro | Port-au-Prince | Tegucigalpa | Dar es Salaam | Kampala | Maputo |
|---|---|---|---|---|---|---|
| Jan 2015 | Jul 2017 | Jan 2016 | Dec 2015 | Aug 2018 | Feb 2015 | Jul 2016 |
| Feb 2017 | Jun 2018 | Dec 2016 | Dec 2016 | Mar 2017 | Nov 2016 | Apr 2017 |
| Aug 2019 | Oct 2019 | Dec 2017 | Mar 2018 | Mar 2018 | Jan 2018 | Dec 2018 |
| Jan 2020 | Sep 2021 | Nov 2018 | Mar 2019 | May 2021 | Dec 2019 | Mar 2020 |
| Nov 2020 | May 2022 | Mar 2020 | Apr 2020 | Jun 2022 | Jul 2021 | Jul 2021 |
| Aug 2023 | May 2023 | Jan 2021 | Mar 2022 | Feb 2023 | Feb 2023 | Oct 2022 |
| Jan 2024 | Jul 2021 | Jan 2023 | May 2023 | |||
| Mar 2023 | Apr 2024 | |||||
| Jan 2024 |
Table S6: Overview of satellite imagery acquisition dates across 15 cities. Each column corresponds to a specific city, and each row represents a unique acquisition timestamp.
数据标注
| 开罗 | 开普敦 | 内罗毕 | 瓦加杜古 | 科伦坡 | 卡拉奇 | 孟买 | 加拉加斯 |
|---|---|---|---|---|---|---|---|
| Jul 2015 | Oct 2015 | Jan 2014 | Dec 2019 | Dec 2015 | Nov 2014 | Jan 2016 | Mar 2013 |
| Jan 2019 | Nov 2016 | Jan 2017 | Jan 2021 | Dec 2016 | Jan 2017 | Dec 2016 | Mar 2014 |
| Jul 2020 | Jan 2017 | Feb 2019 | Jan 2022 | Jan 2020 | Oct 2018 | Oct 2018 | Apr 2017 |
| Nov 2021 | Jan 2019 | Feb 2020 | Nov 2022 | May 2022 | Nov 2020 | Jan 2020 | Mar 2018 |
| May 2022 | Jan 2022 | Aug 2021 | Jan 2024 | Mar 2023 | Sep 2021 | Oct 2021 | Jan 2019 |
| Mar 2023 | Jan 2023 | Feb 2023 | Mar 2022 | Feb 2022 | Apr 2020 | ||
| Jul 2023 | Jan 2024 | Jan 2023 | Jan 2023 | Dec 2021 | |||
| Nov 2023 | Mar 2024 |
| 麦德林 | 里约热内卢 | 太子港 | 特古西加尔巴 | 达累斯萨拉姆 | 坎帕拉 | 马普托 |
|---|---|---|---|---|---|---|
| Jan 2015 | Jul 2017 | Jan 2016 | Dec 2015 | Aug 2018 | Feb 2015 | Jul 2016 |
| Feb 2017 | Jun 2018 | Dec 2016 | Dec 2016 | Mar 2017 | Nov 2016 | Apr 2017 |
| Aug 2019 | Oct 2019 | Dec 2017 | Mar 2018 | Mar 2018 | Jan 2018 | Dec 2018 |
| Jan 2020 | Sep 2021 | Nov 2018 | Mar 2019 | May 2021 | Dec 2019 | Mar 2020 |
| Nov 2020 | May 2022 | Mar 2020 | Apr 2020 | Jun 2022 | Jul 2021 | Jul 2021 |
| Aug 2023 | May 2023 | Jan 2021 | Mar 2022 | Feb 2023 | Feb 2023 | Oct 2022 |
| Jan 2024 | Jul 2021 | Jan 2023 | May 2023 | |||
| Mar 2023 | Apr 2024 | |||||
| Jan 2024 |
表 S6:15 座城市卫星影像采集日期一览。每一列对应一座城市,每一行代表一个采集时点。
We used satellite imagery from the ESRI World Imagery Wayback archive and utilized multi-temporal images to better support the model’s generalizability. Table S6 provides an overview of the satellite imagery acquisition dates for the 15 cities included in our study. Each column corresponds to a specific city, and each row represents a distinct acquisition timestamp. To capture seasonal and temporal variability, we selected images spanning multiple years and seasons, with most cities represented by five or more unique time points. This multi-temporal sampling strategy helps increase robustness to any visual changes in atmospheric conditions, vegetation, and lighting, thereby enhancing the generalizability of the segmentation model across diverse urban environments.
我们使用来自 ESRI World Imagery Wayback 档案的卫星影像,并利用多时相影像来更好地支持模型的泛化。表 S6 概述了本研究涵盖的 15 座城市的卫星影像采集日期。每一列对应一座城市,每一行代表一个不同的采集时点。为捕捉季节和时间上的变化,我们选取了跨多年、跨季节的影像,大多数城市有五个或更多不同时点。这种多时相采样有助于提高对大气条件、植被和光照等视觉变化的稳健性,从而增强分割模型在多样城市环境中的泛化能力。
Table S7 summarizes the number of labeled and total grids for each city included in our dataset. The labeled grids correspond to image tiles annotated with slum and non-slum classes, sourced from publicly available datasets (Samper 2025; University of Edinburgh 2020; Earth Observation for Sustainable Development 2018; Slum Rehabilitation Authority 2016; Alcaldia de Medellin 2010; Prefeitura da Cidade do Rio de Janeiro 2021). The total grid count reflects the full set of satellite image tiles at zoom level 16, used for model training and evaluation. While some cities contain relatively sparse labels (e.g., Kampala and Port-au-Prince), others, such as Cairo and Cape Town, offer extensive annotated coverage. This variability enables model performance under both high- and low-supervision regimes.
表 S7 汇总了本数据集中各城市的标注网格数和总网格数。标注网格对应标有贫民窟与非贫民窟类别的影像瓦片,来自公开数据集 (Samper 2025; University of Edinburgh 2020; Earth Observation for Sustainable Development 2018; Slum Rehabilitation Authority 2016; Alcaldia de Medellin 2010; Prefeitura da Cidade do Rio de Janeiro 2021)。总网格数是缩放等级 16、尺寸为 的全部卫星影像瓦片,用于模型训练和评估。有些城市的标注相对稀疏(例如坎帕拉和太子港),另一些城市如开罗和开普敦则有较广的标注覆盖。这种差异使我们能够在高监督和低监督两种体制下考察模型表现。
| City | Labeled Grids | Total Grids |
|---|---|---|
| Cairo (Samper 2025) | 11,174 | 393,158 |
| Cape Town (University of Edinburgh 2020) | 10,808 | 456,971 |
| Nairobi (Samper 2025) | 6,505 | 122,764 |
| Ouagadougou (Samper 2025) | 8,449 | 123,204 |
| Colombo (Samper 2025) | 4,376 | 80,300 |
| Karachi (Earth Observation for Sustainable Development 2018) | 11,612 | 319,328 |
| Mumbai (Slum Rehabilitation Authority 2016) | 8,316 | 169,407 |
| Caracas (Samper 2025) | 6,853 | 97,232 |
| Medellin (Alcaldia de Medellin 2010) | 3,950 | 83,256 |
| Rio de Janeiro (Prefeitura da Cidade do Rio de Janeiro 2021) | 9,179 | 353,496 |
| Port-au-Prince (Samper 2025) | 2,344 | 29,286 |
| Tegucigalpa (Samper 2025) | 3,528 | 110,988 |
| Dar es Salaam (Samper 2025) | 6,050 | 237,974 |
| Kampala (Samper 2025) | 2,623 | 48,696 |
| Maputo (Samper 2025) | 8,863 | 242,963 |
Table S7: Summary of labeled and total grid counts across all cities included in the dataset.
| 城市 | 标注网格数 | 总网格数 |
|---|---|---|
| 开罗 (Samper 2025) | 11,174 | 393,158 |
| 开普敦 (University of Edinburgh 2020) | 10,808 | 456,971 |
| 内罗毕 (Samper 2025) | 6,505 | 122,764 |
| 瓦加杜古 (Samper 2025) | 8,449 | 123,204 |
| 科伦坡 (Samper 2025) | 4,376 | 80,300 |
| 卡拉奇 (Earth Observation for Sustainable Development 2018) | 11,612 | 319,328 |
| 孟买 (Slum Rehabilitation Authority 2016) | 8,316 | 169,407 |
| 加拉加斯 (Samper 2025) | 6,853 | 97,232 |
| 麦德林 (Alcaldia de Medellin 2010) | 3,950 | 83,256 |
| 里约热内卢 (Prefeitura da Cidade do Rio de Janeiro 2021) | 9,179 | 353,496 |
| 太子港 (Samper 2025) | 2,344 | 29,286 |
| 特古西加尔巴 (Samper 2025) | 3,528 | 110,988 |
| 达累斯萨拉姆 (Samper 2025) | 6,050 | 237,974 |
| 坎帕拉 (Samper 2025) | 2,623 | 48,696 |
| 马普托 (Samper 2025) | 8,863 | 242,963 |
表 S7:本数据集中各城市标注网格数与总网格数的汇总。
Training
We use the SegFormer backbone, which is an efficient semantic segmentation model that offers several key advantages over traditional CNN-based and earlier transformer-based architectures, and train all models under identical settings using SGD with a learning rate of 0.01 for source training and 0.0001 for target adaptation and momentum of 0.99. The source model is trained for 3 epochs, followed by 10 additional epochs for target domain adaptation. Adaptation is performed in a fully unsupervised setting, without access to any ground truth labels from the target domain. In our experiments, we set , , and . Two NVIDIA GeForce RTX 3090 GPUs were used for each experiment. For baselines, we followed the hyperparameter configurations provided in the respective GitHub repositories.
训练
我们使用 SegFormer 主干。这是一种高效的语义分割模型,相对传统的基于 CNN 的方法以及更早的 Transformer 结构有若干重要优势。所有模型在相同设置下用 SGD 训练,源域训练的学习率为 0.01,目标适应的学习率为 0.0001,动量为 0.99。源模型训练 3 个周期,随后再做 10 个周期的目标域适应。适应在完全无监督设定下进行,无法获得目标域的任何真值标签。实验中我们取 、、。每次实验使用两块 NVIDIA GeForce RTX 3090 GPU。对于基线方法,我们遵循各自 GitHub 仓库中提供的超参数配置。