Scaling Data-Constrained Language Models
Scaling Data-Constrained Language Models
Niklas Muennighoff Alexander M. Rush Boaz Barak Teven Le Scao Aleksandra Piktus Nouamane Tazi Sampo Pyysalo Thomas Wolf Colin Raffel Hugging Face Harvard University University of Turku n.muennighoff@gmail.com
Abstract
摘要
The current trend of scaling language models involves increasing both parameter count and training dataset size. Extrapolating this trend suggests that training dataset size may soon be limited by the amount of text data available on the internet. Motivated by this limit, we investigate scaling language models in data-constrained regimes. Specifically, we run a large set of experiments varying the extent of data repetition and compute budget, ranging up to 900 billion training tokens and 9 billion parameter models. We find that with constrained data for a fixed compute budget, training with up to 4 epochs of repeated data yields negligible changes to loss compared to having unique data. However, with more repetition, the value of adding compute eventually decays to zero. We propose and empirically validate a scaling law for compute optimality that accounts for the decreasing value of repeated tokens and excess parameters. Finally, we experiment with approaches mitigating data scarcity, including augmenting the training dataset with code data or removing commonly used filters. Models and datasets from our 400 training runs are freely available at https://github.com/huggingface/datablations.
当前放大语言模型的趋势是同时增加参数量与训练数据集规模。外推这一趋势会发现:训练数据规模很快可能受限于互联网上可用文本量。受此限制驱动,我们研究数据受限情形下的语言模型缩放。具体地,我们运行一大组实验,改变数据重复程度与算力预算,最大到 9000 亿训练 token 与 90 亿参数模型。我们发现:在固定算力预算且数据受限时,用重复数据最多训到约 4 个 epoch,相对拥有唯一数据时损失变化可忽略。但重复更多后,继续加算力的收益最终衰减到零。我们提出并经验验证一条计入重复 token 与多余参数价值递减的算力最优缩放律。最后,我们尝试缓解数据稀缺的方法,包括用代码数据增强训练集,或去掉常用过滤。逾 400 次训练运行的模型与数据集公开于 https://github.com/huggingface/datablations。
1 Introduction
1 引言
Recent work on compute-optimal language models [42] shows that many previously trained large language models (LLMs, which we define as having more than one billion parameters) could have attained better performance for a given compute budget by training a smaller model on more data. Notably, the 70-billion parameter Chinchilla model [42] outperforms the 280-billion parameter Gopher model [89] while using a similar compute budget by being trained on four times more data. Extrapolating these laws for compute allocation (hereafter "Chinchilla scaling laws") to a 530 billion parameter model, such as the under-trained MT-NLG model [99], would require training on a massive 11 trillion tokens, corresponding to more than 30 terabytes of text data. For most languages, available data is several orders of magnitude smaller, meaning that LLMs in those languages are already data-constrained. Villalobos et al. 2022 estimate that even high-quality English language data will be exhausted by the year 2024 given the Chinchilla scaling laws and the trend of training ever-larger models. This motivates the question [112, 81]: what should we do when we run out of data?
近期关于算力最优语言模型的工作 [42] 表明:许多先前训练的大规模语言模型(LLM,我们定义为超过十亿参数)若在给定算力预算下训更小模型、看更多数据,本可获得更好表现。值得注意的是,700 亿参数的 Chinchilla [42] 以相近算力预算、通过在约四倍数据上训练,优于 2800 亿参数的 Gopher [89]。把这些算力分配律(下文称「Chinchilla 缩放律」)外推到如训练不足的 MT-NLG [99] 这样的 5300 亿参数模型,将需要在约 11 万亿 token 上训练,对应超过 30 TB 文本。对多数语言,可用数据小几个数量级,意味着这些语言上的 LLM 已经数据受限。Villalobos et al. 2022 估计:按 Chinchilla 缩放律与不断训练更大模型的趋势,即便高质量英语数据也会在 2024 年耗尽。这引出问题 [112, 81]:数据用尽后我们该怎么办?
In this work we investigate scaling large language models in a data-constrained regime, and whether training an LLM with multiple epochs of repeated data impacts scaling. Using multiple epochs is, of course, standard in machine learning generally; however, most prior large language models have been trained for a single epoch [51, 15] and some work explicitly advocates against reusing data [40]. An exception is the recent Galactica models [108] that were trained for 4.25 epochs and exhibit continually decreasing validation loss and improving downstream performance throughout training. However, the experiments of Galactica do not compare this setup to an alternative non-data-constrained model trained for one epoch on unique data. Without this comparison, it is difficult to quantify the trade-off between additional compute versus additional data collection.
本文研究数据受限情形下大规模语言模型的缩放,以及用重复数据多 epoch 训练 LLM 是否影响缩放。多 epoch 在机器学习中本属常规;但多数先前大语言模型只训单个 epoch [51, 15],也有工作明确主张不要复用数据 [40]。例外是近期 Galactica 模型 [108]:训了 4.25 个 epoch,训练全程验证损失持续下降、下游表现持续改进。但 Galactica 的实验未把该设定与「单 epoch、不数据受限、看唯一数据」的对照模型比较。没有这一比较,很难量化「加算力」相对「再收集数据」的权衡。
Our main focus is to quantify the impact of multiple epochs in LLM training such that practitioners can decide how to allocate compute when scaling models. Toward this end, we assembled a battery of empirical training runs of varying data and compute constraints. Specifically, we train more than 400 models ranging from 10 million to 9 billion parameters for up to 1500 epochs and record final test loss. We use these results to fit a new data-constrained scaling law that generalizes the Chinchilla scaling law [42] to the repeated data regime and yields a better prediction of loss in this setting. Figure 1 summarizes our main results targeting the value of repeated data (Return) and optimal allocation of resources in that regime (Allocation). We find that, while models trained for a single epoch consistently have the best validation loss per compute, differences tend to be insignificant among models trained for up to 4 epochs and do not lead to differences in downstream task performance. Additional epochs continue to be beneficial, but returns eventually diminish to zero. We find that, in the data-constrained regime, allocating new compute to both more parameters and epochs is necessary, and that epochs should be scaled slightly faster. These findings suggest a simple way to continue scaling total training compute budgets further ahead in the future than the previously anticipated limits.
我们的主要目标是量化 LLM 训练中多 epoch 的影响,使实践者在放大模型时能决定如何分配算力。为此,我们组装了一批改变数据与算力约束的经验训练运行。具体地,我们训练逾 400 个模型,参数从 1000 万到 90 亿,最多 1500 个 epoch,并记录最终测试损失。用这些结果拟合新的数据受限缩放律,把 Chinchilla 缩放律 [42] 推广到重复数据情形,并在该设定下更好预测损失。图 1 汇总主要结果:针对重复数据价值(Return)与该情形下资源最优分配(Allocation)。我们发现:虽单 epoch 模型在每算力验证损失上始终最好,但最多约 4 个 epoch 的模型之间差异往往不显著,也不会带来下游任务表现差异。继续增加 epoch 仍有益,但收益最终趋于零。我们还发现:在数据受限情形下,新增算力需同时分配给更多参数与更多 epoch,且 epoch 应略快放大。这些发现给出一种简单方式,使总训练算力预算能比先前预期的极限走得更远。
Finally, given the challenges imposed by data constraints, we consider methods complementary to repeating for improving downstream accuracy without adding new natural language data. Experiments consider incorporating code tokens and relaxing data filtering. For code, English LLMs, such as PaLM [19] or Gopher [89], are trained on a small amount of code data alongside natural language data, though no benchmarking was reported to justify that decision. We investigate training LLMs on a mix of language data and Python data at 10 different mixing rates and find that mixing in code is able to provide a 2 increase in effective tokens even when evaluating only natural language tasks. For filtering, we revisit perplexity and deduplication filtering strategies on both noisy and clean datasets and find that data filtering is primarily effective for noisy datasets.
最后,鉴于数据约束带来的挑战,我们考虑与重复互补、且不新增自然语言数据即可改进下游准确率的方法。实验考察纳入代码 token 与放宽数据过滤。对代码:PaLM [19]、Gopher [89] 等英语 LLM 会在自然语言旁混入少量代码,但未见支撑该决策的基准报告。我们在 10 种混合比例下把 LLM 训在语言数据与 Python 数据的混合上,发现即便只评自然语言任务,混入代码也能带来约 的有效 token 增加。对过滤:我们在嘈杂与干净数据集上重访困惑度与去重过滤,发现数据过滤主要对嘈杂数据集有效。
2 Background
2 背景
Predicting the scaling behavior of large models is critical when deciding on training resources. Specifically, two questions are of interest: (Allocation) What is the optimal balance of resources? (Return) What is the expected value of additional resources? For scaling LLMs, the resource is compute (measured in FLOPs), and it can be allocated to training a larger model or training for more steps.[^1] The metric used to quantify progress is the model’s loss on held-out data, i.e. the ability to predict the underlying data as measured in the model’s cross-entropy [2, 42]. We aim to minimize the loss () subject to a compute resource constraint () via optimal allocation to and as:
决定训练资源时,预测大模型缩放行为至关重要。具体有两个问题值得关心:(Allocation) 资源的最优平衡是什么?(Return) 追加资源的期望收益是什么?对放大 LLM,资源是算力(以 FLOPs 计),可分配给训更大模型或训更多步。[^1]量化进展的指标是模型在留出数据上的损失,即用交叉熵衡量的对底层数据的预测能力 [2, 42]。我们旨在算力资源约束 () 下,通过对 与 的最优分配最小化损失 ():
Currently, there are established best practices for scaling LLMs. Return follows a power-law: loss scales as a power-law with the amount of compute used for training [39, 46, 6, 35, 7, 41]. Allocation is balanced: resources are divided roughly equally between scaling of parameters and data [42]. These scaling laws were established empirically by training LLMs and carefully extrapolating behavior.
当前 LLM 缩放已有成熟实践。Return 遵循幂律:损失随用于训练的算力量呈幂律缩放 [39, 46, 6, 35, 7, 41]。Allocation 保持平衡:资源在参数放大与数据放大之间大致均分 [42]。这些缩放律由训练 LLM 并谨慎外推行为经验建立。
Chinchilla [42] uses three methods for making scaling predictions:
Chinchilla [42] 用三种方法做缩放预测:
- • (Fixed Parameters) Train with a fixed model size but on varying amounts of data.
- • (固定参数) 固定模型规模,改变数据量训练。
- • (Fixed FLOPs) Train with fixed computation while parameters and training tokens vary.
- • (固定 FLOPs) 固定算力,改变参数与训练 token。
- • (Parametric Fit) Derive and fit a formula for the loss.
- • (参数化拟合) 推导并拟合损失公式。
For the parametric fit, the loss () is a function of parameters () and training tokens ():
对参数化拟合,损失 () 是参数 () 与训练 token () 的函数:
Where are learned variables fit using the training runs from the first two approaches [42]. Using these learned variables, they propose calculating the optimal allocation of compute () to and as follows:
其中 是用前两种方法的训练运行拟合的学习变量 [42]。利用这些学习变量,他们提出把算力 () 最优分配给 与 的计算如下:
These methods lead to the conclusion that and hence and should be scaled proportionally for compute-optimal training. As loss can be an imperfect proxy for performance on natural language tasks [123, 97, 105], they also validate their conclusions on various downstream tasks.
这些方法得出 ,因而算力最优训练应等比例放大 与 。由于损失可能是自然语言任务表现的不完美代理 [123, 97, 105],他们也在多种下游任务上验证结论。
3 Method: Data-Constrained Scaling Laws
3 方法:数据受限缩放律
We are interested in scaling behavior in the data-constrained regime. Specifically, given a limited amount of unique data, what is the best Allocation of and Return for computational resources. Prior work [46, 42] assumes that the necessary data to support scaling is unlimited. Our aim is therefore to introduce a modified version of Equation 2 that accounts for data constraints and fit the terms in the modified scaling law to data from a large body of experiments.
我们关心数据受限情形下的缩放行为。具体地,给定有限唯一数据量,算力资源的最佳Allocation与Return是什么。先前工作 [46, 42] 假定支撑缩放所需的数据无限。因此我们的目标是引入计入数据约束的式 2 修改版,并把修改后缩放律中的各项拟合到大量实验数据。
The primary method we consider is repeating data, i.e. allocating FLOPs to multiple epochs on the same data. Given a budget of unique data , we split the Chinchilla total data term into two parts: the number of unique tokens used, , and the number of repetitions, (i.e. epochs - 1). Given total training tokens and data budget these terms are simply computed as and . When training for a single epoch like done in prior scaling studies, . We are thus interested in minimizing Equation 1 with the additional constraint of a data budget :
我们主要考虑的方法是重复数据,即把 FLOPs 分配到同一数据上的多个 epoch。给定唯一数据预算 ,我们把 Chinchilla 的总数据项 拆成两部分:所用唯一 token 数 ,以及重复次数 (即 epochs 1)。给定总训练 token 与数据预算 ,这两项简单算为 、。像先前缩放研究那样只训单 epoch 时,。因此我们关心在额外数据预算 约束下最小化式 1:
Symmetrically, for mathematical convenience, we split the parameter term into two parts: the base number of parameters needed to optimally fit the unique tokens , and the number of times to “repeat” this initial allocation, . We compute by first rearranging Equation 3 to find the optimal compute budget for the unique tokens used (). We input this value into the formula of Equation 3 to get . thus corresponds to the compute-optimal number of parameters for or less if . Once we have , we compute the repeat value as .
对称地,为数学方便,我们把参数项 也拆成两部分:最优拟合唯一 token 所需的基础参数量 ,以及把这份初始分配「重复」的次数 。计算 时,先重排式 3 得到所用唯一 token()的最优算力预算,再代入式 3 的 公式得 。因而 对应 的算力最优参数量,或在 时取更小的 。得到 后,重复值算为 。
To empirically explore the scaling behavior in a data-limited setting we train LLMs under these constraints. We consider three different experimental protocols in this work:
为经验探索数据受限设定下的缩放行为,我们在这些约束下训练 LLM。本文考虑三种实验协议:
- • (Fixed Unique Data) In §5 we fix the data constraint and train models varying epochs and parameters. These experiments target Allocation, specifically tradeoff of and .
- • (固定唯一数据) 第 5 节固定数据约束 ,改变 epoch 与参数训练。这些实验针对Allocation,具体是 与 的权衡。
- • (Fixed FLOPs) In §6 we fix the computation available and vary (and thus also and ). These experiments target Return, i.e. how well does repeating scale compared to having more unique data.
- • (固定 FLOPs) 第 6 节固定可用算力,改变 (因而也改变 与 )。这些实验针对Return,即重复相对拥有更多唯一数据缩放得如何。
- • (Parametric Fit) We fit a formula introduced in §3.1 on all our training runs and evaluate its predictive capability throughout §5 and §6.
- • (参数化拟合) 我们在全部训练运行上拟合第 3.1 节引入的公式,并在第 5、6 节评估其预测能力。
Before discussing experimental results we describe the parametric assumptions.
在讨论实验结果前,先描述参数化假设。
3.1 Parametric Fit
To extrapolate scaling curves, it is necessary to incorporate repetition into the Chinchilla formula (Equation 2). We generalize Equation 2 by replacing and with terms corresponding to the effective data () and effective model parameters ().
3.1 参数化拟合
要外推缩放曲线,必须把重复纳入 Chinchilla 公式(式 2)。我们通过把 与 替换为对应有效数据()与有效模型参数()的项,推广式 2。
Intuitively, should be smaller or equal to where is the total number of processed tokens since repeated tokens provide less useful information to the model than new ones. We use an exponential decay formulation, where the value of a data token processed loses roughly fraction of its value per repetition, where is a learned constant. After some derivations and approximations (see Appendix A), this boils down to
直观上, 应小于或等于总处理 token 数 ,因为重复 token 提供的有用信息少于新 token。我们采用指数衰减形式:每重复一次,已处理数据 token 大约失去 比例的价值,其中 为学习常数。经若干推导与近似(见附录 A)后,得到
Note that for (no repetitions), . For , and so
注意:当 (无重复)时,。当 时,,因而
and hence in this case, repeated data is worth almost the same as fresh data. (This is also consistent with the predictions of the “deep bootstrap” framework [76].) As grows, the value of repeated tokens tends to zero, and the effective data becomes much smaller than . The formula implies that no matter how many times we repeat the data, we will not get a better loss than could be obtained with a single epoch on fresh tokens.
此时重复数据几乎与新鲜数据等价。(这也与「深度 bootstrap」框架的预测一致 [76]。)随 增大,重复 token 价值趋于零,有效数据 远小于 。公式意味着:无论重复多少次,损失都不会好过在 个新鲜 token 上单 epoch 所能达到的损失。
Just as processing repeated tokens yields a diminishing return, both intuitively and empirically, models with sizes that vastly outstrip the available data also offer diminishing returns per parameter. Hence we use a symmetric formula for the number of effective parameters, where again is learned,
正如处理重复 token 收益递减,模型规模远超可用数据时,每参数收益也递减——这既合直觉也合经验。因此我们对有效参数数使用对称公式,同样学习 ,
The learned constants , roughly correspond to the “half-life” of repeated data and excess parameters. For example, at , the number of effective tokens is which means that the repeated tokens are worth on average fraction of fresh ones.
学习常数 、 大致对应重复数据与多余参数的「半衰期」。例如在 时,有效 token 数 为 ,意味着 个重复 token 平均只值新鲜 token 的 。
Using a methodology similar to [42], and can be fit on empirical measurements, which yields data-driven estimates. See Appendix A for more details on the derivations and the fitting procedure.
采用与 [42] 类似的方法,可在经验测量上拟合 与 ,得到数据驱动估计。推导与拟合流程见附录 A。
4 Experimental Setup
4 实验设定
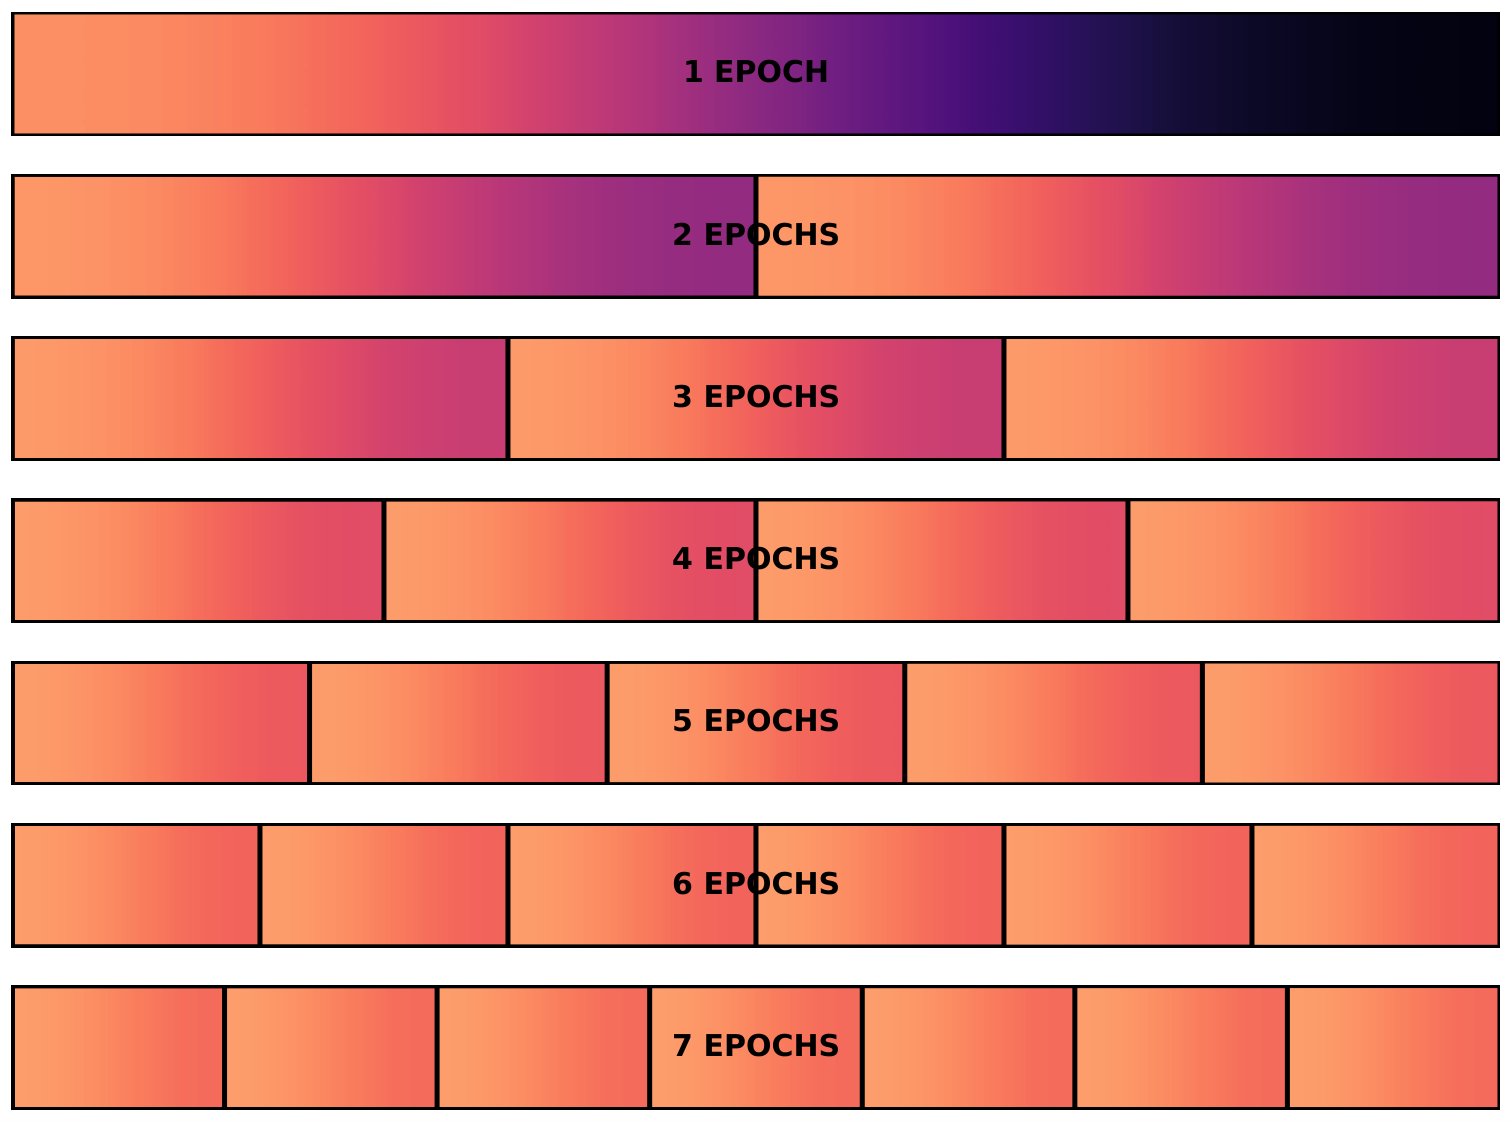
Figure 2: Dataset setup. We ensure that runs using less data (more epochs) always use a subset of the data used in runs with more data (fewer epochs).
图 2:数据集设定。我们确保:使用更少数据(更多 epoch)的运行,始终使用更多数据(更少 epoch)运行所用数据的子集。
For all experiments, we train transformer language models with the GPT-2 architecture and tokenizer [88]. Models have up to 8.7 billion parameters and are trained for up to 900 billion total tokens. Following [42] we use cosine learning rate schedules that decay 10 over the course of training for each model (different schedules led to different estimates in [46]). Unlike [46], we do not use early stopping to also explore the extent of overfitting when repeating. Other hyperparameters are based on prior work [89, 42] and detailed in Appendix S. Models are trained on subsets of C4 [90]. The data constraints are carefully defined to ensure maximal overlap as shown in Figure 2. Unlike [40], we always repeat the entire available data rather than subsets of it. Data is shuffled after each epoch. As repeating data can result in extreme overfitting (see Appendix H), we report loss on a held-out test set unless otherwise specified (see Appendix K). This contrasts training loss used in [42], but should not alter our findings as the held-out data stems from the same underlying dataset.
全部实验中,我们训练带 GPT-2 架构与分词器的 Transformer 语言模型 [88]。模型最多 87 亿参数,最多训 9000 亿总 token。遵循 [42],我们对每个模型使用在训练过程中衰减 的余弦学习率日程(不同日程在 [46] 中导致不同估计)。与 [46] 不同,我们不做早停,以便同时探索重复时的过拟合程度。其余超参基于先前工作 [89, 42],细节见附录 S。模型在 C4 [90] 的子集上训练。数据约束经仔细定义以保证最大重叠,见图 2。与 [40] 不同,我们始终重复全部可用数据而非其子集会。每个 epoch 后打乱数据。由于重复数据可能导致极端过拟合(见附录 H),除非另有说明,我们报告留出测试集上的损失(见附录 K)。这与 [42] 使用的训练损失不同,但不应改变我们的发现,因为留出数据来自同一底层数据集。
5 Results: Resource Allocation for Data-Constrained Scaling
5 结果:数据受限缩放的资源分配
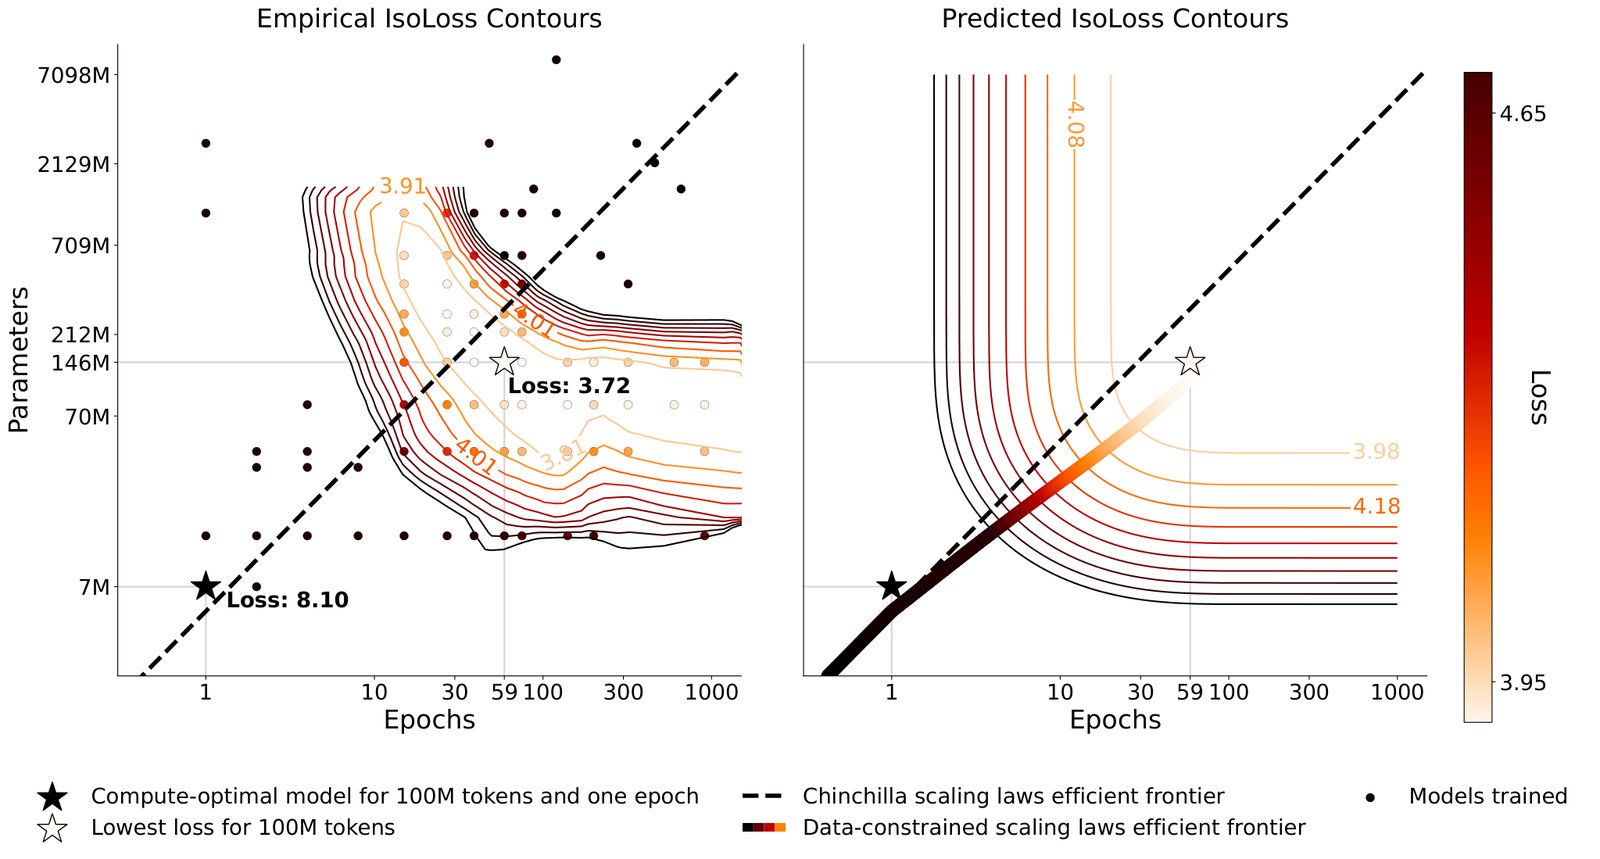
Figure 3: IsoLoss contours for 100 million unique tokens. (Left): 93 models trained with varying parameters and epochs on a fixed dataset. Contours show an interpolation of results with the same final test loss. (Right): Comparison with the loss predictions from our proposed scaling laws for the same budget of 100 million unique tokens and the predicted efficient frontier. The diminishing returns from training on repeated data can be seen in the increase in distance of the contour curves.
图 3:1 亿唯一 token 的 IsoLoss 等高线。*(左):在固定数据集上以不同参数与 epoch 训练的 93 个模型。等高线为相同最终测试损失结果的插值。(右):*与我们提出的缩放律在同一 1 亿唯一 token 预算下的损失预测及预测高效前沿比较。等高线间距增大,可见重复数据训练的收益递减。
Our first experimental setting considers scaling in a setting where all models have the same data constraint. For these experiments, the unique training data budget is fixed at either 100M, 400M or 1.5B tokens. For each data budget, we train a set of language models with increasing amounts of compute that is allocated to either more parameters or more epochs on the unique training data.
第一种实验设定考察所有模型具有相同数据约束时的缩放。这些实验中,唯一训练数据预算 固定为 100M、400M 或 1.5B token。对每个数据预算,我们训练一组语言模型,把递增算力分配给更多参数,或在唯一训练数据上训更多 epoch。
Figure 3(left) shows the main results for scaling with 100M unique tokens[^2] (see Appendix C for 400M and 1.5B tokens). For 100M tokens, the corresponding one-epoch compute-optimal model according to scaling laws from [42] has of approximately 7M parameters (see Appendix B for the scaling coefficients we use). Results show that more than a 50% reduction in loss can be attained by training for several epochs () and increasing model size beyond what would be compute-optimal for 100M tokens (). We find the best loss to be at around 20-60 more parameters and epochs, which corresponds to spending around 7000 more FLOPs. These results suggest that one-epoch models significantly under-utilize their training data and more signal can be extracted by repeating data and adding parameters at the cost of sub-optimal compute utilization.
图 3(左)展示在 1 亿唯一 token 上缩放的主要结果[^2](400M 与 1.5B token 见附录 C)。对 1 亿 token,按 [42] 缩放律对应的单 epoch 算力最优模型, 约 700 万参数(我们使用的缩放系数见附录 B)。结果表明:通过训多个 epoch()并把模型规模增到超过对 1 亿 token 算力最优的规模(),损失可降低超过 50%。我们发现最佳损失大约在参数与 epoch 各多约 20–60 处,对应多花约 7000 FLOPs。这些结果提示:单 epoch 模型显著未充分利用其训练数据;以次优算力利用为代价,通过重复数据并增加参数,可以提取更多信号。
Figure 3(right) shows the predicted contours created by fitting our data-constrained scaling laws on 182 training runs. In the single-epoch case () with near compute-optimal parameters () our scaling equation (§3.1) reduces to the Chinchilla equation. In this case, both formulas predict the optimal allocation of compute to parameters and data to be the same, resulting in overlapping efficient frontiers. As data is repeated for more than a single epoch, our fit predicts that excess parameters decay faster in value than repeated data (). As a result, the data-constrained efficient frontier suggests allocating most additional compute to more epochs rather than more parameters. This contrasts the Chinchilla scaling laws [42], which suggest equally scaling both. However, note that they do not repeat the entire training data and their parametric fit explicitly relies on the assumption that models are trained for a single epoch only. Thus, there is no guarantee that their scaling predictions hold for repeated data.
图 3(右)展示在 182 次训练运行上拟合数据受限缩放律得到的预测等高线。在单 epoch()且近算力最优参数()时,我们的缩放方程(§3.1)退化为 Chinchilla 方程。此时两公式对参数与数据的最优算力分配预测相同,高效前沿重叠。当数据重复超过单 epoch 时,我们的拟合预测多余参数价值衰减快于重复数据()。因此,数据受限高效前沿建议把多数追加算力分给更多 epoch 而非更多参数。这与 Chinchilla 缩放律 [42]「二者同等放大」的建议相反。但注意:他们并不重复全部训练数据,且参数化拟合显式依赖模型只训单 epoch 的假设。因此,其缩放预测对重复数据并无保证。
| FLOP budget () | Parameters () | Training tokens () | Data budget () |
|---|---|---|---|
| B | 55B | B | |
| B | 84B | B | |
| B | 178B | B |
Figure 4: Validation Loss for Different Data Constraints (IsoFLOP). Each curve represents the same number of FLOPs spent on an equal size model. Colors represent different numbers of epochs due to repeating because of data constraints. Parameters and training tokens are set to match the single-epoch compute-optimal configurations for the given FLOPs. Models trained on data that is repeated for multiple epochs have consistently worse loss and diverge if too many epochs are used.
| FLOP 预算 () | 参数 () | 训练 token () | 数据预算 () |
|---|---|---|---|
| B | 55B | B | |
| B | 84B | B | |
| B | 178B | B |
图 4:不同数据约束下的验证损失(IsoFLOP)。每条曲线表示在同等规模模型上花费相同 FLOPs。颜色表示因数据约束而重复导致的不同 epoch 数。参数与训练 token 设为匹配给定 FLOPs 的单 epoch 算力最优配置。在因重复而多 epoch 的数据上训练的模型损失一贯更差;epoch 过多时会发散。
For all three data budgets, our results suggest that Allocation is optimized by scaling epochs faster than additional parameters. We confirm this at scale by training the data-constrained compute-optimal model for FLOPs and 25 billion unique tokens as suggested by our efficient frontier. Despite having 27% less parameters, this model achieves better loss than the model suggested by the Chinchilla scaling laws (Figure 1, right). Similarly, the 120 billion parameter Galactica model trained on repeated data should have been significantly smaller according to data-constrained scaling laws (Appendix G). An additional benefit of using a smaller model is cheaper inference, though adding parameters can make it easier to parallelize training across GPUs.
对全部三个数据预算,我们的结果都建议:Allocation 通过比追加参数更快地放大 epoch 来优化。我们按高效前沿建议,在 FLOPs 与 250 亿唯一 token 上训练数据受限算力最优模型,在大规模上确认这一点。尽管参数少 27%,该模型损失仍优于 Chinchilla 缩放律建议的模型(图 1,右)。类似地,按数据受限缩放律,在重复数据上训练的 1200 亿参数 Galactica 模型本应显著更小(附录 G)。使用更小模型的额外好处是推理更便宜,尽管增加参数可使跨 GPU 并行训练更容易。
Adding parameters and epochs causes the loss to decrease and eventually increase again, suggesting that too much compute can hurt performance. Results from [46] also show that loss can increase when too many parameters are used, even with early stopping. However, we expect that appropriate regularization (such as simply removing all excess parameters as an extreme case) could prevent this behavior. Thus, our formula presented in §3 and its predicted isoLoss contours in Figure 3 do not model the possibility that excess epochs or parameters could hurt performance.
增加参数与 epoch 会使损失先降后升,提示算力过多可能损害性能。[46] 的结果也显示:即便早停,参数过多时损失仍可能上升。不过我们预期适当正则(极端情形下干脆去掉全部多余参数)可防止该行为。因此,第 3 节公式及其在图 3 中预测的 isoLoss 等高线,并不建模多余 epoch 或参数可能损害性能的可能性。
6 Results: Resource Return for Data-Constrained Scaling
6 结果:数据受限缩放的资源回报
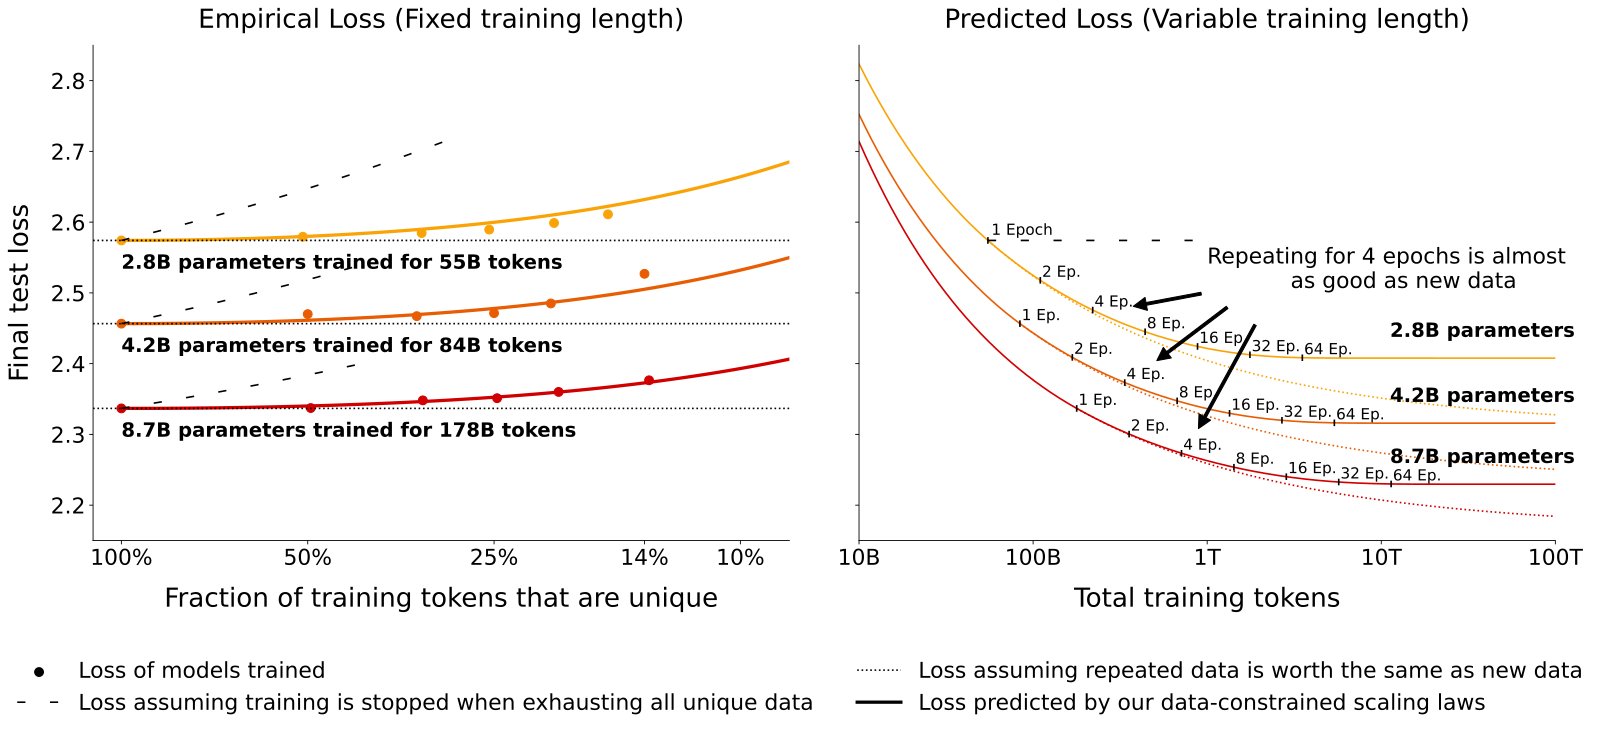
Figure 5: Empirical and Extrapolated loss with constrained data. (Left): Loss as a function of repeated tokens for three different training budgets each with fixed number of parameters. Loss curves predicted by our data-constrained scaling laws are shifted to exactly match the loss at 100% unique data. Return on FLOPs decays with repeated data in a regular pattern. (Right): Extrapolating from the proposed data-constrained scaling law shows that at small numbers epochs are benign, but at large number of epochs loss stops improving.
图 5:约束数据下的经验与外推损失。*(左):三组不同训练预算、各自固定参数量下,损失随重复 token 的变化。数据受限缩放律预测的损失曲线平移以精确匹配 100% 唯一数据处的损失。重复数据上 FLOPs 的回报按规律衰减。(右):*按提出的数据受限缩放律外推显示:少量 epoch 无害,但 epoch 很多时损失停止改进。
Next, consider the question of Return on scaling. To quantify this value, we run experiments with three FLOP budgets across eight respective data budgets to compare return on FLOPs.
接下来考虑缩放的Return问题。为量化该价值,我们在三组 FLOP 预算、各自八组数据预算上做实验,比较 FLOPs 的回报。
Figure 4shows the configurations and validation curves for models trained on the same number of total tokens. Conforming to intuition and prior work on deduplication [55], repeated data is worth less, thus models trained on less unique data (and, correspondingly, more epochs) have consistently higher loss. However, the loss difference for a few epochs is negligible. For example, the billion parameter model trained for four epochs ( billion unique tokens) finishes training with only 0.5% higher validation loss than the single-epoch model ( billion unique tokens).
图 4 展示在相同总 token 数上训练的模型配置与验证曲线。符合直觉与去重相关先前工作 [55]:重复数据价值更低,因而在更少唯一数据(相应更多 epoch)上训练的模型损失一贯更高。但对少量 epoch,损失差异可忽略。例如, 亿参数、训四个 epoch( 亿唯一 token)的模型,最终验证损失仅比单 epoch 模型( 亿唯一 token)高 0.5%。
In Figure 5 (left), we compare the final test loss of each model to predictions from our parametric fit. The data-constrained scaling laws can accurately measure the decay in the value of repeated data as seen by the proximity of empirical results (dots) and parametric fit (lines). We note however that it significantly underestimates the final test loss of failing models where loss increases midway through training, such as models trained for 44 epochs (not depicted).
图 5(左)把每个模型的最终测试损失与参数化拟合预测比较。数据受限缩放律能准确度量重复数据价值的衰减,可见经验结果(点)与参数化拟合(线)接近。但我们注意到:对训练中途损失上升的失败模型(如训 44 个 epoch,图中未画),它显著低估最终测试损失。
In Figure 5 (right), we extrapolate the three budgets by further scaling compute while keeping the data constraints () at 55B, 84B, and 178B tokens, respectively. The parameter introduced in §3 represents roughly the “half-life” of epochs: specifically the point where repeated tokens have lost of their value. Through our fitting in Appendix A, we found , corresponding to 15 repetitions (or 16 epochs). Graphically, this can be seen by the stark diminishing returns in the proximity of the 16-epoch marker and the flattening out soon after.
图 5(右)在保持数据约束()分别为 55B、84B 与 178B token 的前提下进一步放大算力,外推三组预算。第 3 节引入的参数 大致表示 epoch 的「半衰期」:具体是重复 token 失去 价值的点。经附录 A 的拟合,我们得到 ,对应 15 次重复(或 16 个 epoch)。图上可在 16-epoch 标记附近看到收益急剧递减,并很快趋平。
Overall, the Return when repeating data is relatively good. Meaningful gains from repeating data can be made up to around 16 epochs () beyond which returns diminish extremely fast.
总体而言,重复数据的Return相对不错。重复数据带来的有意义收益大约可持续到 16 个 epoch(),之后收益衰减极快。
7 Results: Complementary Strategies for Obtaining Additional Data
7 结果:获取额外数据的互补策略
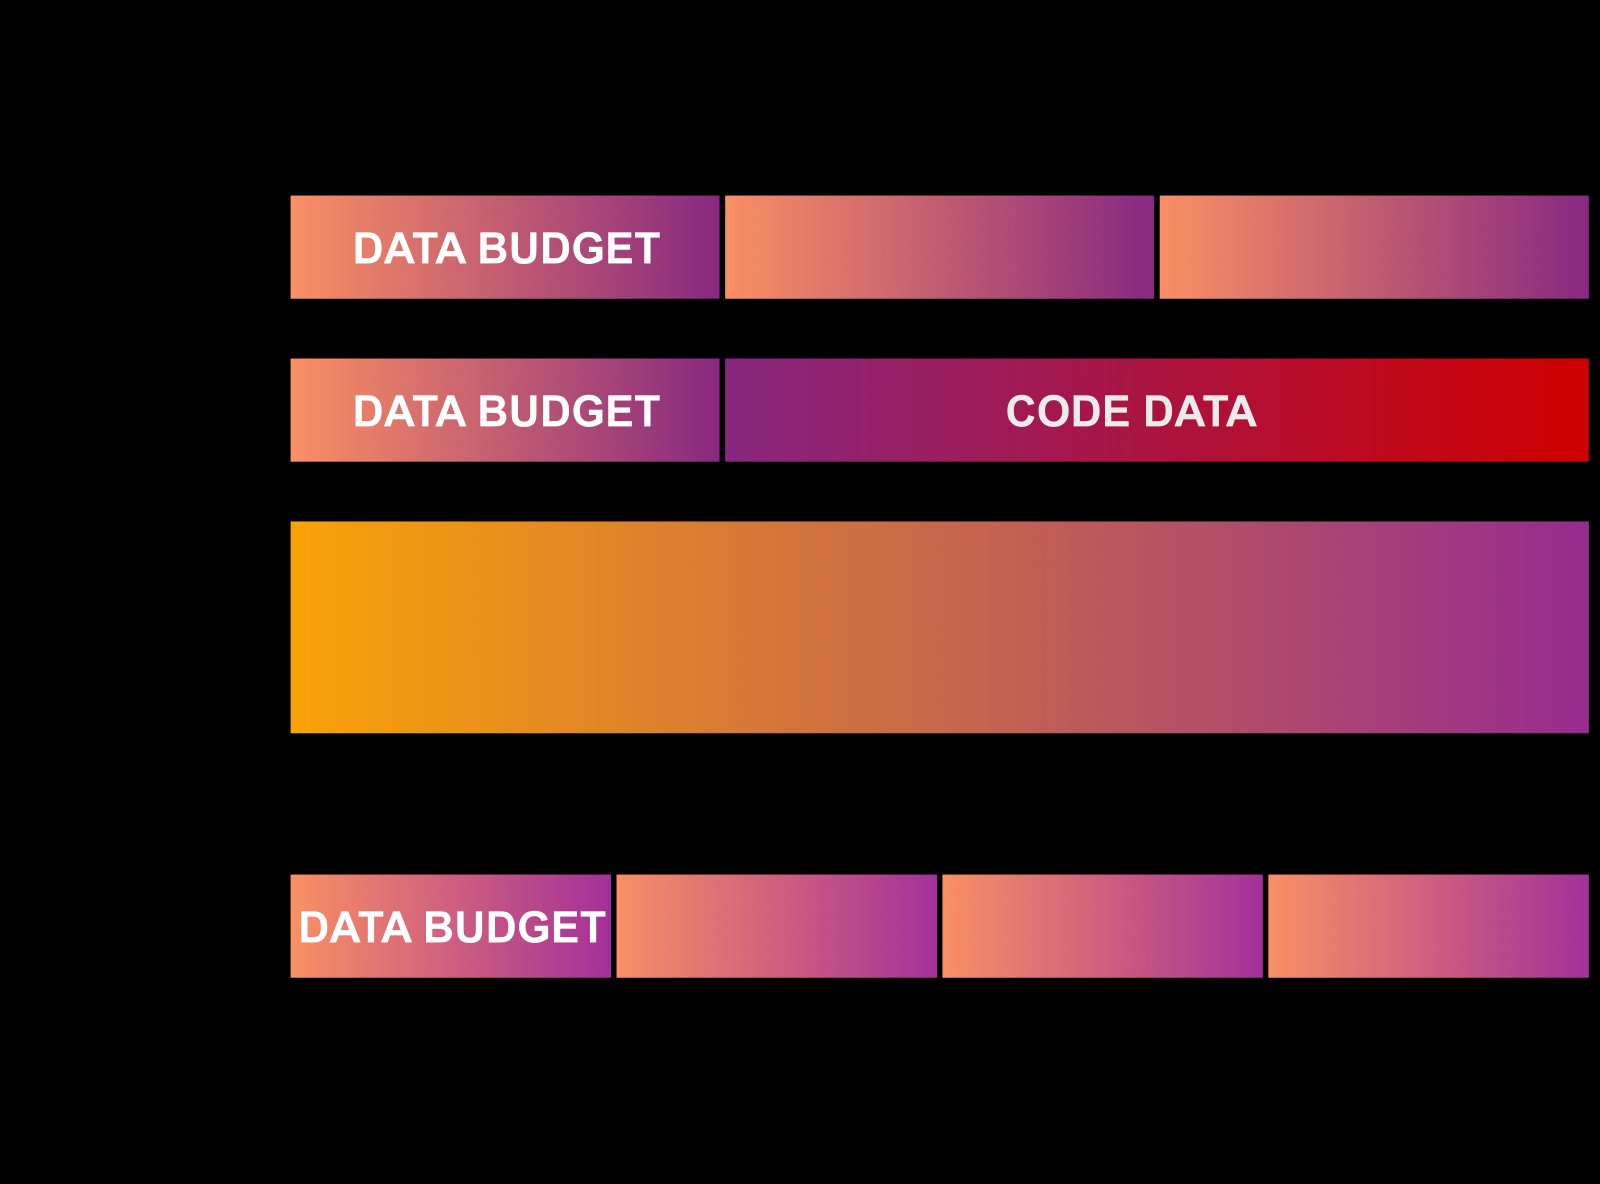
Figure 6: Strategies for data-constrained settings and their downstream performance. (Left): Schematic showing alternative data use strategies of code filling and filtering. (Right): billion parameter models trained for a total of billion tokens with varying budgets . For repeating and filling with code, five models with different seeds are trained for each dot and the standard deviation is visualized as the shaded area.
图 6:数据受限设定下的策略及其下游表现。(左):示意代码填充与过滤等替代数据使用策略。(右): 亿参数模型,总训 亿 token,改变预算 。对重复与用代码填充,每个点训五个不同种子模型,阴影为标准差。
While repeating data is effective, it has diminishing returns. We therefore consider strategies for scaling targeting improved downstream performance as opposed to directly minimizing loss.
尽管重复有效,但收益递减。因此我们考虑以改进下游表现为目标、而非直接最小化损失的放大 策略。
Figure 6 (left) illustrates the strategies: (a) Code augmentation: We use Python code from The Stack [49] to make up for missing natural language data. The combined dataset consisting of code and natural language samples is shuffled randomly. (b) Adapting filtering: We investigate the performance impact of deduplication and perplexity filtering, two common filtering steps that can severely limit available data. Removing such filtering steps can free up additional training data.
图 6(左)示意策略:(a) 代码增强:用 The Stack [49] 的 Python 代码补足缺失的自然语言数据。由代码与自然语言样本组成的合并数据集随机打乱。(b) 调整过滤:我们考察去重与困惑度过滤这两类常会严重限制可用数据的过滤步骤的性能影响。去掉此类过滤可释放额外训练数据。
For these experiments, we set a maximum data budget () of 84 billion tokens. For repetition and code filling, only a subset of is available and the rest needs to be compensated for via repeating or adding code. For both filtering methods, we start out with approximately twice the budget (178 billion tokens), as it is easier to gather noisy data and filter it than it is to gather clean data for training. For perplexity filtering, we select the top 25% samples with the lowest perplexity according to a language model trained on Wikipedia. This results in 44 billion tokens that are repeated for close to two epochs to reach the full data budget. For deduplication filtering, all samples with a 100-char overlap are removed resulting in 21 billion tokens that are repeated for four epochs during training. See Appendix N for more details on the filtering procedures.
这些实验中,我们设最大数据预算()为 840 亿 token。对重复与代码填充,只有 的子集可用,其余需通过重复或加代码补齐。对两种过滤方法,我们从大约两倍预算(1780 亿 token)起步,因为收集嘈杂数据再过滤,往往比收集干净训练数据更容易。对困惑度过滤,我们按在 Wikipedia 上训练的语言模型选取困惑度最低的前 25% 样本,得到 440 亿 token,再重复近两个 epoch 达到完整数据预算。对去重过滤,去掉有 100 字符重叠的全部样本,得到 210 亿 token,训练中重复四个 epoch。过滤流程细节见附录 N。
When comparing across data strategies, loss ceases to be a good evaluation metric as the models are trained on different data distributions. We thus evaluate models on 19 natural language tasks with zero to five in-context few-shot exemplars [15] producing 114 scores per model. As our evaluation tasks cover different metrics and random baselines, we re-scale all scores to be in the same range to better reflect performance ranges before averaging. Details on the evaluation datasets are in Appendix K.
跨数据策略比较时,损失不再是好评测指标,因为模型训在不同数据分布上。因此我们在 19 个自然语言任务上、以零到五个上下文少样本样例评测模型 [15],每个模型产生 114 个分数。由于评测任务覆盖不同指标与随机基线,我们在平均前把所有分数重缩放到同一区间,以更好反映表现范围。评测数据集细节见附录 K。
In Figure 6 (right) we compare the downstream performance of all strategies. For repeating data, differences in downstream performance are insignificant for up to around 4 epochs (25% budget) and then start dropping, which aligns with our results on test loss in §6. Filling up to 50% of data with code (42 billion tokens) also shows no deterioration. Beyond that, performance decreases quickly on natural language tasks. However, adding more code data may benefit non-natural language tasks, which are not considered in the benchmarking. Two of the tasks benchmarked, WebNLG [17, 34], a generation task, and bAbI [122, 57], a reasoning task, see jumps in performance as soon as code is added, possibly due to code enabling models to learn long-range state-tracking capabilities beneficial for these tasks.
图 6(右)比较全部策略的下游表现。对重复数据,最多约 4 个 epoch(25% 预算)下游表现差异不显著,之后开始下降,与第 6 节测试损失结果一致。用代码填充最多 50% 数据(420 亿 token)也未见恶化。超过该比例,自然语言任务表现迅速下降。不过,加入更多代码数据可能有利于未纳入基准的非自然语言任务。所测任务中,生成任务 WebNLG [17, 34] 与推理任务 bAbI [122, 57] 在一加入代码后表现即跃升,可能因代码使模型学到对这类任务有益的长程状态跟踪能力。
Of the filtering approaches, we find perplexity-filtering to be effective, while deduplication does not help. Prior work found deduplication was able to improve perplexity [55]; however, it did not evaluate on downstream tasks. Deduplication may have value not captured in our benchmark, such as reducing memorization [45, 40, 16, 10]. We also investigate filtering on a different noisier dataset in Appendix O, where we find it to be more effective. Overall, in a data-constrained regime, we recommend reserving filtering for noisy datasets and using both code augmentation and repeating to increase data tokens. For example, first doubling the available data by adding code and then repeating the new dataset for four epochs results in 8 more training tokens that are expected to be just as good as having had 8 more unique data from the start.
在过滤方法中,我们发现困惑度过滤有效,而去重无帮助。先前工作发现去重能改进困惑度 [55];但未在下游任务上评测。去重可能具有我们基准未捕捉的价值,如减少记忆 [45, 40, 16, 10]。我们也在附录 O 考察了另一更嘈杂数据集上的过滤,发现更有效。总体而言,在数据受限情形下,我们建议把过滤留给嘈杂数据集,并用代码增强与重复二者增加数据 token。例如:先加代码使可用数据翻倍,再把新数据集重复四个 epoch,可得到 训练 token,预期与一开始就有 唯一数据一样好。
8 Related Work
8 相关工作
Large language models Scaling up transformer language models [111] across parameter count and training data has been shown to result in continuous performance gains [19]. Starting with the 1.4 billion parameter GPT-2 model [88], a variety of scaled-up language models have been trained, commonly referred to as large language models (LLMs). They can be grouped into dense models [15, 47, 58, 89, 20, 13, 132, 109, 103, 108, 130, 95, 56, 65] and sparse models [30, 131, 28, 135] depending on whether each forward pass makes use of all parameters. These models are generally pre-trained to predict the next token in a sequence, which makes them applicable to various language tasks directly after pre-training [15, 118, 50, 71, 102] by reformulating said NLP tasks as context continuation tasks (see [67] for an earlier proposal on this topic). We focus on the most common scenario, where a dense transformer model is trained to do next-token prediction on a large corpus and evaluated directly after pre-training using held-out loss or zero- to few-shot prompting.
大规模语言模型 在参数量与训练数据上放大 Transformer 语言模型 [111] 已被表明带来持续性能增益 [19]。自 14 亿参数的 GPT-2 [88] 起,已训练多种放大语言模型,通常称为大规模语言模型(LLM)。按每次前向是否使用全部参数,可分为稠密模型 [15, 47, 58, 89, 20, 13, 132, 109, 103, 108, 130, 95, 56, 65] 与稀疏模型 [30, 131, 28, 135]。这些模型一般预训练为预测序列中下一 token,因而可在预训练后直接用于多种语言任务 [15, 118, 50, 71, 102],做法是把 NLP 任务改写为上下文续写任务(该主题的更早提议见 [67])。我们聚焦最常见情形:稠密 Transformer 在大语料上做下一 token 预测,并在预训练后用留出损失或零到少样本提示直接评测。
Scaling laws Prior work has estimated an optimal allocation of compute for the training of LLMs. Kaplan et al. 2020 suggested a 10 increase in compute should be allocated to a 5.5 increase in model size and a 1.8 increase in training tokens. This first scaling law has led to the creation of very large models trained on relatively little data, such as the 530 billion parameter MT-NLG model trained on 270 billion tokens [99]. More recent work [42], however, showed that model size and training data should rather be scaled in equal proportions. These findings called for a renewed focus on the scaling of pre-training data rather than scaling model size via complex parallelization strategies [98, 91, 9, 78]. Up-sampling is often employed when pre-training data is partly limited, such as data from a high-quality domain like Wikipedia or text in a rare language for training multilingual LLMs [60, 82]. Hernandez et al. 2022 study up-sampling of data subsets and find that repeating only 0.1% of training data 100 times significantly degrades performance. In contrast, our work focuses on repeating the entire pre-training corpus for multiple epochs rather than up-sampling parts of it.
缩放律 先前工作估计了 LLM 训练的最优算力分配。Kaplan et al. 2020 建议算力增加 时应把模型规模增约 、训练 token 增约 。第一条缩放律催生了在相对较少数据上训练的很大模型,如在 2700 亿 token 上训练的 5300 亿参数 MT-NLG [99]。但更近期工作 [42] 表明,模型规模与训练数据应按等比例放大。这些发现要求重新关注预训练数据的放大,而非仅靠复杂并行策略放大模型规模 [98, 91, 9, 78]。当预训练数据部分受限时(如 Wikipedia 等高质领域,或训练多语 LLM 时的稀有语言文本)常采用上采样 [60, 82]。Hernandez et al. 2022 研究数据子集上采样,发现仅把 0.1% 训练数据重复 100 次就会显著损害表现。相较之下,我们的工作聚焦把整个预训练语料重复多个 epoch,而非上采样其中部分。
Alternative data strategies Large pre-training datasets are commonly filtered to remove undesired samples or reduce noise [101]. Perplexity-based filtering, whereby a trained model is used to filter out samples with high perplexity, has been found beneficial to reduce noise in web-crawled datasets [121]. Mixing of data is employed for the pre-training data of multilingual LLMs, where text data from different languages is combined [23, 126, 100, 74]. However, both for code and natural language models, mixing different (programming) languages has been reported to under-perform monolingual models [80, 113]. Some work has investigated mixing code and natural language data for prediction tasks, such as summarizing code snippets [44] or predicting function names [4]. Several pre-training datasets for LLMs include low amounts of code data [31, 89, 95]. However, these past works generally do not provide any ablation on the drawbacks of including code or the benefits for natural language task performance. We perform a detailed benchmarking of mixing Python and natural language in LLM pre-training at 10 different mixing rates.
替代数据策略 大型预训练数据集常被过滤以去除不良样本或降低噪声 [101]。基于困惑度的过滤——用训练好的模型滤掉高困惑度样本——被发现有助于降低网络抓取数据集的噪声 [121]。多语 LLM 的预训练数据会混合不同语言的文本 [23, 126, 100, 74]。但对代码与自然语言模型,混合不同(编程)语言都被报告弱于单语模型 [80, 113]。一些工作研究为摘要代码片段 [44] 或预测函数名 [4] 等预测任务混合代码与自然语言。若干 LLM 预训练数据集包含少量代码 [31, 89, 95]。但这些先前工作通常不提供纳入代码的代价或对自然语言任务收益的消融。我们在 10 种混合比例下,对 LLM 预训练中混合 Python 与自然语言做了详细基准评测。
9 Conclusion
9 结论
This work studies data-constrained scaling, focusing on the optimal use of computational resources when unique data is limited. We propose an extension to the Chinchilla scaling laws that takes into account the decay in value of repeated data, and we fit this function using a large set of controlled experiments. We find that despite recommendations of earlier work, training large language models for multiple epochs by repeating data is beneficial and that scaling laws continue to hold in the multi-epoch regime, albeit with diminishing returns. We also consider complementary approaches to continue scaling models, and find that code gives the ability to scale an additional 2. We believe that our findings will enable further scaling of language models to unlock new capabilities with current data. However, our work also indicates that there are limits on the scaling horizon. In addition to collecting additional data, researchers should explore using current data in a more effective manner.
本文研究数据受限缩放,聚焦唯一数据有限时计算资源的最优使用。我们提出对 Chinchilla 缩放律的扩展,计入重复数据价值衰减,并用大量受控实验拟合该函数。我们发现:尽管早期工作有不同建议,通过重复数据多 epoch 训练大规模语言模型是有益的,且缩放律在多 epoch 情形下仍然成立,只是收益递减。我们还考虑继续放大模型的互补方法,发现代码能额外提供约 的缩放空间。我们相信这些发现将使语言模型在现有数据上进一步放大、解锁新能力。但工作也表明缩放视野存在极限。除收集更多数据外,研究者还应探索更有效地使用当前数据。
Acknowledgments and Disclosure of Funding
致谢与资助披露
This work was co-funded by the European Union under grant agreement No 101070350. The authors wish to acknowledge CSC – IT Center for Science, Finland, for generous computational resources on the LUMI supercomputer.[^3] We are thankful for the immense support from teams at LUMI and AMD, especially Samuel Antao. Hugging Face provided storage and additional compute instances. This work was supported by a Simons Investigator Fellowship, NSF grant DMS-2134157, DARPA grant W911NF2010021, and DOE grant DE-SC0022199. We are grateful to Harm de Vries, Woojeong Kim, Mengzhou Xia and the EleutherAI community for exceptional feedback. We thank Loubna Ben Allal for help with the Python data and Big Code members for insightful discussions on scaling laws. We thank Thomas Wang, Helen Ngo and TurkuNLP members for support on early experiments.
本工作由欧盟资助协议 No 101070350 共同资助。作者感谢芬兰 CSC – IT Center for Science 在 LUMI 超级计算机上提供的慷慨算力资源。[^3]我们感谢 LUMI 与 AMD 团队尤其是 Samuel Antao 的大力支持。Hugging Face 提供了存储与额外计算实例。本工作得到 Simons Investigator Fellowship、NSF 资助 DMS-2134157、DARPA 资助 W911NF2010021 与 DOE 资助 DE-SC0022199 支持。感谢 Harm de Vries、Woojeong Kim、Mengzhou Xia 与 EleutherAI 社区的出色反馈。感谢 Loubna Ben Allal 在 Python 数据上的帮助,以及 Big Code 成员关于缩放律的深入讨论。感谢 Thomas Wang、Helen Ngo 与 TurkuNLP 成员对早期实验的支持。
References
参考文献
Aghajanyan et al. [2023] Armen Aghajanyan, Lili Yu, Alexis Conneau, Wei-Ning Hsu, Karen Hambardzumyan, Susan Zhang, Stephen Roller, Naman Goyal, Omer Levy, and Luke Zettlemoyer. 2023. Scaling Laws for Generative Mixed-Modal Language Models. arXiv preprint arXiv:2301.03728 .
Alabdulmohsin et al. [2022] Ibrahim M Alabdulmohsin, Behnam Neyshabur, and Xiaohua Zhai. 2022. Revisiting neural scaling laws in language and vision. Advances in Neural Information Processing Systems , 35:22300–22312.
Allal et al. [2023] Loubna Ben Allal, Raymond Li, Denis Kocetkov, Chenghao Mou, Christopher Akiki, Carlos Munoz Ferrandis, Niklas Muennighoff, Mayank Mishra, Alex Gu, Manan Dey, et al. 2023. SantaCoder: don’t reach for the stars! arXiv preprint arXiv:2301.03988 .
Allamanis et al. [2015] Miltiadis Allamanis, Earl T Barr, Christian Bird, and Charles Sutton. 2015. Suggesting accurate method and class names. In Proceedings of the 2015 10th joint meeting on foundations of software engineering , pages 38–49.
Bach et al. [2022] Stephen H. Bach, Victor Sanh, Zheng-Xin Yong, Albert Webson, Colin Raffel, Nihal V. Nayak, Abheesht Sharma, Taewoon Kim, M Saiful Bari, Thibault Fevry, Zaid Alyafeai, Manan Dey, Andrea Santilli, Zhiqing Sun, Srulik Ben-David, Canwen Xu, Gunjan Chhablani, Han Wang, Jason Alan Fries, Maged S. Al-shaibani, Shanya Sharma, Urmish Thakker, Khalid Almubarak, Xiangru Tang, Xiangru Tang, Mike Tian-Jian Jiang, and Alexander M. Rush. 2022. PromptSource: An Integrated Development Environment and Repository for Natural Language Prompts .
Bahri et al. [2021] Yasaman Bahri, Ethan Dyer, Jared Kaplan, Jaehoon Lee, and Utkarsh Sharma. 2021. Explaining neural scaling laws. arXiv preprint arXiv:2102.06701 .
Bansal et al. [2022] Yamini Bansal, Behrooz Ghorbani, Ankush Garg, Biao Zhang, Colin Cherry, Behnam Neyshabur, and Orhan Firat. 2022. Data scaling laws in NMT: The effect of noise and architecture. In International Conference on Machine Learning , pages 1466–1482. PMLR.
Bender et al. [2021] Emily M. Bender, Timnit Gebru, Angelina McMillan-Major, and Shmargaret Shmitchell. 2021. On the Dangers of Stochastic Parrots: Can Language Models Be Too Big? In Proceedings of the 2021 ACM Conference on Fairness, Accountability, and Transparency , pages 610–623.
Bian et al. [2021] Zhengda Bian, Hongxin Liu, Boxiang Wang, Haichen Huang, Yongbin Li, Chuanrui Wang, Fan Cui, and Yang You. 2021. Colossal-AI: A unified deep learning system for large-scale parallel training. arXiv preprint arXiv:2110.14883 .
Biderman et al. [2023a] Stella Biderman, USVSN Sai Prashanth, Lintang Sutawika, Hailey Schoelkopf, Quentin Anthony, Shivanshu Purohit, and Edward Raf. 2023a. Emergent and Predictable Memorization in Large Language Models. arXiv preprint arXiv:2304.11158 .
Biderman et al. [2023b] Stella Biderman, Hailey Schoelkopf, Quentin Anthony, Herbie Bradley, Kyle O’Brien, Eric Hallahan, Mohammad Aflah Khan, Shivanshu Purohit, USVSN Sai Prashanth, Edward Raff, et al. 2023b. Pythia: A suite for analyzing large language models across training and scaling. arXiv preprint arXiv:2304.01373 .
Bisk et al. [2020] Yonatan Bisk, Rowan Zellers, Ronan Le Bras, Jianfeng Gao, and Yejin Choi. 2020. PIQA: Reasoning about Physical Commonsense in Natural Language. In Thirty-Fourth AAAI Conference on Artificial Intelligence .
Black et al. [2022] Sid Black, Stella Biderman, Eric Hallahan, Quentin Anthony, Leo Gao, Laurence Golding, Horace He, Connor Leahy, Kyle McDonell, Jason Phang, et al. 2022. GPT-NeoX-20B: An Open-Source Autoregressive Language Model. arXiv preprint arXiv:2204.06745 .
Black et al. [2021] Sid Black, Leo Gao, Phil Wang, Connor Leahy, and Stella Biderman. 2021. GPT-Neo: Large scale autoregressive language modeling with mesh-tensorflow. If you use this software, please cite it using these metadata , 58.
Brown et al. [2020] Tom Brown, Benjamin Mann, Nick Ryder, Melanie Subbiah, Jared D Kaplan, Prafulla Dhariwal, Arvind Neelakantan, Pranav Shyam, Girish Sastry, Amanda Askell, et al. 2020. Language models are few-shot learners. Advances in neural information processing systems , 33:1877–1901.
Carlini et al. [2022] Nicholas Carlini, Daphne Ippolito, Matthew Jagielski, Katherine Lee, Florian Tramer, and Chiyuan Zhang. 2022. Quantifying memorization across neural language models. arXiv preprint arXiv:2202.07646 .
Castro Ferreira et al. [2020] Thiago Castro Ferreira, Claire Gardent, Nikolai Ilinykh, Chris van der Lee, Simon Mille, Diego Moussallem, and Anastasia Shimorina. 2020. The 2020 Bilingual, Bi-Directional WebNLG+ Shared Task Overview and Evaluation Results (WebNLG+ 2020). In Proceedings of the 3rd WebNLG Workshop on Natural Language Generation from the Semantic Web (WebNLG+ 2020) , pages 55–76, Dublin, Ireland (Virtual). Association for Computational Linguistics.
Chen et al. [2020] Mark Chen, Alec Radford, Rewon Child, Jeffrey Wu, Heewoo Jun, David Luan, and Ilya Sutskever. 2020. Generative pretraining from pixels. In International conference on machine learning , pages 1691–1703. PMLR.
Chowdhery et al. [2022] Aakanksha Chowdhery, Sharan Narang, Jacob Devlin, Maarten Bosma, Gaurav Mishra, Adam Roberts, Paul Barham, Hyung Won Chung, Charles Sutton, Sebastian Gehrmann, et al. 2022. Palm: Scaling language modeling with pathways. arXiv preprint arXiv:2204.02311 .
Chung et al. [2022] Hyung Won Chung, Le Hou, Shayne Longpre, Barret Zoph, Yi Tay, William Fedus, Eric Li, Xuezhi Wang, Mostafa Dehghani, Siddhartha Brahma, Albert Webson, Shixiang Shane Gu, Zhuyun Dai, Mirac Suzgun, Xinyun Chen, Aakanksha Chowdhery, Sharan Narang, Gaurav Mishra, Adams Yu, Vincent Zhao, Yanping Huang, Andrew Dai, Hongkun Yu, Slav Petrov, Ed H. Chi, Jeff Dean, Jacob Devlin, Adam Roberts, Denny Zhou, Quoc V. Le, and Jason Wei. 2022. Scaling Instruction-Finetuned Language Models . arXiv preprint arXiv:2210.11416 .
Clark et al. [2019] Christopher Clark, Kenton Lee, Ming-Wei Chang, Tom Kwiatkowski, Michael Collins, and Kristina Toutanova. 2019. BoolQ: Exploring the Surprising Difficulty of Natural Yes/No Questions. In NAACL .
Clark et al. [2018] Peter Clark, Isaac Cowhey, Oren Etzioni, Tushar Khot, Ashish Sabharwal, Carissa Schoenick, and Oyvind Tafjord. 2018. Think you have Solved Question Answering? Try ARC, the AI2 Reasoning Challenge. arXiv:1803.05457v1 .
Conneau et al. [2019] Alexis Conneau, Kartikay Khandelwal, Naman Goyal, Vishrav Chaudhary, Guillaume Wenzek, Francisco Guzmán, Edouard Grave, Myle Ott, Luke Zettlemoyer, and Veselin Stoyanov. 2019. Unsupervised Cross-lingual Representation Learning at Scale. arXiv preprint arXiv:1911.02116 .
Dagan et al. [2006] Ido Dagan, Oren Glickman, and Bernardo Magnini. 2006. The pascal recognising textual entailment challenge. In Machine Learning Challenges. Evaluating Predictive Uncertainty, Visual Object Classification, and Recognising Tectual Entailment: First PASCAL Machine Learning Challenges Workshop, MLCW 2005, Southampton, UK, April 11-13, 2005, Revised Selected Papers , pages 177–190. Springer.
De Marneffe et al. [2019] Marie-Catherine De Marneffe, Mandy Simons, and Judith Tonhauser. 2019. The commitmentbank: Investigating projection in naturally occurring discourse. In proceedings of Sinn und Bedeutung , volume 23, pages 107–124.
Dehghani et al. [2023] Mostafa Dehghani, Josip Djolonga, Basil Mustafa, Piotr Padlewski, Jonathan Heek, Justin Gilmer, Andreas Steiner, Mathilde Caron, Robert Geirhos, Ibrahim Alabdulmohsin, et al. 2023. Scaling vision transformers to 22 billion parameters. arXiv preprint arXiv:2302.05442 .
Dehghani et al. [2018] Mostafa Dehghani, Stephan Gouws, Oriol Vinyals, Jakob Uszkoreit, and Łukasz Kaiser. 2018. Universal transformers. arXiv preprint arXiv:1807.03819 .
Du et al. [2022] Nan Du, Yanping Huang, Andrew M Dai, Simon Tong, Dmitry Lepikhin, Yuanzhong Xu, Maxim Krikun, Yanqi Zhou, Adams Wei Yu, Orhan Firat, et al. 2022. Glam: Efficient scaling of language models with mixture-of-experts. In International Conference on Machine Learning , pages 5547–5569. PMLR.
Dušek et al. [2020] Ondřej Dušek, Jekaterina Novikova, and Verena Rieser. 2020. Evaluating the State-of-the-Art of End-to-End Natural Language Generation: The E2E NLG Challenge . Computer Speech & Language , 59:123–156.
Fedus et al. [2021] William Fedus, Barret Zoph, and Noam Shazeer. 2021. Switch transformers: Scaling to trillion parameter models with simple and efficient sparsity. J. Mach. Learn. Res , 23:1–40.
Gao et al. [2020] Leo Gao, Stella Biderman, Sid Black, Laurence Golding, Travis Hoppe, Charles Foster, Jason Phang, Horace He, Anish Thite, Noa Nabeshima, Shawn Presser, and Connor Leahy. 2020. The Pile: An 800GB Dataset of Diverse Text for Language Modeling. arXiv preprint arXiv:2101.00027 .
Gao et al. [2021] Leo Gao, Jonathan Tow, Stella Biderman, Sid Black, Anthony DiPofi, Charles Foster, Laurence Golding, Jeffrey Hsu, Kyle McDonell, Niklas Muennighoff, Jason Phang, Laria Reynolds, Eric Tang, Anish Thite, Ben Wang, Kevin Wang, and Andy Zou. 2021. A framework for few-shot language model evaluation .
Gehman et al. [2020] Samuel Gehman, Suchin Gururangan, Maarten Sap, Yejin Choi, and Noah A Smith. 2020. Realtoxicityprompts: Evaluating neural toxic degeneration in language models. arXiv preprint arXiv:2009.11462 .
Gehrmann et al. [2021] Sebastian Gehrmann, Tosin Adewumi, Karmanya Aggarwal, Pawan Sasanka Ammanamanchi, Aremu Anuoluwapo, Antoine Bosselut, Khyathi Raghavi Chandu, Miruna Clinciu, Dipanjan Das, Kaustubh D Dhole, et al. 2021. The gem benchmark: Natural language generation, its evaluation and metrics. arXiv preprint arXiv:2102.01672 .
Ghorbani et al. [2021] Behrooz Ghorbani, Orhan Firat, Markus Freitag, Ankur Bapna, Maxim Krikun, Xavier Garcia, Ciprian Chelba, and Colin Cherry. 2021. Scaling laws for neural machine translation. arXiv preprint arXiv:2109.07740 .
Gupta et al. [2023] Himanshu Gupta, Saurabh Arjun Sawant, Swaroop Mishra, Mutsumi Nakamura, Arindam Mitra, Santosh Mashetty, and Chitta Baral. 2023. Instruction Tuned Models are Quick Learners. arXiv preprint arXiv:2306.05539 .
Heafield [2011] Kenneth Heafield. 2011. KenLM: Faster and Smaller Language Model Queries . In Proceedings of the Sixth Workshop on Statistical Machine Translation , pages 187–197, Edinburgh, Scotland. Association for Computational Linguistics.
Henderson et al. [2022] Peter Henderson, Mark Krass, Lucia Zheng, Neel Guha, Christopher D Manning, Dan Jurafsky, and Daniel Ho. 2022. Pile of law: Learning responsible data filtering from the law and a 256gb open-source legal dataset. Advances in Neural Information Processing Systems , 35:29217–29234.
Henighan et al. [2020] Tom Henighan, Jared Kaplan, Mor Katz, Mark Chen, Christopher Hesse, Jacob Jackson, Heewoo Jun, Tom B Brown, Prafulla Dhariwal, Scott Gray, et al. 2020. Scaling laws for autoregressive generative modeling. arXiv preprint arXiv:2010.14701 .
Hernandez et al. [2022] Danny Hernandez, Tom Brown, Tom Conerly, Nova DasSarma, Dawn Drain, Sheer El-Showk, Nelson Elhage, Zac Hatfield-Dodds, Tom Henighan, Tristan Hume, et al. 2022. Scaling Laws and Interpretability of Learning from Repeated Data. arXiv preprint arXiv:2205.10487 .
Hernandez et al. [2021] Danny Hernandez, Jared Kaplan, Tom Henighan, and Sam McCandlish. 2021. Scaling laws for transfer. arXiv preprint arXiv:2102.01293 .
Hoffmann et al. [2022] Jordan Hoffmann, Sebastian Borgeaud, Arthur Mensch, Elena Buchatskaya, Trevor Cai, Eliza Rutherford, Diego de Las Casas, Lisa Anne Hendricks, Johannes Welbl, Aidan Clark, et al. 2022. Training Compute-Optimal Large Language Models. arXiv preprint arXiv:2203.15556 .
Huang et al. [2018] Cheng-Zhi Anna Huang, Ashish Vaswani, Jakob Uszkoreit, Noam Shazeer, Ian Simon, Curtis Hawthorne, Andrew M Dai, Matthew D Hoffman, Monica Dinculescu, and Douglas Eck. 2018. Music transformer. arXiv preprint arXiv:1809.04281 .
Iyer et al. [2016] Srinivasan Iyer, Ioannis Konstas, Alvin Cheung, and Luke Zettlemoyer. 2016. Summarizing source code using a neural attention model. In Proceedings of the 54th Annual Meeting of the Association for Computational Linguistics (Volume 1: Long Papers) , pages 2073–2083.
Kandpal et al. [2022] Nikhil Kandpal, Eric Wallace, and Colin Raffel. 2022. Deduplicating Training Data Mitigates Privacy Risks in Language Models .
Kaplan et al. [2020] Jared Kaplan, Sam McCandlish, Tom Henighan, Tom B Brown, Benjamin Chess, Rewon Child, Scott Gray, Alec Radford, Jeffrey Wu, and Dario Amodei. 2020. Scaling laws for neural language models. arXiv preprint arXiv:2001.08361 .
Khrushchev et al. [2022] Mikhail Khrushchev, Ruslan Vasilev, Alexey Petrov, and Nikolay Zinov. 2022. YaLM 100B .
Kingma and Ba [2014] Diederik P Kingma and Jimmy Ba. 2014. Adam: A method for stochastic optimization. arXiv preprint arXiv:1412.6980 .
Kocetkov et al. [2022] Denis Kocetkov, Raymond Li, Loubna Ben Allal, Jia Li, Chenghao Mou, Carlos Muñoz Ferrandis, Yacine Jernite, Margaret Mitchell, Sean Hughes, Thomas Wolf, et al. 2022. The Stack: 3 TB of permissively licensed source code. arXiv preprint arXiv:2211.15533 .
Kojima et al. [2022] Takeshi Kojima, Shixiang Shane Gu, Machel Reid, Yutaka Matsuo, and Yusuke Iwasawa. 2022. Large language models are zero-shot reasoners. arXiv preprint arXiv:2205.11916 .
Komatsuzaki [2019] Aran Komatsuzaki. 2019. One epoch is all you need. arXiv preprint arXiv:1906.06669 .
Kudo and Richardson [2018] Taku Kudo and John Richardson. 2018. SentencePiece: A simple and language independent subword tokenizer and detokenizer for Neural Text Processing . In Proceedings of the 2018 Conference on Empirical Methods in Natural Language Processing: System Demonstrations , pages 66–71, Brussels, Belgium. Association for Computational Linguistics.
Ladhak et al. [2020] Faisal Ladhak, Esin Durmus, Claire Cardie, and Kathleen McKeown. 2020. WikiLingua: A new benchmark dataset for cross-lingual abstractive summarization. arXiv preprint arXiv:2010.03093 .
Laurençon et al. [2022] Hugo Laurençon, Lucile Saulnier, Thomas Wang, Christopher Akiki, Albert Villanova del Moral, Teven Le Scao, Leandro Von Werra, Chenghao Mou, Eduardo González Ponferrada, Huu Nguyen, et al. 2022. The BigScience ROOTS Corpus: A 1.6 TB Composite Multilingual Dataset. In Thirty-sixth Conference on Neural Information Processing Systems Datasets and Benchmarks Track .
Lee et al. [2021] Katherine Lee, Daphne Ippolito, Andrew Nystrom, Chiyuan Zhang, Douglas Eck, Chris Callison-Burch, and Nicholas Carlini. 2021. Deduplicating Training Data Makes Language Models Better. arXiv preprint arXiv:2107.06499 .
Li et al. [2023] Raymond Li, Loubna Ben Allal, Yangtian Zi, Niklas Muennighoff, Denis Kocetkov, Chenghao Mou, Marc Marone, Christopher Akiki, Jia Li, Jenny Chim, Qian Liu, Evgenii Zheltonozhskii, Terry Yue Zhuo, Thomas Wang, Olivier Dehaene, Mishig Davaadorj, Joel Lamy-Poirier, João Monteiro, Oleh Shliazhko, Nicolas Gontier, Nicholas Meade, Armel Zebaze, Ming-Ho Yee, Logesh Kumar Umapathi, Jian Zhu, Benjamin Lipkin, Muhtasham Oblokulov, Zhiruo Wang, Rudra Murthy, Jason Stillerman, Siva Sankalp Patel, Dmitry Abulkhanov, Marco Zocca, Manan Dey, Zhihan Zhang, Nour Fahmy, Urvashi Bhattacharyya, Wenhao Yu, Swayam Singh, Sasha Luccioni, Paulo Villegas, Maxim Kunakov, Fedor Zhdanov, Manuel Romero, Tony Lee, Nadav Timor, Jennifer Ding, Claire Schlesinger, Hailey Schoelkopf, Jan Ebert, Tri Dao, Mayank Mishra, Alex Gu, Jennifer Robinson, Carolyn Jane Anderson, Brendan Dolan-Gavitt, Danish Contractor, Siva Reddy, Daniel Fried, Dzmitry Bahdanau, Yacine Jernite, Carlos Muñoz Ferrandis, Sean Hughes, Thomas Wolf, Arjun Guha, Leandro von Werra, and Harm de Vries. 2023. StarCoder: may the source be with you! arXiv preprint arXiv:2305.06161 .
Liang et al. [2022] Percy Liang, Rishi Bommasani, Tony Lee, Dimitris Tsipras, Dilara Soylu, Michihiro Yasunaga, Yian Zhang, Deepak Narayanan, Yuhuai Wu, Ananya Kumar, et al. 2022. Holistic evaluation of language models. arXiv preprint arXiv:2211.09110 .
Lieber et al. [2021] Opher Lieber, Or Sharir, Barak Lenz, and Yoav Shoham. 2021. Jurassic-1: Technical details and evaluation. White Paper. AI21 Labs , 1.
Lin [2004] Chin-Yew Lin. 2004. Rouge: A package for automatic evaluation of summaries. In Text summarization branches out , pages 74–81.
Lin et al. [2021] Xi Victoria Lin, Todor Mihaylov, Mikel Artetxe, Tianlu Wang, Shuohui Chen, Daniel Simig, Myle Ott, Naman Goyal, Shruti Bhosale, Jingfei Du, et al. 2021. Few-shot learning with multilingual language models. arXiv preprint arXiv:2112.10668 .
Lin et al. [2019] Yu-Hsiang Lin, Chian-Yu Chen, Jean Lee, Zirui Li, Yuyan Zhang, Mengzhou Xia, Shruti Rijhwani, Junxian He, Zhisong Zhang, Xuezhe Ma, et al. 2019. Choosing transfer languages for cross-lingual learning. arXiv preprint arXiv:1905.12688 .
Longpre et al. [2023a] Shayne Longpre, Le Hou, Tu Vu, Albert Webson, Hyung Won Chung, Yi Tay, Denny Zhou, Quoc V Le, Barret Zoph, Jason Wei, et al. 2023a. The Flan Collection: Designing Data and Methods for Effective Instruction Tuning. arXiv preprint arXiv:2301.13688 .
Longpre et al. [2023b] Shayne Longpre, Robert Mahari, Anthony Chen, Naana Obeng-Marnu, Damien Sileo, William Brannon, Niklas Muennighoff, Nathan Khazam, Jad Kabbara, Kartik Perisetla, Xinyi Wu, Enrico Shippole, Kurt Bollacker, Tongshuang Wu, Luis Villa, Sandy Pentland, Deb Roy, and Sara Hooker. 2023b. The Data Provenance Initiative: A Large Scale Audit of Dataset Licensing & Attribution in AI .
Longpre et al. [2023c] Shayne Longpre, Gregory Yauney, Emily Reif, Katherine Lee, Adam Roberts, Barret Zoph, Denny Zhou, Jason Wei, Kevin Robinson, David Mimno, and Daphne Ippolito. 2023c. A Pretrainer’s Guide to Training Data: Measuring the Effects of Data Age, Domain Coverage, Quality, & Toxicity .
Luukkonen et al. [2023] Risto Luukkonen, Ville Komulainen, Jouni Luoma, Anni Eskelinen, Jenna Kanerva, Hanna-Mari Kupari, Filip Ginter, Veronika Laippala, Niklas Muennighoff, Aleksandra Piktus, Thomas Wang, Nouamane Tazi, Teven Le Scao, Thomas Wolf, Osma Suominen, Samuli Sairanen, Mikko Merioksa, Jyrki Heinonen, Aija Vahtola, Samuel Antao, and Sampo Pyysalo. 2023. FinGPT: Large Generative Models for a Small Language. In The 2023 Conference on Empirical Methods in Natural Language Processing .
Madani et al. [2020] Ali Madani, Bryan McCann, Nikhil Naik, Nitish Shirish Keskar, Namrata Anand, Raphael R Eguchi, Po-Ssu Huang, and Richard Socher. 2020. Progen: Language modeling for protein generation. arXiv preprint arXiv:2004.03497 .
McCann et al. [2018] Bryan McCann, Nitish Shirish Keskar, Caiming Xiong, and Richard Socher. 2018. The Natural Language Decathlon: Multitask Learning as Question Answering . CoRR , abs/1806.08730.
Min et al. [2021] Sewon Min, Mike Lewis, Luke Zettlemoyer, and Hannaneh Hajishirzi. 2021. Metaicl: Learning to learn in context. arXiv preprint arXiv:2110.15943 .
Mostafazadeh et al. [2017] Nasrin Mostafazadeh, Michael Roth, Annie Louis, Nathanael Chambers, and James Allen. 2017. Lsdsem 2017 shared task: The story cloze test. In Proceedings of the 2nd Workshop on Linking Models of Lexical, Sentential and Discourse-level Semantics , pages 46–51.
Muennighoff [2020] Niklas Muennighoff. 2020. Vilio: State-of-the-art visio-linguistic models applied to hateful memes. arXiv preprint arXiv:2012.07788 .
Muennighoff [2022] Niklas Muennighoff. 2022. SGPT: GPT Sentence Embeddings for Semantic Search. arXiv preprint arXiv:2202.08904 .
Muennighoff et al. [2023] Niklas Muennighoff, Qian Liu, Armel Zebaze, Qinkai Zheng, Binyuan Hui, Terry Yue Zhuo, Swayam Singh, Xiangru Tang, Leandro von Werra, and Shayne Longpre. 2023. OctoPack: Instruction Tuning Code Large Language Models. arXiv preprint arXiv:2308.07124 .
Muennighoff et al. [2022a] Niklas Muennighoff, Nouamane Tazi, Loïc Magne, and Nils Reimers. 2022a. MTEB: Massive Text Embedding Benchmark . arXiv preprint arXiv:2210.07316 .
Muennighoff et al. [2022b] Niklas Muennighoff, Thomas Wang, Lintang Sutawika, Adam Roberts, Stella Biderman, Teven Le Scao, M Saiful Bari, Sheng Shen, Zheng-Xin Yong, Hailey Schoelkopf, et al. 2022b. Crosslingual generalization through multitask finetuning. arXiv preprint arXiv:2211.01786 .
Nakkiran et al. [2021a] Preetum Nakkiran, Gal Kaplun, Yamini Bansal, Tristan Yang, Boaz Barak, and Ilya Sutskever. 2021a. Deep double descent: Where bigger models and more data hurt. Journal of Statistical Mechanics: Theory and Experiment , 2021(12):124003.
Nakkiran et al. [2021b] Preetum Nakkiran, Behnam Neyshabur, and Hanie Sedghi. 2021b. The Deep Bootstrap Framework: Good Online Learners are Good Offline Generalizers . In 9th International Conference on Learning Representations, ICLR 2021, Virtual Event, Austria, May 3-7, 2021 . OpenReview.net.
Narayan et al. [2018] Shashi Narayan, Shay B. Cohen, and Mirella Lapata. 2018. Don’t Give Me the Details, Just the Summary! Topic-Aware Convolutional Neural Networks for Extreme Summarization. In Proceedings of the 2018 Conference on Empirical Methods in Natural Language Processing , Brussels, Belgium.
Narayanan et al. [2021] Deepak Narayanan, Mohammad Shoeybi, Jared Casper, Patrick LeGresley, Mostofa Patwary, Vijay Korthikanti, Dmitri Vainbrand, Prethvi Kashinkunti, Julie Bernauer, Bryan Catanzaro, et al. 2021. Efficient large-scale language model training on gpu clusters using megatron-lm. In Proceedings of the International Conference for High Performance Computing, Networking, Storage and Analysis , pages 1–15.
Nie et al. [2020] Yixin Nie, Adina Williams, Emily Dinan, Mohit Bansal, Jason Weston, and Douwe Kiela. 2020. Adversarial NLI: A New Benchmark for Natural Language Understanding. In Proceedings of the 58th Annual Meeting of the Association for Computational Linguistics . Association for Computational Linguistics.
Nijkamp et al. [2022] Erik Nijkamp, Bo Pang, Hiroaki Hayashi, Lifu Tu, Huan Wang, Yingbo Zhou, Silvio Savarese, and Caiming Xiong. 2022. Codegen: An open large language model for code with multi-turn program synthesis. arXiv preprint arXiv:2203.13474 .
nostalgebraist [2022] nostalgebraist. 2022. chinchilla’s wild implications. lesswrong .
Orlanski et al. [2023] Gabriel Orlanski, Kefan Xiao, Xavier Garcia, Jeffrey Hui, Joshua Howland, Jonathan Malmaud, Jacob Austin, Rishah Singh, and Michele Catasta. 2023. Measuring The Impact Of Programming Language Distribution. arXiv preprint arXiv:2302.01973 .
Ortiz Su’arez et al. [2020] Pedro Javier Ortiz Su’arez, Laurent Romary, and Benoit Sagot. 2020. A Monolingual Approach to Contextualized Word Embeddings for Mid-Resource Languages . In Proceedings of the 58th Annual Meeting of the Association for Computational Linguistics , pages 1703–1714, Online. Association for Computational Linguistics.
Ortiz Su’arez et al. [2019] Pedro Javier Ortiz Su’arez, Benoit Sagot, and Laurent Romary. 2019. Asynchronous pipelines for processing huge corpora on medium to low resource infrastructures . Proceedings of the Workshop on Challenges in the Management of Large Corpora (CMLC-7) 2019. Cardiff, 22nd July 2019, pages 9 – 16, Mannheim. Leibniz-Institut f"ur Deutsche Sprache.
Ouyang et al. [2022] Long Ouyang, Jeff Wu, Xu Jiang, Diogo Almeida, Carroll L Wainwright, Pamela Mishkin, Chong Zhang, Sandhini Agarwal, Katarina Slama, Alex Ray, et al. 2022. Training language models to follow instructions with human feedback. arXiv preprint arXiv:2203.02155 .
Penedo et al. [2023] Guilherme Penedo, Quentin Malartic, Daniel Hesslow, Ruxandra Cojocaru, Alessandro Cappelli, Hamza Alobeidli, Baptiste Pannier, Ebtesam Almazrouei, and Julien Launay. 2023. The RefinedWeb Dataset for Falcon LLM: Outperforming Curated Corpora with Web Data, and Web Data Only. arXiv preprint arXiv:2306.01116 .
Prabhumoye et al. [2023] Shrimai Prabhumoye, Mostofa Patwary, Mohammad Shoeybi, and Bryan Catanzaro. 2023. Adding Instructions during Pretraining: Effective Way of Controlling Toxicity in Language Models. arXiv preprint arXiv:2302.07388 .
Radford et al. [2019] Alec Radford, Jeffrey Wu, Rewon Child, David Luan, Dario Amodei, Ilya Sutskever, et al. 2019. Language models are unsupervised multitask learners. OpenAI blog , 1(8):9.
Rae et al. [2021] Jack W Rae, Sebastian Borgeaud, Trevor Cai, Katie Millican, Jordan Hoffmann, Francis Song, John Aslanides, Sarah Henderson, Roman Ring, Susannah Young, et al. 2021. Scaling language models: Methods, analysis & insights from training gopher. arXiv preprint arXiv:2112.11446 .
Raffel et al. [2020] Colin Raffel, Noam Shazeer, Adam Roberts, Katherine Lee, Sharan Narang, Michael Matena, Yanqi Zhou, Wei Li, Peter J Liu, et al. 2020. Exploring the limits of transfer learning with a unified text-to-text transformer. J. Mach. Learn. Res. , 21(140):1–67.
Rasley et al. [2020] Jeff Rasley, Samyam Rajbhandari, Olatunji Ruwase, and Yuxiong He. 2020. Deepspeed: System optimizations enable training deep learning models with over 100 billion parameters. In Proceedings of the 26th ACM SIGKDD International Conference on Knowledge Discovery & Data Mining , pages 3505–3506.
Roemmele et al. [2011] Melissa Roemmele, Cosmin Adrian Bejan, and Andrew S Gordon. 2011. Choice of Plausible Alternatives: An Evaluation of Commonsense Causal Reasoning. In AAAI spring symposium: logical formalizations of commonsense reasoning , pages 90–95.
Sakaguchi et al. [2021] Keisuke Sakaguchi, Ronan Le Bras, Chandra Bhagavatula, and Yejin Choi. 2021. Winogrande: An adversarial winograd schema challenge at scale. Communications of the ACM , 64(9):99–106.
Sanh et al. [2022] Victor Sanh, Albert Webson, Colin Raffel, Stephen Bach, Lintang Sutawika, Zaid Alyafeai, Antoine Chaffin, Arnaud Stiegler, Teven Le Scao, Arun Raja, et al. 2022. Multitask Prompted Training Enables Zero-Shot Task Generalization. In The Tenth International Conference on Learning Representations .
Scao et al. [2022a] Teven Le Scao, Angela Fan, Christopher Akiki, Ellie Pavlick, Suzana Ilić, Daniel Hesslow, Roman Castagné, Alexandra Sasha Luccioni, François Yvon, Matthias Gallé, et al. 2022a. Bloom: A 176b-parameter open-access multilingual language model. arXiv preprint arXiv:2211.05100 .
Scao et al. [2022b] Teven Le Scao, Thomas Wang, Daniel Hesslow, Lucile Saulnier, Stas Bekman, M Saiful Bari, Stella Bideman, Hady Elsahar, Niklas Muennighoff, Jason Phang, et al. 2022b. What Language Model to Train if You Have One Million GPU Hours? arXiv preprint arXiv:2210.15424 .
Shin et al. [2022] Seongjin Shin, Sang-Woo Lee, Hwijeen Ahn, Sungdong Kim, HyoungSeok Kim, Boseop Kim, Kyunghyun Cho, Gichang Lee, Woomyoung Park, Jung-Woo Ha, et al. 2022. On the effect of pretraining corpora on in-context learning by a large-scale language model. arXiv preprint arXiv:2204.13509 .
Shoeybi et al. [2019] Mohammad Shoeybi, Mostofa Patwary, Raul Puri, Patrick LeGresley, Jared Casper, and Bryan Catanzaro. 2019. Megatron-lm: Training multi-billion parameter language models using model parallelism. arXiv preprint arXiv:1909.08053 .
Smith et al. [2022] Shaden Smith, Mostofa Patwary, Brandon Norick, Patrick LeGresley, Samyam Rajbhandari, Jared Casper, Zhun Liu, Shrimai Prabhumoye, George Zerveas, Vijay Korthikanti, et al. 2022. Using deepspeed and megatron to train megatron-turing nlg 530b, a large-scale generative language model. arXiv preprint arXiv:2201.11990 .
Soltan et al. [2022] Saleh Soltan, Shankar Ananthakrishnan, Jack FitzGerald, Rahul Gupta, Wael Hamza, Haidar Khan, Charith Peris, Stephen Rawls, Andy Rosenbaum, Anna Rumshisky, et al. 2022. Alexatm 20b: Few-shot learning using a large-scale multilingual seq2seq model. arXiv preprint arXiv:2208.01448 .
Sorscher et al. [2022] Ben Sorscher, Robert Geirhos, Shashank Shekhar, Surya Ganguli, and Ari S Morcos. 2022. Beyond neural scaling laws: beating power law scaling via data pruning. arXiv preprint arXiv:2206.14486 .
Srivastava et al. [2022] Aarohi Srivastava, Abhinav Rastogi, Abhishek Rao, Abu Awal Md Shoeb, Abubakar Abid, Adam Fisch, Adam R Brown, Adam Santoro, Aditya Gupta, Adrià Garriga-Alonso, et al. 2022. Beyond the imitation game: Quantifying and extrapolating the capabilities of language models. arXiv preprint arXiv:2206.04615 .
Su et al. [2022] Hui Su, Xiao Zhou, Houjing Yu, Yuwen Chen, Zilin Zhu, Yang Yu, and Jie Zhou. 2022. WeLM: A Well-Read Pre-trained Language Model for Chinese. arXiv preprint arXiv:2209.10372 .
Tay et al. [2022a] Yi Tay, Mostafa Dehghani, Samira Abnar, Hyung Won Chung, William Fedus, Jinfeng Rao, Sharan Narang, Vinh Q Tran, Dani Yogatama, and Donald Metzler. 2022a. Scaling Laws vs Model Architectures: How does Inductive Bias Influence Scaling? arXiv preprint arXiv:2207.10551 .
Tay et al. [2021] Yi Tay, Mostafa Dehghani, Jinfeng Rao, William Fedus, Samira Abnar, Hyung Won Chung, Sharan Narang, Dani Yogatama, Ashish Vaswani, and Donald Metzler. 2021. Scale efficiently: Insights from pre-training and fine-tuning transformers. arXiv preprint arXiv:2109.10686 .
Tay et al. [2022b] Yi Tay, Mostafa Dehghani, Vinh Q Tran, Xavier Garcia, Dara Bahri, Tal Schuster, Huaixiu Steven Zheng, Neil Houlsby, and Donald Metzler. 2022b. Unifying Language Learning Paradigms. arXiv preprint arXiv:2205.05131 .
Tay et al. [2022c] Yi Tay, Jason Wei, Hyung Won Chung, Vinh Q Tran, David R So, Siamak Shakeri, Xavier Garcia, Huaixiu Steven Zheng, Jinfeng Rao, Aakanksha Chowdhery, et al. 2022c. Transcending scaling laws with 0.1% extra compute. arXiv preprint arXiv:2210.11399 .
Taylor et al. [2022] Ross Taylor, Marcin Kardas, Guillem Cucurull, Thomas Scialom, Anthony Hartshorn, Elvis Saravia, Andrew Poulton, Viktor Kerkez, and Robert Stojnic. 2022. Galactica: A large language model for science. arXiv preprint arXiv:2211.09085 .
Thoppilan et al. [2022] Romal Thoppilan, Daniel De Freitas, Jamie Hall, Noam Shazeer, Apoorv Kulshreshtha, Heng-Tze Cheng, Alicia Jin, Taylor Bos, Leslie Baker, Yu Du, et al. 2022. Lamda: Language models for dialog applications. arXiv preprint arXiv:2201.08239 .
Touvron et al. [2023] Hugo Touvron, Thibaut Lavril, Gautier Izacard, Xavier Martinet, Marie-Anne Lachaux, Timothée Lacroix, Baptiste Rozière, Naman Goyal, Eric Hambro, Faisal Azhar, et al. 2023. Llama: Open and efficient foundation language models. arXiv preprint arXiv:2302.13971 .
Vaswani et al. [2017] Ashish Vaswani, Noam Shazeer, Niki Parmar, Jakob Uszkoreit, Llion Jones, Aidan N Gomez, Łukasz Kaiser, and Illia Polosukhin. 2017. Attention is all you need. Advances in neural information processing systems , 30.
Villalobos et al. [2022] Pablo Villalobos, Jaime Sevilla, Lennart Heim, Tamay Besiroglu, Marius Hobbhahn, and Anson Ho. 2022. Will we run out of data? An analysis of the limits of scaling datasets in Machine Learning. arXiv preprint arXiv:2211.04325 .
Virtanen et al. [2019] Antti Virtanen, Jenna Kanerva, Rami Ilo, Jouni Luoma, Juhani Luotolahti, Tapio Salakoski, Filip Ginter, and Sampo Pyysalo. 2019. Multilingual is not enough: BERT for Finnish. arXiv preprint arXiv:1912.07076 .
Wang et al. [2019] Alex Wang, Yada Pruksachatkun, Nikita Nangia, Amanpreet Singh, Julian Michael, Felix Hill, Omer Levy, and Samuel R. Bowman. 2019. SuperGLUE: A Stickier Benchmark for General-Purpose Language Understanding Systems . CoRR , abs/1905.00537.
Wang et al. [2023] Yizhong Wang, Hamish Ivison, Pradeep Dasigi, Jack Hessel, Tushar Khot, Khyathi Raghavi Chandu, David Wadden, Kelsey MacMillan, Noah A Smith, Iz Beltagy, et al. 2023. How Far Can Camels Go? Exploring the State of Instruction Tuning on Open Resources. arXiv preprint arXiv:2306.04751 .
Wang et al. [2022] Yizhong Wang, Yeganeh Kordi, Swaroop Mishra, Alisa Liu, Noah A Smith, Daniel Khashabi, and Hannaneh Hajishirzi. 2022. Self-Instruct: Aligning Language Model with Self Generated Instructions. arXiv preprint arXiv:2212.10560 .
Wei et al. [2021] Jason Wei, Maarten Bosma, Vincent Y Zhao, Kelvin Guu, Adams Wei Yu, Brian Lester, Nan Du, Andrew M Dai, and Quoc V Le. 2021. Finetuned language models are zero-shot learners. arXiv preprint arXiv:2109.01652 .
Wei et al. [2022] Jason Wei, Xuezhi Wang, Dale Schuurmans, Maarten Bosma, Ed Chi, Quoc Le, and Denny Zhou. 2022. Chain of thought prompting elicits reasoning in large language models. arXiv preprint arXiv:2201.11903 .
Weidinger et al. [2021] Laura Weidinger, John Mellor, Maribeth Rauh, Conor Griffin, Jonathan Uesato, Po-Sen Huang, Myra Cheng, Mia Glaese, Borja Balle, Atoosa Kasirzadeh, et al. 2021. Ethical and social risks of harm from language models. arXiv preprint arXiv:2112.04359 .
Welbl et al. [2017] Johannes Welbl, Nelson F Liu, and Matt Gardner. 2017. Crowdsourcing multiple choice science questions. arXiv preprint arXiv:1707.06209 .
Wenzek et al. [2019] Guillaume Wenzek, Marie-Anne Lachaux, Alexis Conneau, Vishrav Chaudhary, Francisco Guzmán, Armand Joulin, and Edouard Grave. 2019. CCNet: Extracting high quality monolingual datasets from web crawl data. arXiv preprint arXiv:1911.00359 .
Weston et al. [2015] Jason Weston, Antoine Bordes, Sumit Chopra, Alexander M Rush, Bart Van Merriënboer, Armand Joulin, and Tomas Mikolov. 2015. Towards ai-complete question answering: A set of prerequisite toy tasks. arXiv preprint arXiv:1502.05698 .
Xia et al. [2022] Mengzhou Xia, Mikel Artetxe, Chunting Zhou, Xi Victoria Lin, Ramakanth Pasunuru, Danqi Chen, Luke Zettlemoyer, and Ves Stoyanov. 2022. Training Trajectories of Language Models Across Scales. arXiv preprint arXiv:2212.09803 .
Xia et al. [2021] Mengzhou Xia, Guoqing Zheng, Subhabrata Mukherjee, Milad Shokouhi, Graham Neubig, and Ahmed Hassan Awadallah. 2021. MetaXL: Meta representation transformation for low-resource cross-lingual learning. arXiv preprint arXiv:2104.07908 .
Xu et al. [2023] Can Xu, Qingfeng Sun, Kai Zheng, Xiubo Geng, Pu Zhao, Jiazhan Feng, Chongyang Tao, and Daxin Jiang. 2023. Wizardlm: Empowering large language models to follow complex instructions. arXiv preprint arXiv:2304.12244 .
Xue et al. [2020] Linting Xue, Noah Constant, Adam Roberts, Mihir Kale, Rami Al-Rfou, Aditya Siddhant, Aditya Barua, and Colin Raffel. 2020. mT5: A massively multilingual pre-trained text-to-text transformer. arXiv preprint arXiv:2010.11934 .
Yang et al. [2021] Ge Yang, Edward Hu, Igor Babuschkin, Szymon Sidor, Xiaodong Liu, David Farhi, Nick Ryder, Jakub Pachocki, Weizhu Chen, and Jianfeng Gao. 2021. Tuning large neural networks via zero-shot hyperparameter transfer. Advances in Neural Information Processing Systems , 34:17084–17097.
Yong et al. [2022] Zheng-Xin Yong, Hailey Schoelkopf, Niklas Muennighoff, Alham Fikri Aji, David Ifeoluwa Adelani, Khalid Almubarak, M Saiful Bari, Lintang Sutawika, Jungo Kasai, Ahmed Baruwa, et al. 2022. BLOOM+ 1: Adding Language Support to BLOOM for Zero-Shot Prompting. arXiv preprint arXiv:2212.09535 .
Zellers et al. [2019] Rowan Zellers, Ari Holtzman, Yonatan Bisk, Ali Farhadi, and Yejin Choi. 2019. HellaSwag: Can a Machine Really Finish Your Sentence? In Proceedings of the 57th Annual Meeting of the Association for Computational Linguistics .
Zeng et al. [2022] Aohan Zeng, Xiao Liu, Zhengxiao Du, Zihan Wang, Hanyu Lai, Ming Ding, Zhuoyi Yang, Yifan Xu, Wendi Zheng, Xiao Xia, et al. 2022. GLM-130B: An Open Bilingual Pre-trained Model. arXiv preprint arXiv:2210.02414 .
Zeng et al. [2021] Wei Zeng, Xiaozhe Ren, Teng Su, Hui Wang, Yi Liao, Zhiwei Wang, Xin Jiang, ZhenZhang Yang, Kaisheng Wang, Xiaoda Zhang, et al. 2021. PanGu-alpha: Large-scale Autoregressive Pretrained Chinese Language Models with Auto-parallel Computation. arXiv preprint arXiv:2104.12369 .
Zhang et al. [2022] Susan Zhang, Stephen Roller, Naman Goyal, Mikel Artetxe, Moya Chen, Shuohui Chen, Christopher Dewan, Mona Diab, Xian Li, Xi Victoria Lin, et al. 2022. Opt: Open pre-trained transformer language models. arXiv preprint arXiv:2205.01068 .
Zhao et al. [2023] Wayne Xin Zhao, Kun Zhou, Junyi Li, Tianyi Tang, Xiaolei Wang, Yupeng Hou, Yingqian Min, Beichen Zhang, Junjie Zhang, Zican Dong, et al. 2023. A survey of large language models. arXiv preprint arXiv:2303.18223 .
Zhou et al. [2023] Chunting Zhou, Pengfei Liu, Puxin Xu, Srini Iyer, Jiao Sun, Yuning Mao, Xuezhe Ma, Avia Efrat, Ping Yu, Lili Yu, et al. 2023. Lima: Less is more for alignment. arXiv preprint arXiv:2305.11206 .
Zoph et al. [2022] Barret Zoph, Irwan Bello, Sameer Kumar, Nan Du, Yanping Huang, Jeff Dean, Noam Shazeer, and William Fedus. 2022. Designing effective sparse expert models. arXiv preprint arXiv:2202.08906 .
Appendix
附录
Appendix A Derivation of Data-Constrained Scaling Laws
附录 A 数据受限缩放律的推导
Let be the number of model parameters, be the training tokens and be the "unique" training tokens i.e. the size of the dataset that is to be trained on for one or more epochs. Chinchilla [42] only deals with non-repeated tokens, thus and we can write their formula (“Approach 3”) as:
令 为模型参数量, 为训练 token, 为「唯一」训练 token,即要以一个或多个 epoch 训练的数据集大小。Chinchilla [42] 只处理不重复 token,因而 ,可把其公式(「方法 3」)写成:
where represents the irreducible loss. , , and are learned parameters.
其中 表示不可约损失。、、 与 为学习参数。
We now want to generalize this expression to multiple epochs where tokens are repeated. We repeat the data times, where corresponds to the base case of a single epoch. We let be the “effective data size”: the number of unique data needed to get the same value as repeating unique tokens for repeats. Hence, if , the effective data is the same as the total data processed. Intuitively, each time a sample is repeated, it is worth less as the model has already learned some of its information. Assume that each time a model trains on a token, it learns a fraction of the information in it for some constant . (Thus, if repeated tokens are as good as new ones, and if , repeated tokens are worth nothing.) In other words, we expect the decrease in value of each repetition to be proportional to the value of the prior repetition, which is equivalent to exponential decay. As we would like to sum up the value of all repetitions, we temporarily assume an integral number of repeats and express it as a geometric series:
我们现在要把该表达式推广到 token 被重复的多 epoch。数据重复 次, 对应单 epoch 基线。令 为「有效数据大小」:为获得与把 个唯一 token 重复 次相同的价值,所需的唯一数据量。因此若 ,有效数据等于总处理数据。直观上,样本每被重复一次,因其部分信息已被模型学到,价值更低。假定模型每在一个 token 上训练一次,就学到其中 比例的信息,其中常数 。(因而若 ,重复 token 与新 token 一样好;若 ,重复 token 毫无价值。)换言之,我们预期每次重复价值的下降与前一次重复的价值成正比,等价于指数衰减。由于要对全部重复的价值求和,我们暂时假定整数次重复,并写成几何级数:
We know that the sum of a geometric series with a common ratio is:
我们知道公比为 的几何级数之和 为:
where is the first term and the number of terms in the series. As and :
其中 为首项, 为项数。由于 且 :
Note that Equation 10 can also be used with a non-integer number of repetitions. We can directly use Equation 10 as our effective data and learn but for convenience and interpretability, we redefine it in terms of the number of epochs beyond which repeating does not help. Note that as more data is repeated, the right-hand side tends to , as . Let , hence “plateaus” at as goes to infinity.
注意式 10 也可用于非整数次重复。我们可以直接把式 10 当作有效数据并学习 ,但为方便与可解释性,我们用「超过该 epoch 数后重复不再有帮助」来重定义。注意随更多数据被重复,右边趋于 ,因为 。令 ,因而当 趋于无穷时, 「平台」在 。
If we assume to be small, tends to one and we can approximate .
若假定 很小, 趋于一,可近似 。
Next, define in terms of its Taylor series expansion:
接下来用泰勒展开定义 :
If is small later terms become increasingly small, thus . As we have assumed to be small, let , which yields
若 很小,后面各项越来越小,因而 。因已假定 很小,令 ,得到
Now inserting and into Equation 10 we get our final equation representing the effective data:
现把 与 代入式 10,得到表示有效数据的最终方程:
where and are given while is a learned constant. If no repeats are done, the second part of the sum is zero and the term simplifies to the single-epoch scaling laws from Equation 7. While , the second term is approximated as and for , it plateaus at . Hence corresponds to the number of times we can repeat tokens before seeing sharply diminishing returns.
其中 与 给定,而 为学习常数。若不做重复,和式第二项为零,该项退化为式 7 的单 epoch 缩放律。当 时,第二项近似为 ;当 时,平台在 。因此 对应在看到急剧递减收益之前可重复 token 的次数。
Let us consider a concrete example to show that Equation 13 is a very good approximation of Equation 10 and make the equations more intuitive. Suppose repeated data retains 75% of its value () and we train on a single token or data unit () for five epochs, i.e. we repeat it four times (). In that case Equation 10 yields . Thus despite training for 5 total units (4 of which are repetitions), we only get the value equivalent to units. As we have defined , the corresponding value is . Setting in Equation 13 yields . Due to our approximations, the results are not the same, i.e. is slightly higher than . However, note that the data term is additionally raised to a power of (see Equation 7; Appendix B), thus the actual difference calculated as is a mere 1.8% despite this relatively large of . Equation 13 has the benefit that we can interpret as the number of repetitions beyond which repeating yields sharply diminishing returns and flattens out soon after. Consider then . No matter how many repeats are done the effective data will never exceed i.e. it plateaus at as tends to infinity.
我们看一个具体例子,说明式 13 是式 10 的很好近似,并让方程更直观。假定重复数据保留 75% 价值(),我们在单个 token 或数据单元()上训五个 epoch,即重复四次()。此时式 10 给出 。因而尽管总共训了 5 个单位(其中 4 个是重复),我们只得到等价于 个单位的价值。由于定义 ,对应 值为 。在式 13 中设 得 。由于近似,结果不完全相同,即 略高于 。但注意数据项还要再取 次幂(见式 7;附录 B),因而按 计算的实际差异,即便在此相对较大的 下也仅 1.8%。式 13 的好处是:可以把 解释为超过该重复次数后重复收益急剧递减并很快趋平的次数。考虑 ,则 。无论重复多少次,有效数据都不会超过 ,即当 趋于无穷时平台在 。
Similarly, we consider repeating parameters. Symmetric to seeing the same data, excess parameters learn the same features and do not add any value in the extreme. For the Chinchilla equation (Equation 7) increasing parameters from 1 billion to 10 billion yields the same absolute decrease in loss regardless of whether the dataset is a single token or 1 billion tokens. However, intuition and our data (Appendix F) suggest that in the first case, adding parameters should not decrease loss at all, as the additional 9 billion parameters cannot possibly learn anything from the single token that the first 1 billion parameters have not already learned. Thus, to allow excess parameters to decay to adding nothing, we also replace with a symmetric version of Equation 13 yielding our final equation:
类似地,我们考虑重复参数。与看相同数据对称,多余参数学到相同特征,极端情形下不增加任何价值。对 Chinchilla 方程(式 7),把参数从 10 亿增到 100 亿,无论数据集是单个 token 还是 10 亿 token,损失的绝对下降相同。但直觉与我们的数据(附录 F)提示:第一种情形下增加参数不应降低损失,因为额外 90 亿参数不可能从那单个 token 学到前 10 亿参数尚未学到的东西。因此,为使多余参数衰减到「什么也不加」,我们用式 13 的对称版本替换 ,得到最终方程:
We define , as the number of "unique" parameters that provide an optimal fit for . Additional parameters decay with a symmetric version of the expression for repeated data. is the number that the "unique" parameters are repeated i.e. . If , additional parameters do not decay at all and reduces to . We compute from by setting and rearranging Equation 3 to map from to . is then . This is equivalent to the following:
我们把 定义为给 提供最优拟合的「唯一」参数量。额外参数按与重复数据对称的表达式衰减。 是「唯一」参数被重复的次数,即 。若 ,额外参数完全不衰减, 退化为 。我们通过令 并重排式 3 从 映射到 ,由 计算 。 随后取 。这等价于:
Equation 14is a generalization of Equation 7: It provides the same estimates for optimal model and data size in the single epoch case, but allows for decay in the value of parameters and tokens, thus generalizing to training for multiple epochs and with excess parameters. It can thus be used as a direct replacement of Equation 7. If and are unknown, one can simply set them to infinity by default, which will make Equation 14 completely equivalent to Equation 7.
式 14 是式 7 的推广:它在单 epoch 情形给出相同的最优模型与数据规模估计,但允许参数与 token 价值衰减,从而推广到多 epoch 训练与多余参数。因此可直接替换式 7。若 与 未知,可默认设为无穷,使式 14 与式 7 完全等价。
To learn the parameters and , we largely follow the approach from [42]. We fix , , , , to the values learned on C4 in Appendix B and minimize:
为学习参数 与 ,我们大体遵循 [42] 的做法。把 、、、、 固定为附录 B 在 C4 上学习的值,并最小化:
We use the LBFGS algorithm to find local minima of the objective above, started on a grid of initialization given by: and . We fit on 182 samples with parameters varying from 7 million up to 9 billion and epochs ranging from 1 to 500. We removed outliers referenced in Appendix F from our fitting, as our formulas do not allow for excess parameters or excess epochs to negatively impact performance. We assume excess parameters or epochs only cause performance to plateau but never to worsen. However, it is difficult to identify all samples where excess parameters or epochs hurt, as for some data budgets we only train a single model, thus we do not know if the loss of that model is already in the range where it starts to increase again. Further, there are samples where loss initially increases and then decreases as a function of epochs (double descent, see Appendix D), which further contributes to noise in the fitting. Nevertheless, we are able to get a fairly stable fit resulting in and . Since , excess parameters decay faster. Hence, the data-constrained efficient frontiers in Figures 1,3 suggest scaling compute allocated to epochs faster than to parameters. This value of yields ( for ), which respects the assumption that is small. Inserting these learned parameters and the parameters from Appendix B, and simplifying Equation 15 yields the precise formulation we use to predict loss () given unique tokens (), parameter repetitions () and data repetitions ():
我们用 LBFGS 算法寻找上述目标的局部极小,并在初始化网格上启动:,。在 182 个样本上拟合,参数从 700 万到 90 亿,epoch 从 1 到 500。我们从拟合中去掉附录 F 提到的离群点,因为我们的公式不允许多余参数或多余 epoch 负面损害性能。我们假定多余参数或 epoch 只会使性能平台,从不恶化。但很难识别全部「多余参数或 epoch 已伤害」的样本:对某些数据预算我们只训单个模型,因而无法知道该模型损失是否已进入再次上升的区间。此外,有些样本损失随 epoch 先升后降(双重下降,见附录 D),进一步给拟合带来噪声。尽管如此,我们仍得到相当稳定的拟合:,。由于 ,多余参数衰减更快。因此图 1、3 中的数据受限高效前沿建议把算力更快分配给 epoch 而非参数。该 值对应 (对 为 ),符合 很小的假定。代入这些学习参数与附录 B 参数并化简式 15,得到我们用来在给定唯一 token()、参数重复()与数据重复()时预测损失()的精确形式:
| Parametric Fit | Loss | |||
|---|---|---|---|---|
| No decay | - | - | - | 0.1430 |
| Equation 14 but only decay | - | 713.0015 | 0.0241 | 0.1671 |
| Equation 14 but only decay | 2.9157 | - | 0.0169 | 0.7395 |
| Equation 14 | 15.3878 | 5.3097 | 0.0158 | 0.7810 |
| Equation 10 for both and | 0.0104 | 0.3676 | 0.0155 | 0.8062 |
| Equation 18 for both and | 0.0105 | 0.3676 | 0.0155 | 0.8061 |
Table 1: Comparison of different versions of our parametric fit. All versions are fitted on the same 182 samples. We report the fitting loss and the on those samples. No decay corresponds to assuming Chinchilla holds for repeated data without modification necessary. For Equation 10, we use the same equation for and renaming the to and .
| 参数化拟合 | 损失 | |||
|---|---|---|---|---|
| 无衰减 | - | - | - | 0.1430 |
| 式 14 但只衰减 | - | 713.0015 | 0.0241 | 0.1671 |
| 式 14 但只衰减 | 2.9157 | - | 0.0169 | 0.7395 |
| 式 14 | 15.3878 | 5.3097 | 0.0158 | 0.7810 |
| 式 10 对 与 | 0.0104 | 0.3676 | 0.0155 | 0.8062 |
| 式 18 对 与 | 0.0105 | 0.3676 | 0.0155 | 0.8061 |
表 1:不同版本参数化拟合的比较。所有版本在同一 182 个样本上拟合。报告拟合损失与这些样本上的 。无衰减对应假定 Chinchilla 对重复数据无需修改仍成立。对式 10,我们对 与 使用同一方程,把 重命名为 与 。
We experiment with different versions of our formula and display the learned values in Table 1. No decay or decaying only or of Equation 14 leads to worse loss and than Equation 14. Thus, it is important to decay both the value of excess parameters and data repetitions. We also consider an explicit exponential where , hence from Equation 9 it follows:
我们尝试公式的不同版本,学习值见表 1。无衰减,或式 14 只衰减 或只衰减 ,损失与 都差于完整式 14。因此,同时衰减多余参数与数据重复的价值很重要。我们还考虑显式指数形式 ,因而由式 9 有:
This explicit decay, Equation 10, and Equation 14 all yield similar results with around 80. Equation 14 fits the data slightly worse than Equation 10, likely due to our approximations. Nevertheless, we use Equation 14 throughout as it has fewer terms, and we find it easier to interpret.
该显式衰减、式 10 与式 14 都给出相近结果, 约 80。式 14 对数据的拟合略差于式 10,可能因近似所致。尽管如此,我们全文使用式 14,因其项更少,也更易解释。
A.1 Analytical properties of compute-optimal point
Figure 7: A cartoon of how the compute-optimal tradeoff deviates from Chinchilla as we increase the number of epochs. Initially the model size and tokens processed grow proportionally () but since , at some point adding parameters offers worse returns compared to increasing the number of tokens processed, and hence we deviate from the Chinchilla curve.
A.1 算力最优点的解析性质
图 7:随 epoch 增加,算力最优权衡如何偏离 Chinchilla 的示意。起初模型规模与处理 token 等比例增长();但由于 ,到某点增加参数的回报劣于增加处理 token 数,因而偏离 Chinchilla 曲线。
In our case, consider the setting of a fixed compute budget and a fixed budget of unique tokens implying a set of unique parameters . Let denote the number of times we repeat data (we assume that we are in the multi-epoch regime and hence ).
在我们的情形,考虑固定算力预算 与固定唯一 token 预算 (隐含一组唯一参数 )。令 表示重复数据的次数(假定已处于多 epoch 情形,故 )。
Write (for Chinchilla ). When and , our scaling agrees with Chinchilla, and so the point , corresponding to is on the optimal compute curve. Increasing by corresponds to increasing the number of tokens by , while increasing by corresponds to increasing the number of parameters by . For small positive , our curve agrees with Chinchilla and so we need to increase by the same amount to maintain the proportionality. Hence up to some value , the optimal compute curve corresponds to . Our curve differs from Chinchilla when gets closer to either or . At this point, we start to see sharply diminishing returns.
写 (对 Chinchilla,)。当 且 时,我们的缩放与 Chinchilla 一致,因而对应 的点 落在最优算力曲线上。把 增加 对应把 token 数增加 ,而把 增加 对应把参数量增加 。对小的正 ,我们的曲线与 Chinchilla 一致,因而需把 增加相同量以保持比例。因此直到某个 ,最优算力曲线对应 。当 接近 或 时,我们的曲线与 Chinchilla 分道扬镳,开始看到急剧递减收益。
In our setting, which means that we reach the point first. At this point, each added parameter is worth less (specifically worth ), than an added data point, despite them having equal computational cost. Hence processing more tokens will be more effective than increasing the number of parameters, and we expect the optimal compute curve to break away from proportionality. This is indeed what we see.
在我们的设定中 ,意味着先到达 。此时每个新增参数的价值(具体为 )低于新增数据点,尽管二者算力成本相同。因此处理更多 token 将比增加参数更有效,我们预期最优算力曲线会脱离比例关系。这正是我们看到的。
Appendix B C4 Scaling Coefficients
附录 B C4 缩放系数
While Hoffmann et al. 2022 have shown that the equal scaling of model parameters and training tokens holds across different training datasets, the precise ratios vary considerably across datasets and approaches. For example given the Gopher [89] compute budget of FLOPs, their parametric loss function fitted on MassiveWeb predicts an optimal allocation of 40 billion parameters. Meanwhile, if the training dataset is C4 [90] their IsoFLOP approach predicts 73 billion parameters to be optimal, almost twice as much. However, for C4, which is our training dataset, they do not provide the coefficients necessary to compute loss with their parametric loss function. Based on their IsoFLOP training runs on C4, they only provide the information that for C4, compute () allocated to data () and parameters () should be scaled exactly equally for optimality, i.e. in the relationship and . This corresponds to in the parametric loss function (Equation 2). Thus, we use this information together with the methodology and C4 data points from [42] to fit the parametric loss function. We tie the parameters and to be equal and optimize
尽管 Hoffmann et al. 2022 表明模型参数与训练 token 等比例放大在不同训练数据集上成立,精确比例随数据集与方法变化很大。例如给定 Gopher [89] 的算力预算 FLOPs,他们在 MassiveWeb 上拟合的参数化损失函数预测最优分配为 400 亿参数;而若训练数据集是 C4 [90],其 IsoFLOP 方法预测 730 亿参数最优,几乎翻倍。但对我们所用的训练数据集 C4,他们未提供用参数化损失函数计算损失所需的系数。基于其在 C4 上的 IsoFLOP 训练运行,他们只给出:对 C4,分配给数据 () 与参数 () 的算力 () 应精确等比例放大才最优,即在关系 、 中 。这对应参数化损失函数(式 2)中 。因此,我们结合该信息与 [42] 的方法及其 C4 数据点,拟合参数化损失函数。我们约束 与 相等并优化
where LSE is the log-sum-exp operator and , and the model size, dataset size and loss of the th run, and . We fit on 54 samples on a grid of initialization given by: , , , , and . Our fit results in , , , . Exponentiating , and to get , and and inserting all learned coefficients into Equation 2 then allows us to compute loss () as a function of parameters and data:
其中 LSE 为 log-sum-exp 算子,、、 为第 次运行的模型规模、数据集规模与损失,。我们在 54 个样本上、初始化网格 、、、、 上拟合。拟合结果为 ,,,。对 、、 取指数得到 、、,并全部代入式 2,即可把损失 () 写成参数与数据的函数:
To verify the accuracy of our fit, we benchmark the predictions with those of the IsoFLOP C4 curves in [42]. Following [42], we can compute the optimal number of parameters and tokens for our fit using:
为验证拟合精度,我们把预测与 [42] 中 IsoFLOP C4 曲线的预测对照。遵循 [42],可用我们的拟合按如下方式计算最优参数量 与 token 数 :
Given the Gopher compute budget of our fitted parameters predict an optimal allocation of billion parameters and trillion tokens. This is very close to the 73 billion parameters and 1.3 trillion tokens predicted by the IsoFLOP curves on C4 from [42] and thus we consider it a good fit. We use these fitted parameters rather than the MassiveWeb parameters for all computations involving Chinchilla scaling laws.
给定 Gopher 算力预算 ,我们拟合的参数预测最优分配为 亿参数、 万亿 token。这非常接近 [42] 在 C4 上 IsoFLOP 曲线预测的 730 亿参数与 1.3 万亿 token,因而我们认为拟合良好。凡涉及 Chinchilla 缩放律的计算,我们都使用这些拟合参数,而非 MassiveWeb 参数。
Appendix C Additional Contour Plots
附录 C 额外等高线图
Figure 8contains additional empirical isoLoss contours for 400 million and 1.5 billion unique tokens. Results show that like in Figure 3 significantly lower loss can be achieved by increasing parameters and epochs beyond what is compute-optimal at a single epoch. The lowest loss is also achieved by allocating more extra compute to repeating data rather than to adding parameters.
图 8 给出 4 亿与 15 亿唯一 token 的额外经验 isoLoss 等高线。结果表明:与图 3 一样,把参数与 epoch 增到超过单 epoch 算力最优,可达到显著更低损失。最低损失也通过把更多额外算力分给重复数据而非增加参数获得。
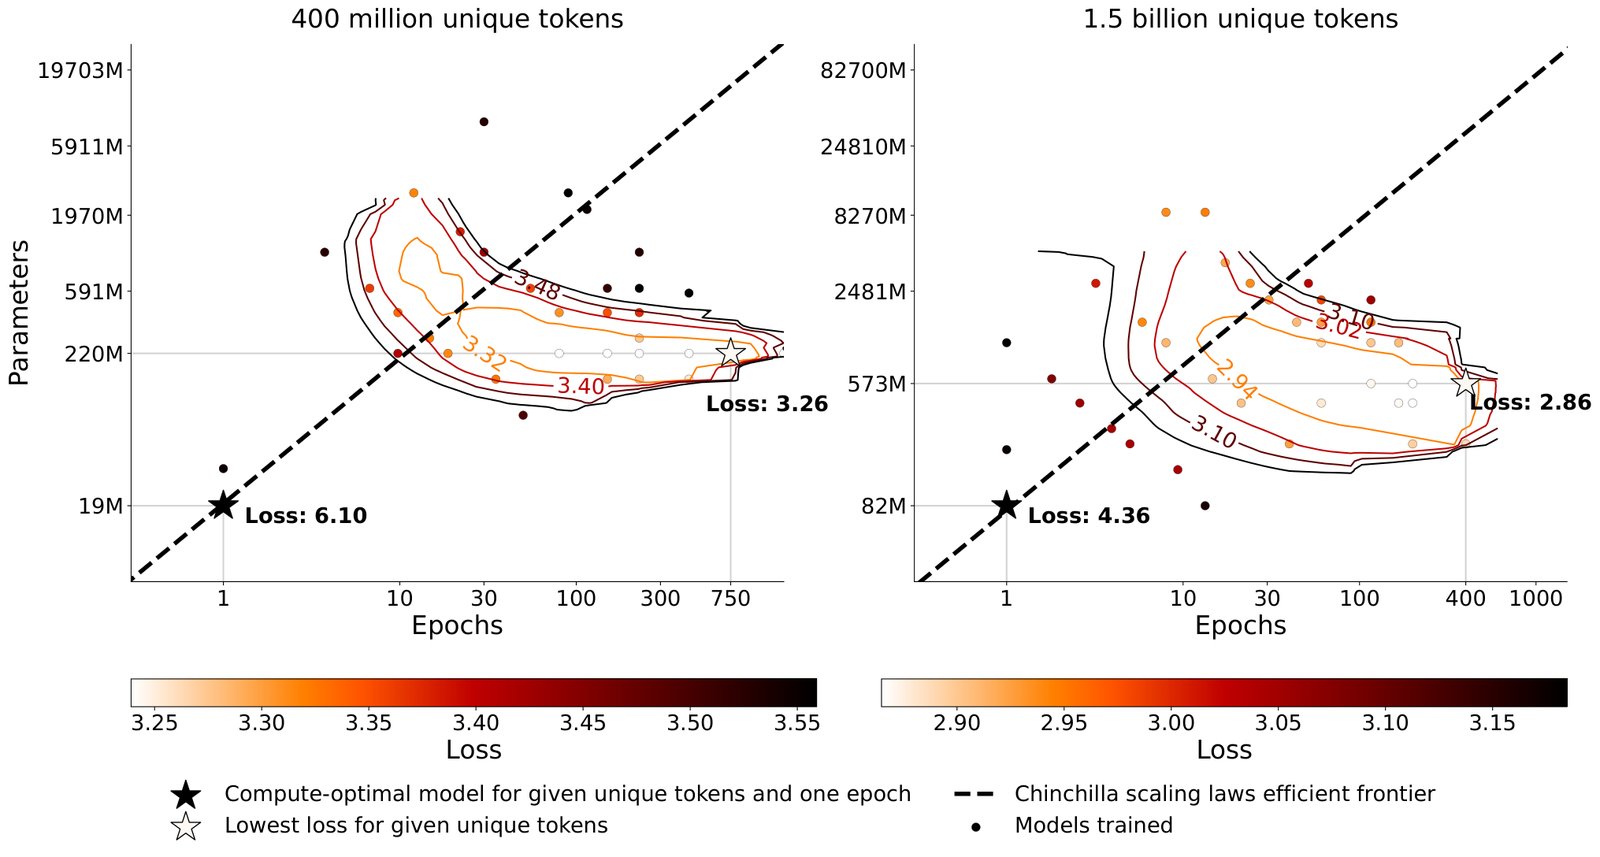
Figure 8: Empirical isoLoss curves for 400 million and 1.5 billion unique tokens. 34 models trained on 400 million unique tokens and 37 models trained on 1.5 billion unique tokens with varying parameters and epochs.
图 8:4 亿与 15 亿唯一 token 的经验 isoLoss 曲线。34 个模型(左)与 55 个模型(右)在固定数据集上以不同参数与 epoch 训练。等高线为相同最终测试损失结果的插值。
Appendix D Double Descent
附录 D 双重下降
Prior work has reported double descent phenomena when repeating data, where the loss initially increases and then decreases again as the model is trained for more epochs [75, 40]. In Figure 9, we plot the loss curves of several models trained for varying epochs on 100 million tokens. We find double descent phenomena with the loss of all models increasing at 200 epochs before decreasing again. This contributes to additional noise in the fitting of our functions in Appendix A, as our functional form assumes loss to be monotonically decreasing as epochs increase. Thus, we remove most such examples from the fitting.
我们观察到若干设定出现双重下降现象:损失随 epoch 先降、再升、再降。图 9 展示一例。双重下降使拟合更嘈杂,因为同一损失可能对应多个不同的 epoch/参数配置。我们未专门为双重下降建模,而是在拟合中将其视为噪声。实践中,这意味着沿高效前沿可能存在多个局部最优;但对我们的主要结论——最多约 4 个 epoch 重复几乎无损、超过约 16 个 epoch 后收益急剧递减——双重下降并不改变定性图景。
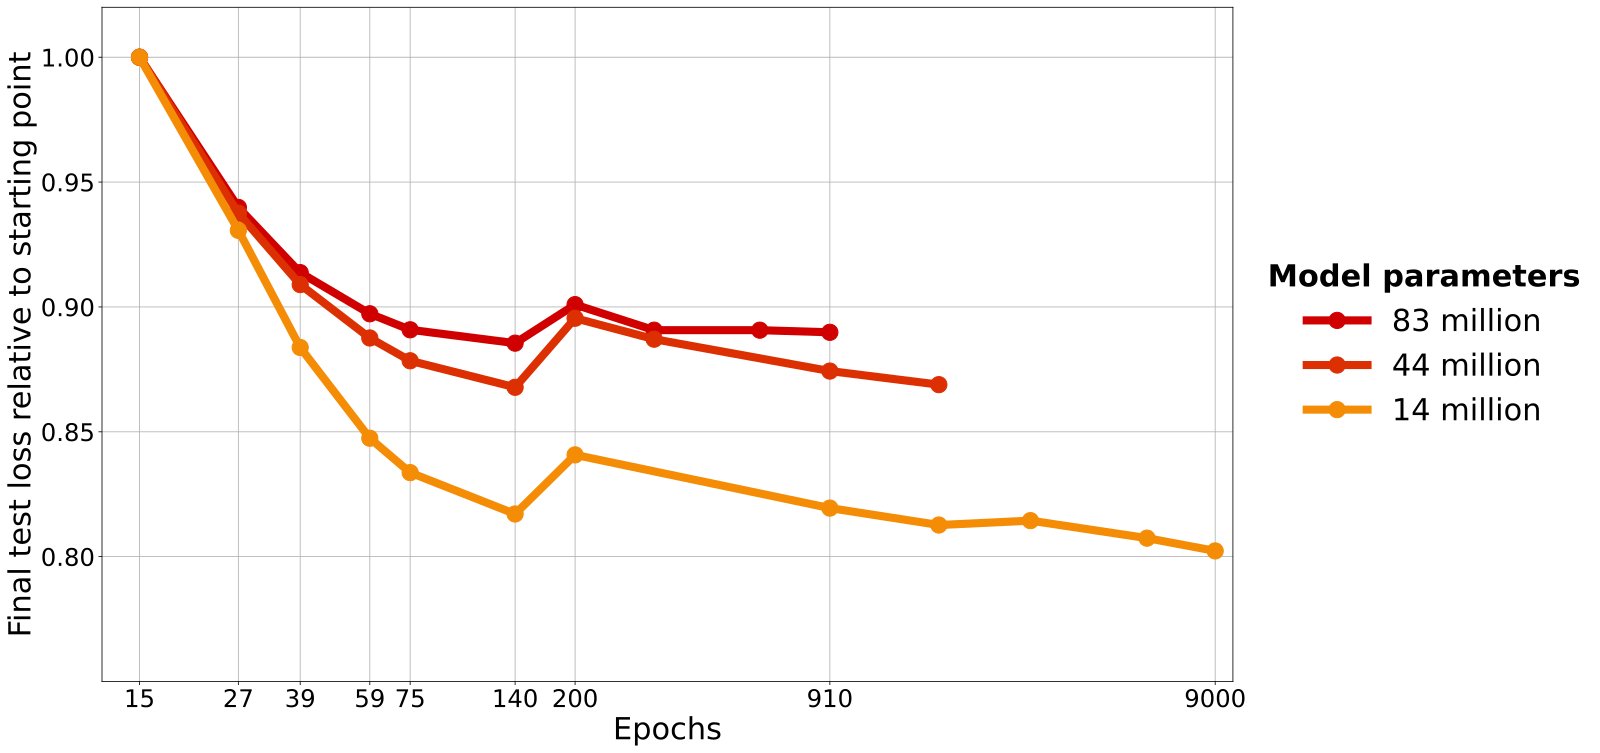
Figure 9: Double descent. Each dot is a model trained on 100 million unique tokens. Loss initially increases at 200 epochs and then decreases again; this is known as epoch-wise double descent [75].
图 9:双重下降。每个点是在 1 亿唯一 token 上训练的模型。损失随参数与 epoch 先降后升再降。
Appendix E Repeating on Heavily Deduplicated Data
附录 E 在重度去重数据上重复
To investigate whether Figure 3 is dependent on the inherent amount of duplicates in the selected 100 million tokens, we train several models on a deduplicated version of C4 (see Appendix N). We plot the performance of the models trained on the deduplicated C4 versus the regular C4 in Figure 10. All models are evaluated on the same validation dataset from the regular C4. Regardless of deduplication we find 59 epochs to be optimal and the overall trend to be very similar. Together with our results on OSCAR (Appendix I), this suggests that our work generalizes to different datasets with different inherent amounts of duplicates.
去重会显著缩小可用数据,可能迫使更多重复。图 10 比较在去重前后的 C4 子集上训练。结果表明:即便数据已去重,适度重复(最多约数个 epoch)仍接近未去重、更多唯一数据的损失;过度重复同样导致收益递减。这支持主文结论:去重本身不能替代「用重复填满算力预算」的策略选择,而应与代码增强等互补手段一并考虑。
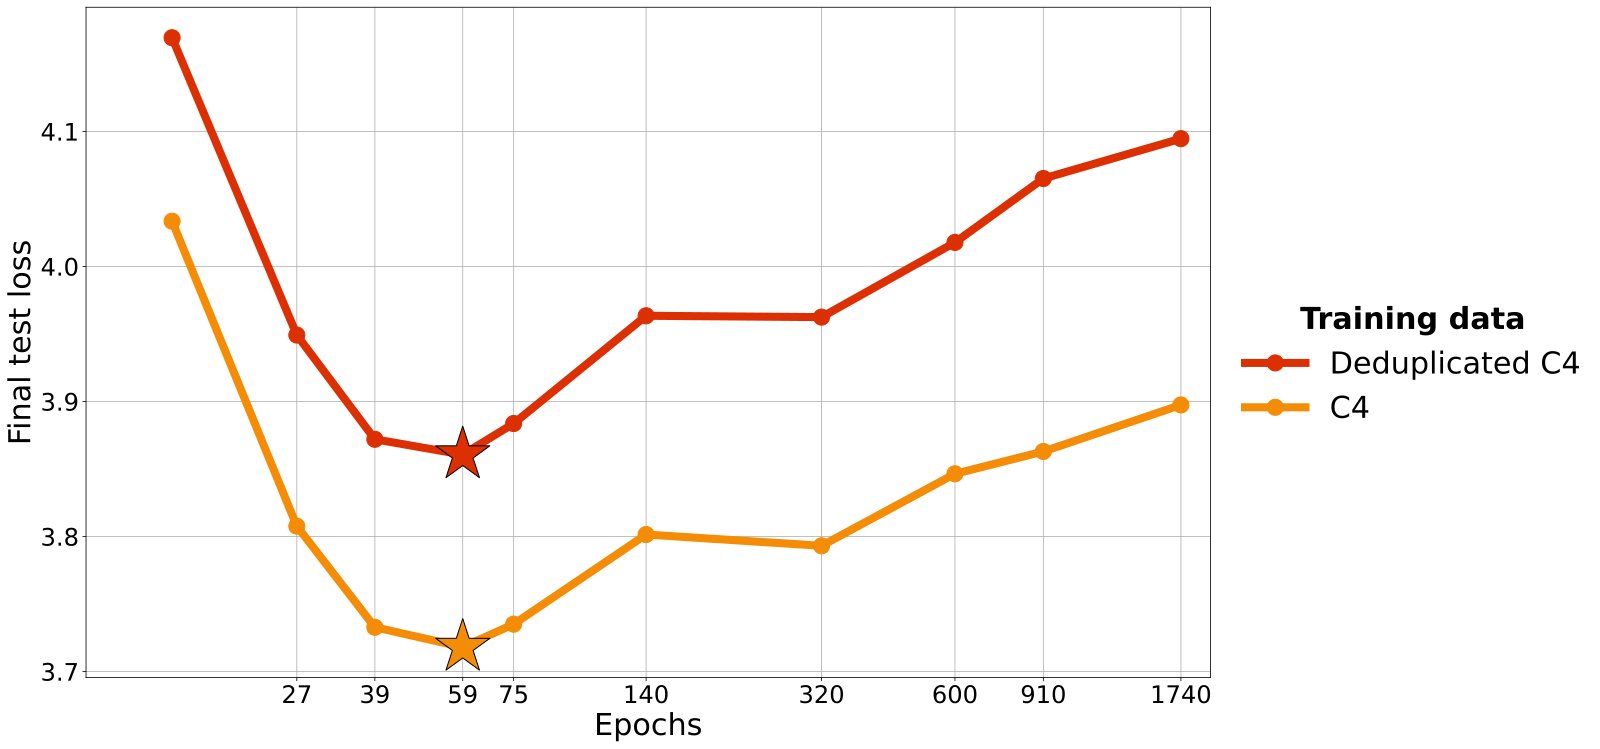
Figure 10: Optimal loss on deduplicated data. 146 million parameter models trained on 100 million unique tokens that are either directly from C4 or undergo additional deduplication. Each dot is a single model. While deduplication results in a higher test loss, the optimal number of epochs remains the same whether or not deduplication is performed (see also Figure 3).
图 10:去重数据上的最优损失。1.46 亿参数模型在去重与未去重数据上训练。适度重复仍有益;过度重复收益递减。
Appendix F Do Excess Parameters Hurt, Plateau or Help?
附录 F 多余参数是伤害、平台还是有帮助?
Figures 3, 8 suggest that excess parameters (or epochs) can harm performance. We hypothesize that this is due to suboptimal hyperparameters and could be prevented with better regularization. Thus, we expect with optimal regularization hyperparameters excess parameters would never hurt, but performance would merely plateau, as in extreme cases regularization could just take the form of removing the excess parameters. One approach to selecting optimal hyperparameters is P [127]. We compare excessively large models trained with a data constraint of million tokens in Figure 11 across P, our default hyperparameters (Appendix S) and scaling law predictions. Surprisingly, P leads to even higher test loss than our default hyperparameters. Nevertheless, we find that also with P excessive parameters hurt: The models with more than 2 billion parameters have significantly higher validation loss after training than the models with 200 million to 1 billion parameters when trained on only 100 million tokens. However, P only covers hyperparameters such as the learning rate, but not explicit regularization hyperparameters like dropout rates, which we hypothesize would prevent this behavior. Thus, our proposed scaling equations predict loss to plateau, as seen in the straight line. As the compute-optimal parameter count for 100 million tokens is around 7 million, all depicted models have a significant amount of excess parameters and data-constrained scaling laws predict their losses to be all the same (). Meanwhile, the default Chinchilla scaling law [42] predicts loss to continue decreasing as parameters are added, which is in stark contrast to the empirical data.
主文公式假定多余参数/epoch 只会让收益递减到平台,而不会使损失变差。经验上我们看到:当参数或 epoch 远超数据所能支撑时,测试损失可能上升(过拟合)。图 11 与图 12 比较经验损失与仅衰减 、仅衰减 、以及同时衰减二者的预测。同时衰减给出与数据最接近的等高线。对明显失败的运行(训练中途损失飙升),参数化拟合会低估最终损失;这些点在拟合时被当作离群点去掉或降权。实践含义是:数据受限高效前沿应读作「在合理正则与不过度重复前提下的建议配比」,而非保证任意大 或任意多 epoch 都安全。
If one wants to incorporate excess parameters hurting performance into the scaling law equations, one could consider (a) Modifying the exponential decay formulation introduced in Appendix A such that instead of the value of repeated data decaying to it decays to a large negative value (b) decaying the exponents and in Equation 7 instead of and . Decaying the exponents to has the effect of more repetitions eventually hurting performance as and the same for . Thus, initially as and increase loss decreases, but ultimately the decay of and pushes and back to resulting in loss to increase. Specifically, approach (b) could take the form of:
为进一步检验「多余参数是否总有帮助」,我们固定唯一数据并扫更大模型。在多数预算上,超过某一规模后损失停止改进甚至变差,与 有限、多余参数快速贬值的图像一致。这也解释了为何数据受限前沿相对 Chinchilla 更偏向「少参数、多 epoch」。
Like the equations in Appendix A this formulation also reduces to the Chinchilla scaling laws in the base case of or . As the exponents decrease with more repetitions adding parameters or epochs becomes less beneficial. Eventually, the decay in or causes loss to increase again as it pushes or back down to . We fit this formula using the same approach outlined in Appendix A but including samples where excess parameters or epochs hurt (296 total samples). We use a grid of initialization given by: and . This results in and . is significantly lower resulting in excess parameters hurting faster than excess epochs, which is in line with empirical data from Figure 3. We visualize Figure 3 with the predictions from this alpha-beta decay formulation in Figure 12. Expected parameters eventually hurt resulting in circle-shaped contours. Due to the very high the area where epochs start to hurt is outside of the boundaries of Figure 12. While the predicted optimal allocation (efficient frontier) is similar to Figure 3, the predicted return from repeated data differs significantly. The alpha-beta decay formulation incorrectly predicts returns to diminish significantly slower as seen by the longer efficient frontier and the smaller distance in contours early on as compared to Figure 3. Beyond its potentially useful properties, we do not have a rigorous mathematical justification for this alpha-beta decay formulation which could be the cause of the incorrect return predictions.
我们还比较了不同衰减公式在留出运行上的预测误差。式 14(指数饱和形式)在可解释性与拟合质量之间取得较好折中;显式几何级数(式 10)拟合略优但项更多。全文图表均使用式 14 与附录 A 报告的 、。
Ultimately, we settle on our exponential decay formulation from Appendix A that does not allow excess parameters or epochs to hurt, as preventing such behavior is trivial by stopping training (in the case of epochs hurting) or removing excess parameters (in the case of model parameters hurting). Further, accurately predicting how much loss increases in the limit is not very useful, as in practice one would want to stop training when it’s expected to plateau anyways.
最后指出:若施加更强正则(dropout、权重衰减、早停),「过多参数伤害」的区域可能缩小,损失更接近平台而非回升。我们的实验为看清重复极限,有意弱化早停,因此观察到的回升是上界式警示,而非不可缓解。
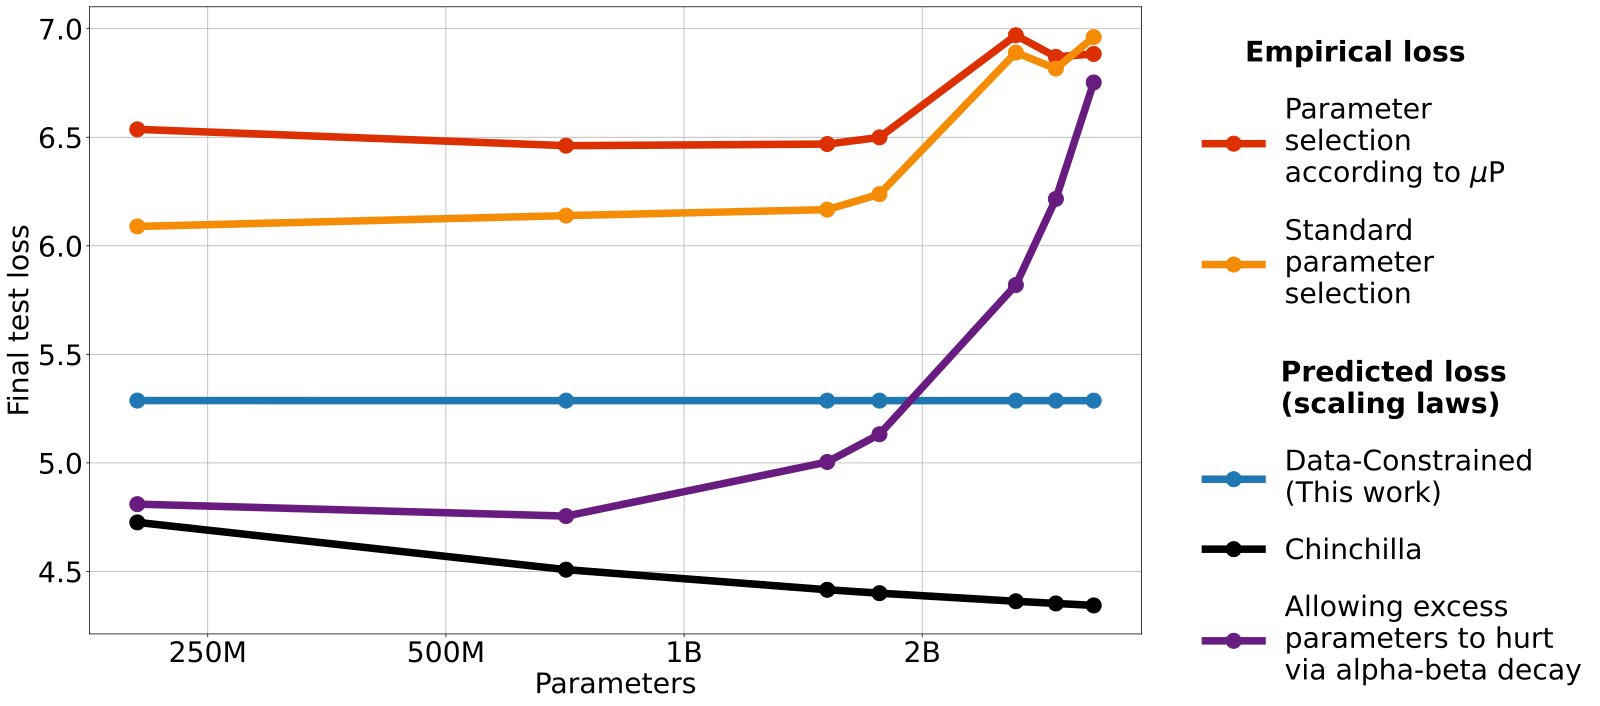
Figure 11: Empirical and predicted losses of LLMs trained on 100 million tokens for a single epoch. Excess parameters empirically hurt performance, but this may be due to a lack of regularization. Thus, our scaling formula predicts loss to plateau, while Chinchilla predicts loss to improve. By decaying the exponent (and ) instead, one can allow excess parameters to hurt.
图 11:在 1 亿 token 上训练的 LLM 的经验与预测损失。点为经验最终测试损失;线为数据受限缩放律预测。拟合能捕捉重复带来的衰减,但对训练失败的极端重复低估损失。
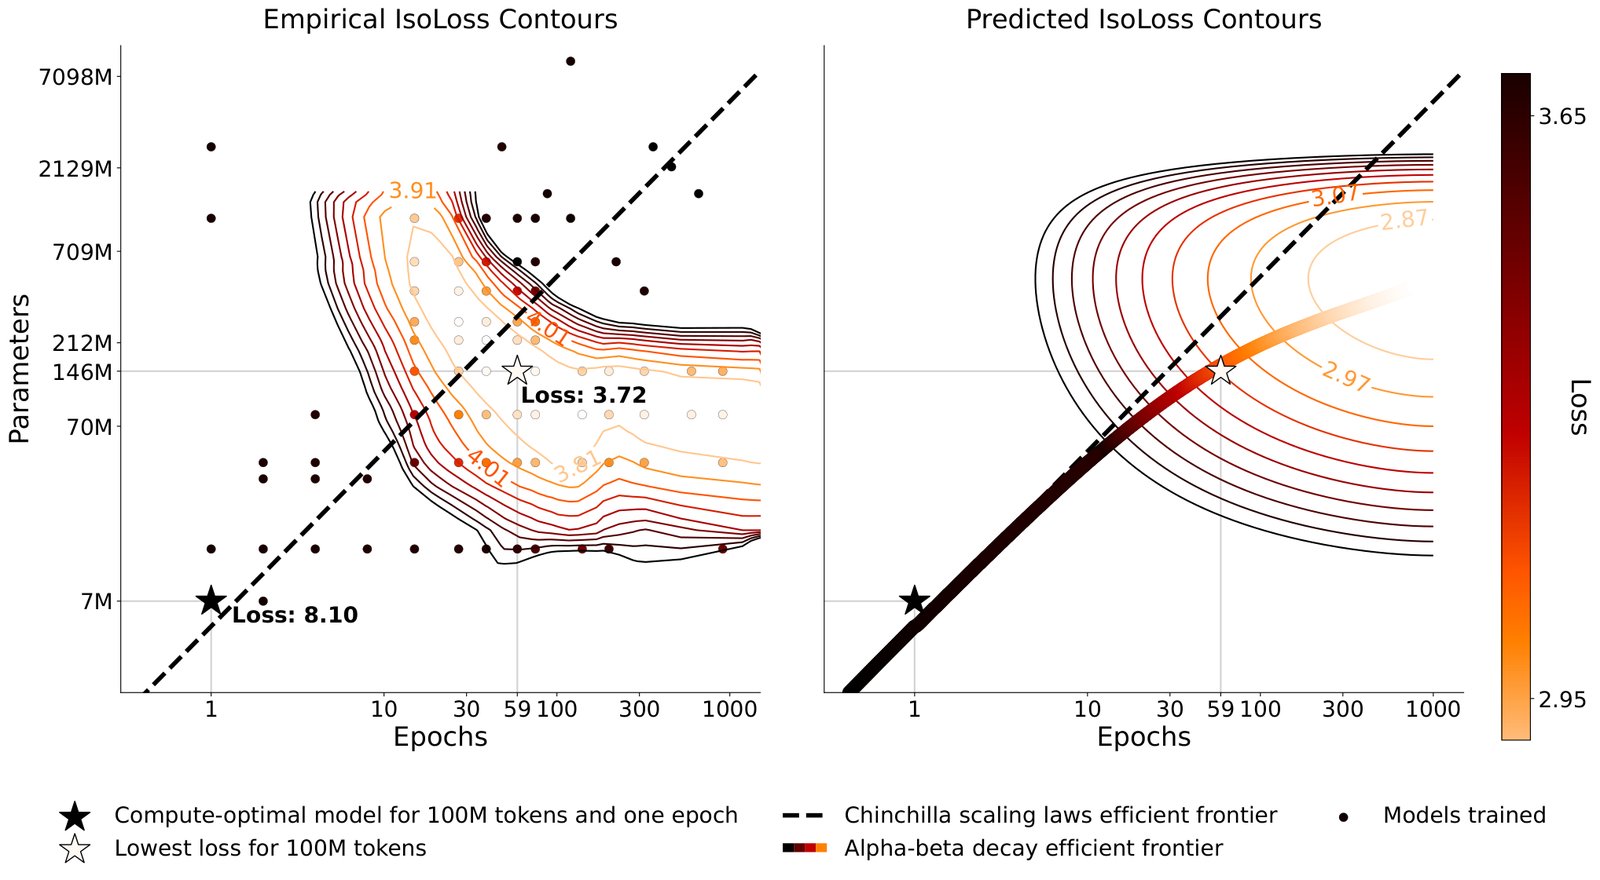
Figure 12: IsoLoss contours for 100 million unique tokens with contours predicted by parametric decay of alpha and beta. The same models from Figure 3 with the contour predictions being done by the alpha-beta decay formulation introduced in Appendix F.
图 12:1 亿唯一 token 的 IsoLoss 等高线,叠加参数化拟合预测的等高线。经验与预测形状相近;高效前沿偏向更多 epoch。
Appendix G Case Study: Galactica
附录 G 案例研究:Galactica
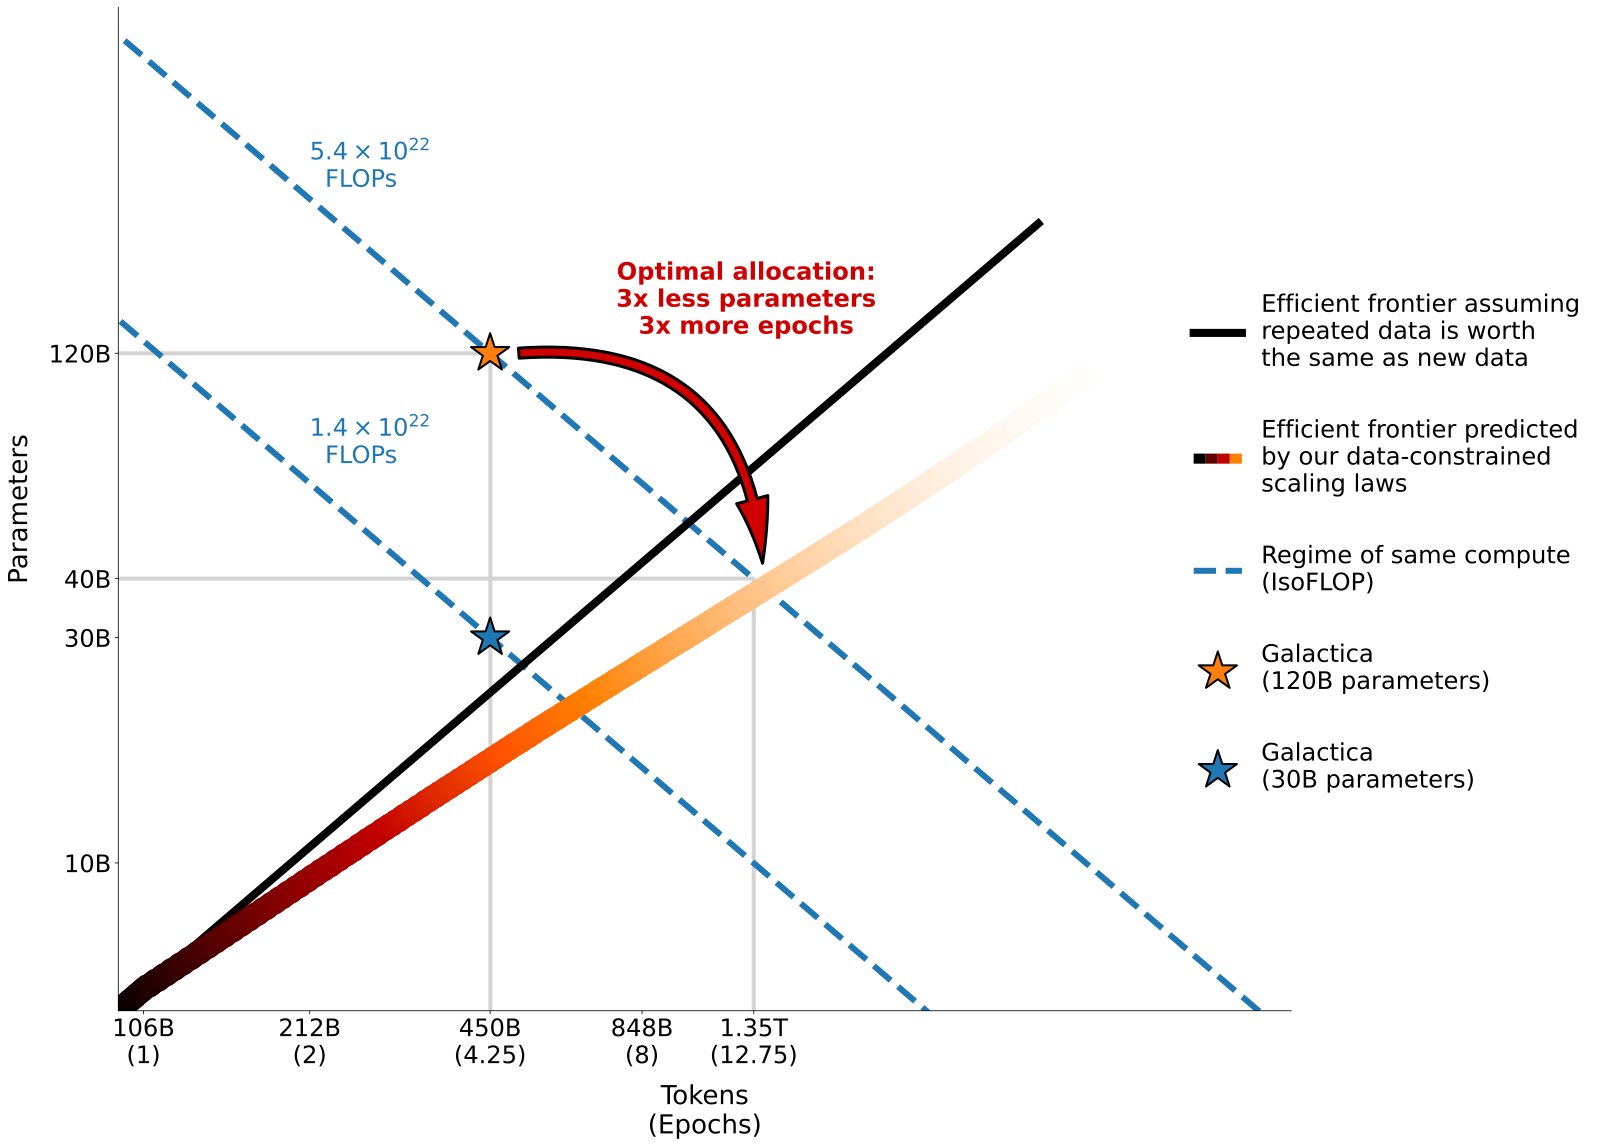
Figure 13: Optimal compute allocation for Galactica. Efficient frontier assuming repeated data is worth the same as new data (Chinchilla scaling laws) and data-constrained efficient frontier assuming a unique token budget of 106 billion tokens like for the Galactica models [108]. For optimal compute allocation according to our proposed data-constrained scaling laws, the 120 billion Galactica model should have been significantly smaller and trained for more epochs.
图 13:Galactica 的最优算力分配。假定可重复数据时的高效前沿。按数据受限缩放律,120B Galactica 相对其重复设定偏大,更小模型可能同算力更优。
The Galactica models [108] are the only publicly known LLMs that explicitly trained for a significant number of epochs prior to this work. They trained their models on 106 billion unique tokens for 4.25 epochs. Our findings on Return from repeated data agree with their conclusion that multiple epochs are beneficial, however, we find that even more epochs can be beneficial and a small spike in validation loss does not justify stopping training (Appendix J). Meanwhile, our findings on Allocation significantly deviate from Galactica. Figure 13 visualizes the Galactica models with our predicted efficient frontier in the same style as Figure 1. The creators of Galactica decided to train a 120 billion parameter model on 450 billion tokens, a significant overallocation to parameters even in Chinchilla terms (black efficient frontier). This decision was likely driven by the intuition that repeated data is worth less, thus one should spend more compute on parameters. However, our empirical data contradicts this. Parameters learning from repeated data are worth even less than repeated data, thus one should overallocate to epochs, not parameters. Our data-constrained scaling laws thus predict that a better model could have been trained by allocating significantly more FLOPs to epochs rather than parameters for the largest Galactica model with 120 billion parameters. Specifically, 40 billion parameters trained for 1.35 trillion tokens (12.75 epochs) would have been optimal according to data-constrained scaling laws. Note that these scaling laws have been fitted on C4, which is not the dataset used to pre-train Galactica. The Galactica models are pre-trained on a predominantly scientific dataset, which includes code data among other data sources. Results from [42] show that there are differences in the scaling coefficients when training on C4 as compared to GitHub code, however, the overall allocation trend is the same. Thus, while we expect a smaller model trained for more epochs to be better than the 120 billion parameter model, the optimal allocation is unlikely to be exactly 40 billion parameters and 1.35 trillion tokens.
Galactica [108] 在科学语料上训练约 4.25 个 epoch,并报告验证损失与下游指标持续改进。这常被引用为「多 epoch 可行」的证据,但缺少与「同等算力、单 epoch、更多唯一数据」的对照。把我们的数据受限前沿套到其公开的参数量与重复设定上:相对 Chinchilla 式单 epoch 最优, 已进入重复仍有价值、但 不宜过大的区间。前沿建议:在相似唯一数据预算下,应把更多算力分给额外 epoch,并使用显著更小的模型。换言之,Galactica 展示了重复的可行性,却未必展示了重复设定下的算力最优Allocation。若未来在科学域收集到更多唯一 token,应优先扩大 ;若数据墙已到,则应按 量级规划重复上限,并避免盲目堆参数。
Appendix H Training Loss
附录 H 训练损失
Hoffmann et al. 2022 use training loss as their core metric. However, when repeating data for multiple epochs, training loss is a bad metric as models will overfit to the limited data available as shown in Figure 14. Thus, we use loss on a held-out test set as our key performance metric.
重复数据时训练损失可持续下降,而测试损失已过拟合上升。图 14 展示平滑后的训练损失;可见多 epoch 曲线在训练集上仍改进,因此若只看训练损失会高估重复收益。这也是主文坚持报告留出测试损失的原因。
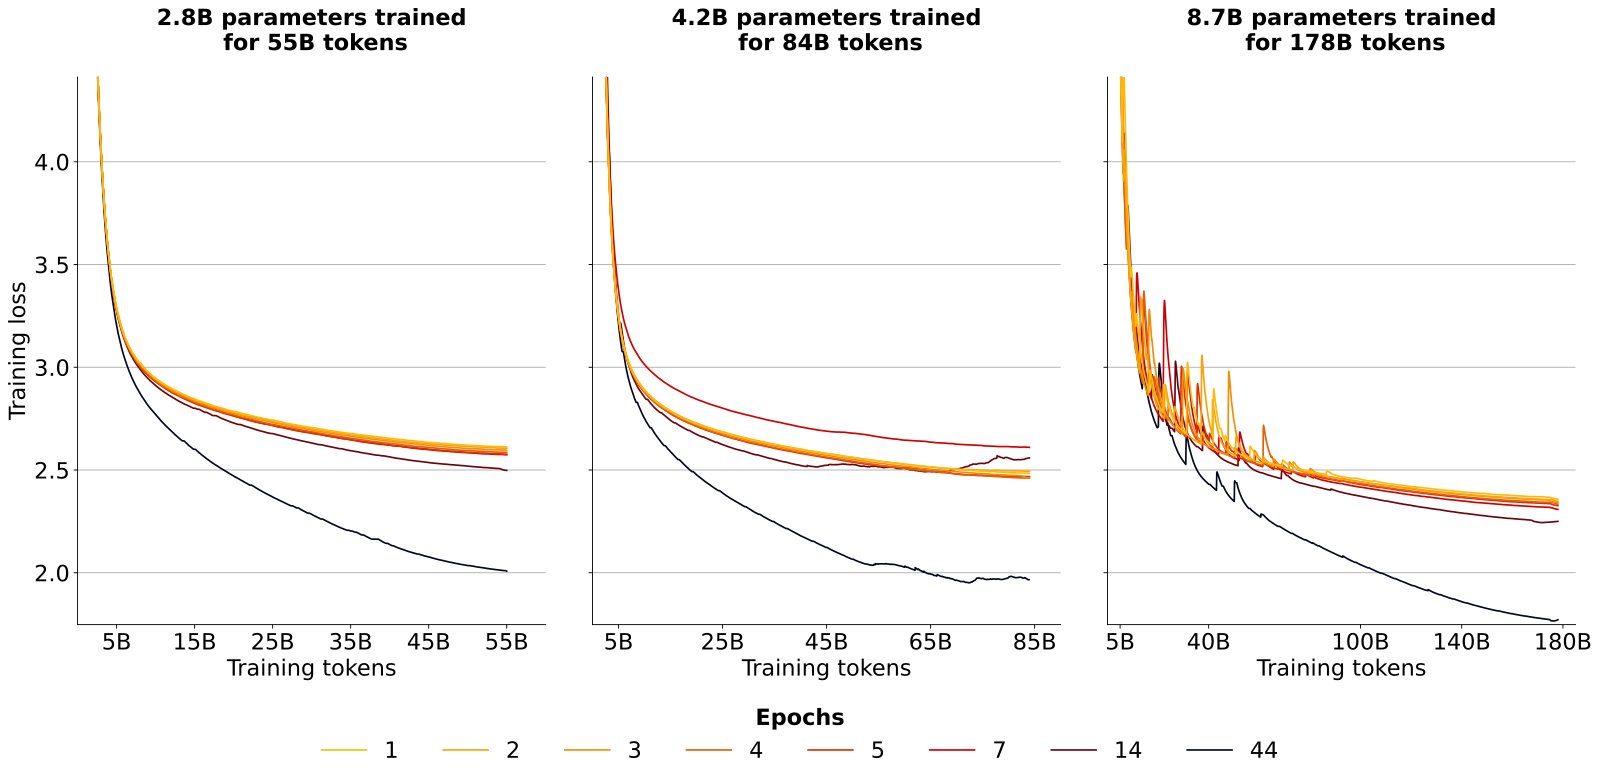
Figure 14: Training loss smoothed with exponential moving average smoothing and a weight of 0.999. Models trained on fewer unique tokens (more epochs) have better training loss as they overfit.
图 14:用指数移动平均平滑、权重衰减后的训练损失。多 epoch 运行在训练集上持续下降,但测试损失可能已变差。
Appendix I Scaling Curves on the OSCAR Corpus
附录 I OSCAR 语料上的缩放曲线
To ensure our findings are not dataset-dependent, we train models with the same configurations from Figure 4 on the OSCAR corpus [83]. OSCAR is considered noisier than C4 [90] due to its less stringent duplication. Figures 15,16 depict the validation and training loss of these models. We find the trend to be the same as for models trained on C4: While models with fewer repeats have better loss, differences for a few repeats are insignificant.
为检验结论是否绑死在 C4,我们在 OSCAR 上训练若干模型。图 15–16 显示:验证与训练损失随重复的定性行为与 C4 一致——少量 epoch 接近唯一数据,过多 epoch 后收益消失。OSCAR 更嘈杂,过滤的相对收益更大(见附录 O),但「最多约 4 个 epoch 几乎无损、 量级后失效」的图像仍然成立。
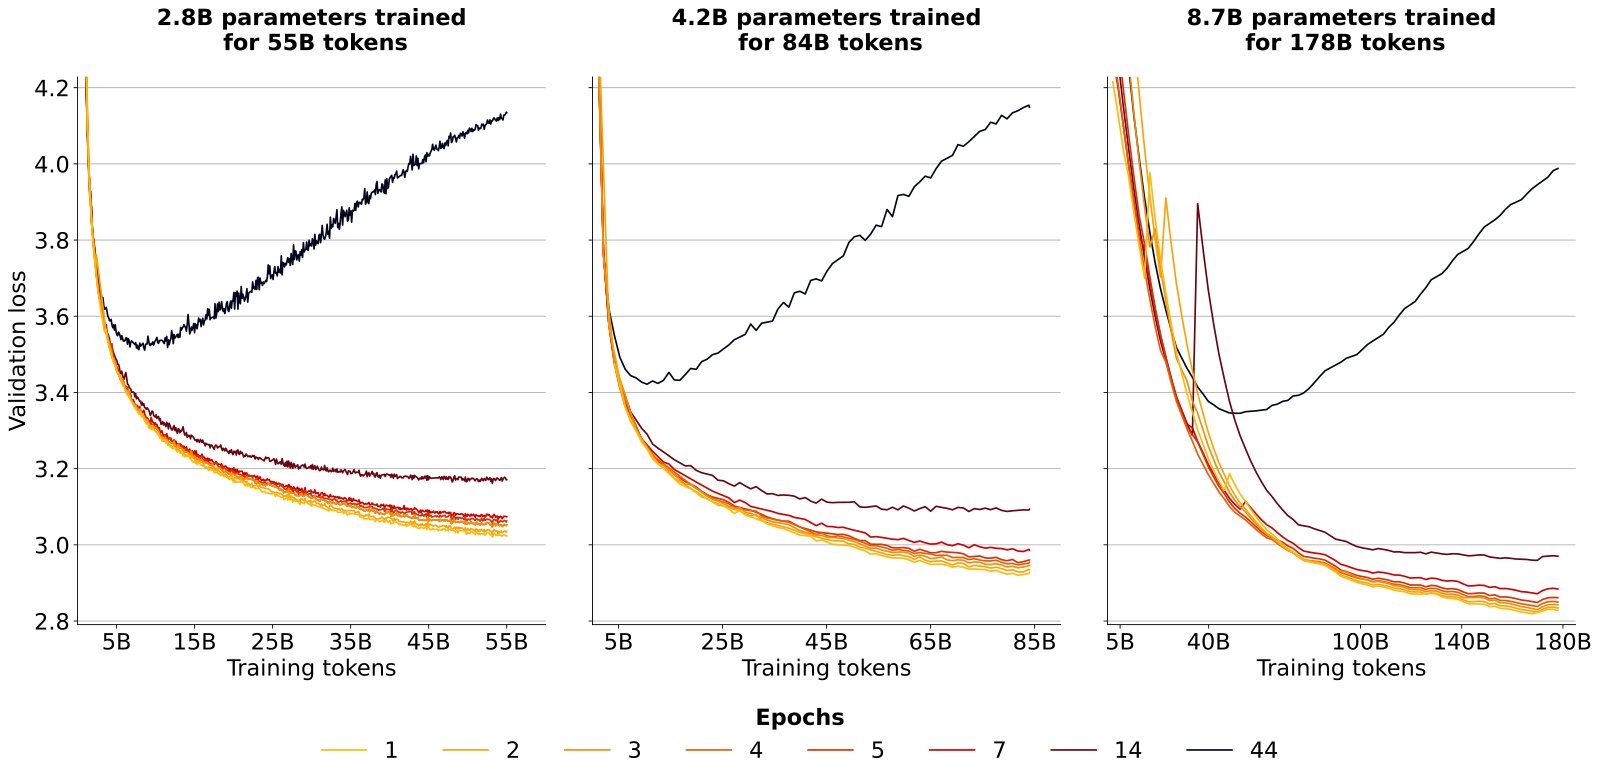
Figure 15: Validation loss during training for models trained on OSCAR. Models trained on tokens that are repeated for multiple epochs have consistently worse loss.
图 15:在 OSCAR 上训练的模型训练过程中的验证损失。少量重复接近单 epoch;过多 epoch 后验证损失变差。
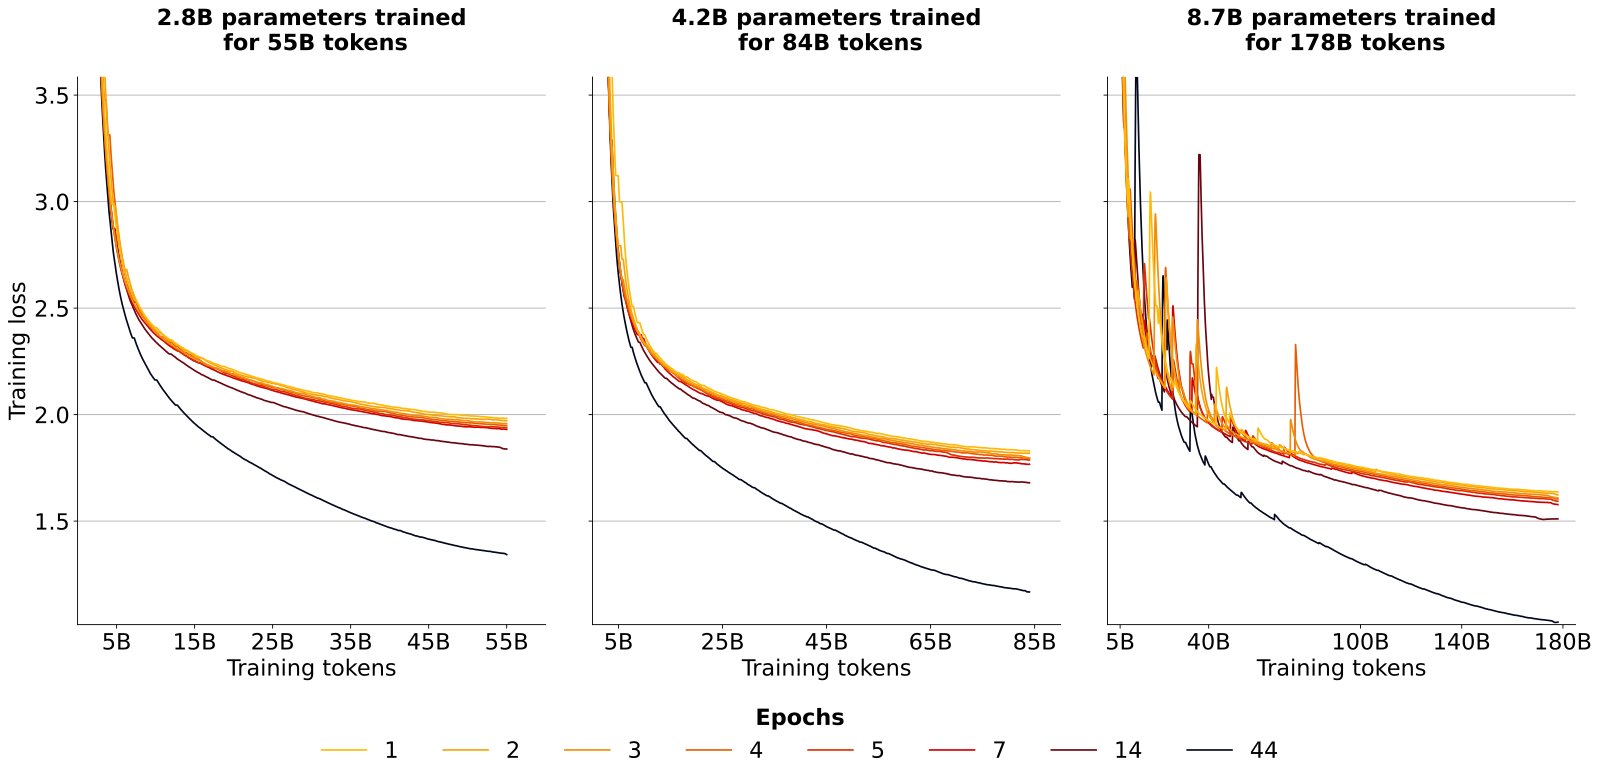
Figure 16: Training loss for models trained on OSCAR smoothed with exponential moving average smoothing and a weight of 0.999. Models trained on fewer unique tokens (more epochs) have better training loss as they overfit.
图 16:在 OSCAR 上训练、经指数移动平均平滑的训练损失。训练集上可持续下降,需对照验证损失解读。
Appendix J Validation Loss by Epoch
附录 J 按 epoch 可视化的验证损失
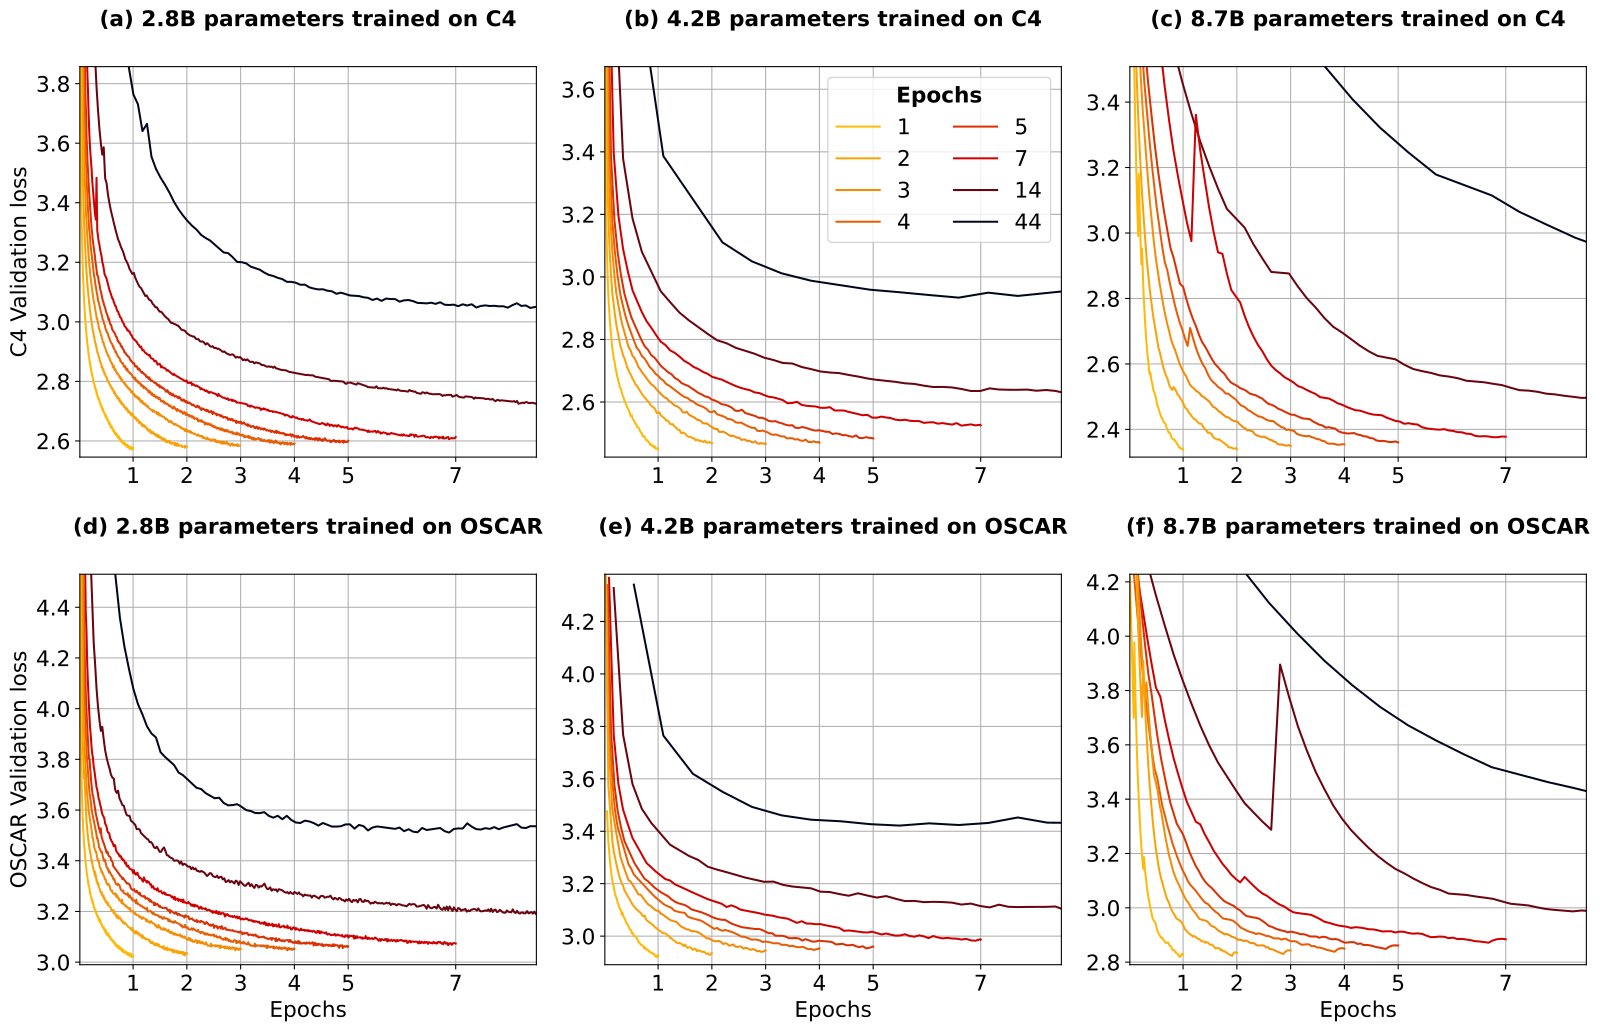
Figure 17: Validation loss during training visualized by epochs. Loss progresses smoothly throughout training. There are temporary spikes for 8.7 billion parameter models, commonly at the start of a new epoch.
图 17:按 epoch 可视化的训练过程验证损失。损失随 epoch 平滑推进;过多 epoch 后趋于平台或回升。
Taylor et al. 2022 decided to early-stop pre-training of the Galactica models due to a small increase in validation loss at the start of the fifth epoch. In Figure 17 we plot the validation loss curves of our isoFLOP models as a function of epochs. We do find small increases in validation loss when models enter a new epoch. For example, upon entering the third and fourth epoch, the 7-epoch 8.7 billion parameter OSCAR model shows loss spikes. However, these are temporary and loss continues to go down smoothly thereafter. Thus, we hypothesize that the Galactica models could have attained better performance by continuing pre-training beyond the loss spike experienced at the beginning of the fifth epoch.
将横轴改为 epoch 而非总 token,更易看到「前几个 epoch 陡降、之后变平」的形态。不同数据预算下,进入平台的 epoch 位置与我们拟合的 同量级,为半衰期诠释提供直观支持。
Appendix K Evaluation Details
附录 K 评测细节
| FLOP budget | Parameters | Evaluation Interval | Evaluation Tokens |
|---|---|---|---|
| B | 100 | 105 million | |
| B | 1000 | 105 million | |
| B | 1000 | 2.1 million |
Table 2: Setup for computing validation loss during training. At every Evaluation Interval, loss is computed on Evaluation Tokens many tokens from the validation set. The evaluation tokens vary with the interval, i.e. the evaluation tokens at 100 steps are not the same as at 200 steps. However, the tokens do not vary across data budgets for the same FLOP budget (Figure 4). For example, billion parameter models with billion tokens are evaluated on the same data as models with billion tokens at each evaluation interval.
| FLOP 预算 | 参数 | 评测间隔 | 评测 Token |
|---|---|---|---|
| B | 100 | 105 million | |
| B | 1000 | 105 million | |
| B | 1000 | 2.1 million |
Table 2: Setup for computing validation loss during training. At every 评测间隔, loss is computed on 评测 Token many tokens from the validation set. The evaluation tokens vary with the interval, i.e. the evaluation tokens at 100 steps are not the same as at 200 steps. However, the tokens do not vary across data budgets for the same FLOP 预算 (Figure 4). For example, billion parameter models with billion tokens are evaluated on the same data as models with billion tokens at each evaluation interval.
Loss evaluation
For all models trained on C4, the final test loss is computed on the same 210 million tokens from the C4 validation set after training. For held-out evaluation during training, such as in Figure 4, the configurations are displayed in Table 2. The small number of evaluation tokens for the 8.7 billion parameter models likely contributes to the loss spikes for 8.7 billion parameter models seen in Figure 4. Thus, we smooth the validation loss curves of 8.7 billion parameter models with exponential moving average smoothing and a weight of 0.85. For training OSCAR, configurations are the same, however, the validation split used is a held-out part from the OSCAR training split, as there is no official validation split for OSCAR. All training loss curves for C4 and OSCAR models are smoothed with exponential moving average smoothing and a weight of 0.999.
损失评测
对所有在 C4 上训练的模型,最终测试损失在来自 C4 验证拆分的同一 2.1 亿 token 上计算。对 OSCAR 模型使用 OSCAR 验证子集。我们每隔固定 token 间隔评测,并报告训练结束时的最终测试损失。训练损失用指数移动平均平滑以便可视化;测试/验证损失除非另有说明不做平滑。
Downstream evaluation
We provide statistics of all downstream evaluation datasets in Table 3. We use the evaluation-harness frameworks from BigScience and EleutherAI [32] to evaluate models on 19 evaluation datasets. For each dataset, a maximum of 3000 samples are evaluated with 0,1,2,3,4 and 5 few-shots [15] to produce six scores which are then averaged. We normalize scores to range from the random baseline of each task to 1 and report them as percentages. For example, if random guessing produces 50% accuracy and the maximum accuracy possible is 100%, then a raw accuracy of 55% would be normalized to 10%, and a raw accuracy of 45% would be normalized to -10% since it is worse than random. This is done to give all tasks the same weight. Otherwise average performance would heavily depend on generative tasks, where the random baselines are 0. Prompts are sourced from GPT-3 [15] and PromptSource [5] and detailed in Appendix T. We note that our evaluation is in no means comprehensive and a larger benchmarking would be helpful [102, 73]. However, by training five seeds for most models benchmarked, always averaging 0-5 fewshots, and ensuring maximum data overlap for repeated data (§4) we significantly reduce uncertainty.
下游评测
表 3 给出全部下游评测数据集的统计。我们使用 EleutherAI 的 lm-evaluation-harness 与 PromptSource 提示。分数在平均前按各任务随机基线与满分重缩放,使不同指标可比较。每个模型在 0–5 个上下文样例上评测,共 114 个分数后取平均。
| Dataset | Split(s) | Samples | Baseline | URL |
|---|---|---|---|---|
| ANLI [79] | dev_r1,2,3 | 3000 | 33.3 | hf.co/datasets/anli |
| ARC-Easy [22] | test | 1172 | 25.0 | hf.co/datasets/ai2_arc |
| ARC-Challenge [22] | test | 2376 | 25.0 | hf.co/datasets/ai2_arc |
| BoolQ [21] | validation | 3270 | 50.0 | hf.co/datasets/boolq |
| CB [25] | validation | 56 | 33.3 | hf.co/datasets/super_glue |
| Copa [92] | validation | 100 | 50.0 | hf.co/datasets/super_glue |
| HellaSwag [129] | test | 10003 | 25.0 | hf.co/datasets/hellaswag |
| PiQA [12] | validation | 1838 | 50.0 | hf.co/datasets/piqa |
| RTE [24, 114] | validation | 277 | 50.0 | hf.co/datasets/super_glue |
| SciQ [120] | test | 1000 | 25.0 | hf.co/datasets/sciq |
| StoryCloze 2016 [69] | test | 1871 | 25.0 | hf.co/datasets/story_cloze |
| WinoGrande XL [93] | test | 1267 | 50.0 | hf.co/datasets/winogrande |
| E2E NLG [29] | test | 4693 | 0.0 | hf.co/datasets/e2e_nlg_cleaned |
| XSUM [77, 34] | test | 11334 | 0.0 | hf.co/datasets/GEM/xsum |
| WebNLG EN [17, 34] | test | 5150 | 0.0 | hf.co/datasets/GEM/web_nlg |
| WikiLingua EN [53, 34] | sampled_test | 3000 | 0.0 | hf.co/datasets/GEM/wiki_lingua |
| bAbI [122] | test | 19000 | 0.0 | hf.co/datasets/Muennighoff/babi |
Table 3: Downstream evaluation datasets. We evaluate on 19 datasets: The first 14 are evaluated using accuracy (ANLI counted as three), the next 4 using ROUGE-2 f-measure [59] and bAbI using exact match.
| 数据集 | 拆分 | 样本数 | 基线 | URL |
|---|---|---|---|---|
| ANLI [79] | dev_r1,2,3 | 3000 | 33.3 | hf.co/datasets/anli |
| ARC-Easy [22] | test | 1172 | 25.0 | hf.co/datasets/ai2_arc |
| ARC-Challenge [22] | test | 2376 | 25.0 | hf.co/datasets/ai2_arc |
| BoolQ [21] | validation | 3270 | 50.0 | hf.co/datasets/boolq |
| CB [25] | validation | 56 | 33.3 | hf.co/datasets/super_glue |
| Copa [92] | validation | 100 | 50.0 | hf.co/datasets/super_glue |
| HellaSwag [129] | test | 10003 | 25.0 | hf.co/datasets/hellaswag |
| PiQA [12] | validation | 1838 | 50.0 | hf.co/datasets/piqa |
| RTE [24, 114] | validation | 277 | 50.0 | hf.co/datasets/super_glue |
| SciQ [120] | test | 1000 | 25.0 | hf.co/datasets/sciq |
| StoryCloze 2016 [69] | test | 1871 | 25.0 | hf.co/datasets/story_cloze |
| WinoGrande XL [93] | test | 1267 | 50.0 | hf.co/datasets/winogrande |
| E2E NLG [29] | test | 4693 | 0.0 | hf.co/datasets/e2e_nlg_cleaned |
| XSUM [77, 34] | test | 11334 | 0.0 | hf.co/datasets/GEM/xsum |
| WebNLG EN [17, 34] | test | 5150 | 0.0 | hf.co/datasets/GEM/web_nlg |
| WikiLingua EN [53, 34] | sampled_test | 3000 | 0.0 | hf.co/datasets/GEM/wiki_lingua |
| bAbI [122] | test | 19000 | 0.0 | hf.co/datasets/Muennighoff/babi |
Table 3: Downstream evaluation datasets. We evaluate on 19 datasets: The first 14 are evaluated using accuracy (ANLI counted as three), the next 4 using ROUGE-2 f-measure [59] and bAbI using exact match.
Appendix L Downstream Repetition Results
附录 L 下游重复结果
In Tables 4-9 we report downstream results of all models trained on C4 [90] and OSCAR [83] according to the configurations in Figure 4. All scores are from the final checkpoints at the end of training. OSCAR is a noisier dataset than C4 due to less filtering, thus models trained on C4 generally perform better. Notably, models trained on C4 completely fail on bAbI [122], while OSCAR models are able to perform better than random. This is likely due to code data being present in OSCAR, which enables state-tracking capabilities like for code augmented models in §7. For C4 the creators strictly removed all data that resembles code [90]. There are no significant differences between models trained for a single epoch and models trained for up to 4 epochs. Even models trained for more epochs (and thus on less unique data) have similar performance.
表 4–9 报告按图 4 配置在 C4 [90] 与 OSCAR [83] 上训练的全部模型的下游结果。分数为重缩放后在 19 个任务、0–5 shot 上的平均。可见最多约 4 个 epoch 时下游分数与单 epoch 接近,之后下降,与测试损失趋势一致。
| Data Budget | 55B | 28B | 18B | 14B | 11B | 9B | 4B | 1.25B |
|---|---|---|---|---|---|---|---|---|
| Epochs | 1 | 2 | 3 | 4 | 5 | 7 | 14 | 44 |
| ANLI R1 | 0.4 ± 1.6 | 0.7 ± 0.8 | 0.3 ± 0.5 | -0.3 ± 1.8 | 0.4 ± 1.8 | 0.4 ± 0.7 | 0.0 ± 0.9 | -0.6 ± 0.6 |
| ANLI R2 | 0.9 ± 0.4 | 1.4 ± 0.8 | 0.8 ± 0.8 | 1.1 ± 0.7 | 0.5 ± 0.7 | 0.6 ± 1.0 | 1.1 ± 1.1 | 2.7 ± 1.6 |
| ANLI R3 | 1.7 ± 0.5 | 1.2 ± 0.4 | 0.4 ± 0.5 | 1.9 ± 0.7 | 0.6 ± 1.0 | 0.8 ± 0.8 | 1.7 ± 0.7 | 0.7 ± 1.7 |
| ARC-Challenge | 1.6 ± 1.0 | 0.9 ± 0.5 | 1.2 ± 0.6 | 1.1 ± 0.6 | 1.1 ± 1.2 | 1.3 ± 0.5 | 0.3 ± 0.6 | -2.9 ± 1.0 |
| ARC-Easy | 44.5 ± 0.5 | 44.9 ± 0.4 | 44.7 ± 0.7 | 44.3 ± 0.4 | 44.0 ± 0.5 | 44.2 ± 0.9 | 41.4 ± 0.2 | 28.9 ± 0.7 |
| BoolQ | 18.8 ± 3.4 | 16.2 ± 5.2 | 16.1 ± 2.7 | 19.7 ± 1.8 | 15.0 ± 3.8 | 16.9 ± 3.2 | 13.1 ± 4.9 | -2.1 ± 4.7 |
| CB | 20.0 ± 4.7 | 17.4 ± 6.4 | 14.6 ± 5.1 | 17.5 ± 4.2 | 12.3 ± 12.2 | 14.4 ± 7.5 | 21.6 ± 8.4 | 21.3 ± 5.6 |
| COPA | 49.7 ± 3.5 | 50.3 ± 3.4 | 49.9 ± 2.3 | 50.1 ± 2.5 | 50.9 ± 1.2 | 48.1 ± 2.4 | 43.5 ± 3.1 | 33.3 ± 1.9 |
| HellaSwag | 24.7 ± 0.3 | 24.6 ± 0.2 | 24.3 ± 0.1 | 24.3 ± 0.0 | 24.3 ± 0.3 | 24.1 ± 0.1 | 22.8 ± 0.2 | 16.7 ± 0.4 |
| PiQA | 47.9 ± 0.6 | 47.6 ± 0.8 | 47.3 ± 0.3 | 47.6 ± 0.6 | 47.6 ± 0.7 | 47.0 ± 0.2 | 45.6 ± 0.5 | 37.0 ± 0.4 |
| RTE | 5.1 ± 4.0 | 2.5 ± 4.5 | 8.4 ± 2.6 | 6.0 ± 2.5 | 5.1 ± 1.6 | 2.3 ± 3.9 | 7.8 ± 2.5 | 2.6 ± 4.3 |
| SciQ | 83.2 ± 0.6 | 82.5 ± 0.6 | 82.7 ± 1.1 | 81.9 ± 0.6 | 81.9 ± 0.8 | 81.6 ± 0.9 | 78.5 ± 1.1 | 59.3 ± 1.6 |
| StoryCloze 2016 | 58.7 ± 0.2 | 58.7 ± 0.5 | 58.5 ± 0.3 | 58.3 ± 0.3 | 58.5 ± 0.6 | 58.4 ± 0.3 | 56.7 ± 0.5 | 52.0 ± 0.6 |
| WinoGrande XL | 11.6 ± 0.8 | 10.8 ± 1.1 | 10.9 ± 1.3 | 10.6 ± 0.5 | 11.1 ± 0.9 | 10.6 ± 0.9 | 6.4 ± 1.3 | 2.9 ± 1.3 |
| E2E NLG | 17.0 ± 1.4 | 17.7 ± 0.5 | 17.0 ± 1.2 | 16.9 ± 1.1 | 15.1 ± 2.3 | 13.3 ± 2.2 | 14.9 ± 0.9 | 9.8 ± 0.9 |
| XSUM | 2.4 ± 0.1 | 2.4 ± 0.1 | 2.5 ± 0.1 | 2.3 ± 0.2 | 2.4 ± 0.1 | 2.4 ± 0.1 | 2.1 ± 0.1 | 1.6 ± 0.1 |
| WebNLG EN | 5.3 ± 0.1 | 5.5 ± 0.2 | 5.4 ± 0.1 | 5.4 ± 0.1 | 5.1 ± 0.1 | 5.4 ± 0.2 | 5.1 ± 0.3 | 2.9 ± 0.2 |
| WikiLingua EN | 3.0 ± 0.1 | 3.1 ± 0.1 | 2.9 ± 0.1 | 2.9 ± 0.3 | 2.9 ± 0.2 | 2.9 ± 0.1 | 2.6 ± 0.1 | 2.0 ± 0.2 |
| bAbI | 0.0 ± 0.0 | 0.0 ± 0.0 | 0.0 ± 0.0 | 0.0 ± 0.0 | 0.0 ± 0.0 | 0.0 ± 0.0 | 0.0 ± 0.0 | 0.0 ± 0.0 |
| Average | 20.9 ± 0.4 | 20.4 ± 0.3 | 20.4 ± 0.2 | 20.6 ± 0.2 | 19.9 ± 0.9 | 19.7 ± 0.2 | 19.2 ± 0.5 | 14.1 ± 0.4 |
Table 4: Results for 2.8B parameter models trained on repeated data on C4 for 55B total tokens. Scores are normalized averages of 0-5 few-shots and reported as percentages. We report mean/std. err. across five different models, each trained with a different random seed.
| 数据预算 | 55B | 28B | 18B | 14B | 11B | 9B | 4B | 1.25B |
|---|---|---|---|---|---|---|---|---|
| Epochs | 1 | 2 | 3 | 4 | 5 | 7 | 14 | 44 |
| ANLI R1 | 0.4 ± 1.6 | 0.7 ± 0.8 | 0.3 ± 0.5 | -0.3 ± 1.8 | 0.4 ± 1.8 | 0.4 ± 0.7 | 0.0 ± 0.9 | -0.6 ± 0.6 |
| ANLI R2 | 0.9 ± 0.4 | 1.4 ± 0.8 | 0.8 ± 0.8 | 1.1 ± 0.7 | 0.5 ± 0.7 | 0.6 ± 1.0 | 1.1 ± 1.1 | 2.7 ± 1.6 |
| ANLI R3 | 1.7 ± 0.5 | 1.2 ± 0.4 | 0.4 ± 0.5 | 1.9 ± 0.7 | 0.6 ± 1.0 | 0.8 ± 0.8 | 1.7 ± 0.7 | 0.7 ± 1.7 |
| ARC-Challenge | 1.6 ± 1.0 | 0.9 ± 0.5 | 1.2 ± 0.6 | 1.1 ± 0.6 | 1.1 ± 1.2 | 1.3 ± 0.5 | 0.3 ± 0.6 | -2.9 ± 1.0 |
| ARC-Easy | 44.5 ± 0.5 | 44.9 ± 0.4 | 44.7 ± 0.7 | 44.3 ± 0.4 | 44.0 ± 0.5 | 44.2 ± 0.9 | 41.4 ± 0.2 | 28.9 ± 0.7 |
| BoolQ | 18.8 ± 3.4 | 16.2 ± 5.2 | 16.1 ± 2.7 | 19.7 ± 1.8 | 15.0 ± 3.8 | 16.9 ± 3.2 | 13.1 ± 4.9 | -2.1 ± 4.7 |
| CB | 20.0 ± 4.7 | 17.4 ± 6.4 | 14.6 ± 5.1 | 17.5 ± 4.2 | 12.3 ± 12.2 | 14.4 ± 7.5 | 21.6 ± 8.4 | 21.3 ± 5.6 |
| COPA | 49.7 ± 3.5 | 50.3 ± 3.4 | 49.9 ± 2.3 | 50.1 ± 2.5 | 50.9 ± 1.2 | 48.1 ± 2.4 | 43.5 ± 3.1 | 33.3 ± 1.9 |
| HellaSwag | 24.7 ± 0.3 | 24.6 ± 0.2 | 24.3 ± 0.1 | 24.3 ± 0.0 | 24.3 ± 0.3 | 24.1 ± 0.1 | 22.8 ± 0.2 | 16.7 ± 0.4 |
| PiQA | 47.9 ± 0.6 | 47.6 ± 0.8 | 47.3 ± 0.3 | 47.6 ± 0.6 | 47.6 ± 0.7 | 47.0 ± 0.2 | 45.6 ± 0.5 | 37.0 ± 0.4 |
| RTE | 5.1 ± 4.0 | 2.5 ± 4.5 | 8.4 ± 2.6 | 6.0 ± 2.5 | 5.1 ± 1.6 | 2.3 ± 3.9 | 7.8 ± 2.5 | 2.6 ± 4.3 |
| SciQ | 83.2 ± 0.6 | 82.5 ± 0.6 | 82.7 ± 1.1 | 81.9 ± 0.6 | 81.9 ± 0.8 | 81.6 ± 0.9 | 78.5 ± 1.1 | 59.3 ± 1.6 |
| StoryCloze 2016 | 58.7 ± 0.2 | 58.7 ± 0.5 | 58.5 ± 0.3 | 58.3 ± 0.3 | 58.5 ± 0.6 | 58.4 ± 0.3 | 56.7 ± 0.5 | 52.0 ± 0.6 |
| WinoGrande XL | 11.6 ± 0.8 | 10.8 ± 1.1 | 10.9 ± 1.3 | 10.6 ± 0.5 | 11.1 ± 0.9 | 10.6 ± 0.9 | 6.4 ± 1.3 | 2.9 ± 1.3 |
| E2E NLG | 17.0 ± 1.4 | 17.7 ± 0.5 | 17.0 ± 1.2 | 16.9 ± 1.1 | 15.1 ± 2.3 | 13.3 ± 2.2 | 14.9 ± 0.9 | 9.8 ± 0.9 |
| XSUM | 2.4 ± 0.1 | 2.4 ± 0.1 | 2.5 ± 0.1 | 2.3 ± 0.2 | 2.4 ± 0.1 | 2.4 ± 0.1 | 2.1 ± 0.1 | 1.6 ± 0.1 |
| WebNLG EN | 5.3 ± 0.1 | 5.5 ± 0.2 | 5.4 ± 0.1 | 5.4 ± 0.1 | 5.1 ± 0.1 | 5.4 ± 0.2 | 5.1 ± 0.3 | 2.9 ± 0.2 |
| WikiLingua EN | 3.0 ± 0.1 | 3.1 ± 0.1 | 2.9 ± 0.1 | 2.9 ± 0.3 | 2.9 ± 0.2 | 2.9 ± 0.1 | 2.6 ± 0.1 | 2.0 ± 0.2 |
| bAbI | 0.0 ± 0.0 | 0.0 ± 0.0 | 0.0 ± 0.0 | 0.0 ± 0.0 | 0.0 ± 0.0 | 0.0 ± 0.0 | 0.0 ± 0.0 | 0.0 ± 0.0 |
| Average | 20.9 ± 0.4 | 20.4 ± 0.3 | 20.4 ± 0.2 | 20.6 ± 0.2 | 19.9 ± 0.9 | 19.7 ± 0.2 | 19.2 ± 0.5 | 14.1 ± 0.4 |
Table 4: Results for 2.8B parameter models trained on repeated data on C4 for 55B total tokens. Scores are normalized averages of 0-5 few-shots and reported as percentages. We report mean/std. err. across five different models, each trained with a different random seed.
| Data Budget | 55B | 28B | 18B | 14B | 11B | 9B | 4B | 1.25B |
|---|---|---|---|---|---|---|---|---|
| Epochs | 1 | 2 | 3 | 4 | 5 | 7 | 14 | 44 |
| ANLI R1 | -0.3 ± 0.5 | -0.6 ± 1.3 | 0.2 ± 0.6 | 0.3 ± 1.1 | 0.2 ± 1.2 | -0.1 ± 1.1 | -0.1 ± 0.5 | -0.7 ± 1.3 |
| ANLI R2 | 1.0 ± 1.0 | 1.1 ± 0.3 | 1.7 ± 0.8 | 2.3 ± 0.8 | 1.4 ± 1.0 | 0.8 ± 0.7 | 1.0 ± 0.7 | 2.3 ± 0.7 |
| ANLI R3 | 0.4 ± 0.8 | 0.5 ± 0.5 | -0.2 ± 0.8 | -0.1 ± 1.0 | 1.1 ± 0.6 | 0.7 ± 0.4 | -0.2 ± 0.9 | 0.5 ± 1.2 |
| ARC-Challenge | -1.4 ± 0.8 | -0.6 ± 0.8 | -1.7 ± 0.1 | -1.6 ± 0.7 | -1.6 ± 0.6 | -1.4 ± 0.5 | -1.9 ± 0.8 | -5.0 ± 1.1 |
| ARC-Easy | 39.7 ± 0.3 | 39.6 ± 0.8 | 39.5 ± 0.6 | 39.3 ± 0.5 | 38.7 ± 0.6 | 38.7 ± 0.4 | 36.9 ± 0.4 | 25.4 ± 0.7 |
| BoolQ | 12.8 ± 4.4 | 7.8 ± 3.8 | 7.9 ± 3.8 | 3.3 ± 5.4 | 0.2 ± 3.0 | 2.3 ± 6.1 | -2.1 ± 2.4 | 7.4 ± 6.1 |
| CB | 19.7 ± 5.1 | 15.4 ± 7.3 | 13.2 ± 5.1 | 12.6 ± 2.6 | 21.7 ± 3.6 | 15.4 ± 3.7 | 16.2 ± 5.2 | 9.7 ± 5.7 |
| COPA | 42.7 ± 2.2 | 39.5 ± 2.2 | 40.9 ± 2.0 | 41.5 ± 2.1 | 38.5 ± 2.4 | 40.4 ± 2.4 | 38.6 ± 2.6 | 28.5 ± 3.1 |
| HellaSwag | 16.3 ± 0.1 | 16.3 ± 0.2 | 16.3 ± 0.2 | 16.1 ± 0.2 | 16.0 ± 0.1 | 15.9 ± 0.2 | 15.0 ± 0.2 | 11.7 ± 0.1 |
| PiQA | 41.2 ± 0.7 | 41.4 ± 0.5 | 40.3 ± 0.4 | 40.6 ± 0.5 | 40.3 ± 0.9 | 39.8 ± 0.6 | 38.8 ± 1.1 | 31.0 ± 0.4 |
| RTE | 3.9 ± 1.1 | 2.1 ± 1.6 | 2.3 ± 3.3 | 1.6 ± 3.0 | 0.5 ± 2.1 | 2.9 ± 2.5 | 0.9 ± 3.4 | -3.2 ± 2.7 |
| SciQ | 83.2 ± 0.6 | 82.4 ± 0.6 | 82.1 ± 0.9 | 82.6 ± 0.7 | 81.5 ± 0.9 | 80.5 ± 0.6 | 76.5 ± 1.3 | 57.7 ± 1.8 |
| StoryCloze 2016 | 52.8 ± 0.3 | 52.9 ± 0.4 | 52.6 ± 0.3 | 53.0 ± 0.4 | 52.3 ± 0.4 | 52.4 ± 0.4 | 51.8 ± 0.7 | 47.9 ± 0.5 |
| WinoGrande XL | 5.8 ± 0.9 | 4.4 ± 1.4 | 4.5 ± 0.3 | 4.2 ± 1.3 | 4.5 ± 0.6 | 4.1 ± 0.7 | 1.7 ± 1.2 | 0.8 ± 1.3 |
| E2E NLG | 20.3 ± 0.3 | 19.9 ± 0.5 | 19.9 ± 0.7 | 20.9 ± 0.9 | 19.7 ± 0.7 | 20.4 ± 0.6 | 19.1 ± 0.8 | 14.2 ± 0.7 |
| XSUM | 3.0 ± 0.1 | 2.9 ± 0.0 | 2.9 ± 0.3 | 2.9 ± 0.2 | 2.9 ± 0.1 | 2.8 ± 0.3 | 2.6 ± 0.2 | 1.8 ± 0.1 |
| WebNLG EN | 8.8 ± 0.4 | 8.3 ± 0.6 | 8.5 ± 0.3 | 8.4 ± 0.6 | 8.1 ± 0.2 | 8.2 ± 0.2 | 7.2 ± 0.3 | 3.3 ± 0.3 |
| WikiLingua EN | 2.9 ± 0.1 | 3.1 ± 0.2 | 3.1 ± 0.1 | 3.0 ± 0.1 | 3.1 ± 0.1 | 3.2 ± 0.3 | 2.7 ± 0.2 | 1.7 ± 0.2 |
| bAbI | 15.5 ± 1.0 | 15.7 ± 1.1 | 15.3 ± 0.8 | 15.1 ± 1.5 | 15.9 ± 1.1 | 16.2 ± 0.9 | 14.3 ± 0.6 | 6.6 ± 0.6 |
| Average | 19.4 ± 0.5 | 18.5 ± 0.2 | 18.4 ± 0.4 | 18.2 ± 0.4 | 18.2 ± 0.4 | 18.1 ± 0.4 | 16.8 ± 0.5 | 12.7 ± 0.7 |
Table 5: Results for 2.8B parameter models trained on repeated data on OSCAR for 55B total tokens. Scores are normalized averages of 0-5 few-shots and reported as percentages. We report mean/std. err. across five different models, each trained with a different random seed.
| 数据预算 | 55B | 28B | 18B | 14B | 11B | 9B | 4B | 1.25B |
|---|---|---|---|---|---|---|---|---|
| Epochs | 1 | 2 | 3 | 4 | 5 | 7 | 14 | 44 |
| ANLI R1 | -0.3 ± 0.5 | -0.6 ± 1.3 | 0.2 ± 0.6 | 0.3 ± 1.1 | 0.2 ± 1.2 | -0.1 ± 1.1 | -0.1 ± 0.5 | -0.7 ± 1.3 |
| ANLI R2 | 1.0 ± 1.0 | 1.1 ± 0.3 | 1.7 ± 0.8 | 2.3 ± 0.8 | 1.4 ± 1.0 | 0.8 ± 0.7 | 1.0 ± 0.7 | 2.3 ± 0.7 |
| ANLI R3 | 0.4 ± 0.8 | 0.5 ± 0.5 | -0.2 ± 0.8 | -0.1 ± 1.0 | 1.1 ± 0.6 | 0.7 ± 0.4 | -0.2 ± 0.9 | 0.5 ± 1.2 |
| ARC-Challenge | -1.4 ± 0.8 | -0.6 ± 0.8 | -1.7 ± 0.1 | -1.6 ± 0.7 | -1.6 ± 0.6 | -1.4 ± 0.5 | -1.9 ± 0.8 | -5.0 ± 1.1 |
| ARC-Easy | 39.7 ± 0.3 | 39.6 ± 0.8 | 39.5 ± 0.6 | 39.3 ± 0.5 | 38.7 ± 0.6 | 38.7 ± 0.4 | 36.9 ± 0.4 | 25.4 ± 0.7 |
| BoolQ | 12.8 ± 4.4 | 7.8 ± 3.8 | 7.9 ± 3.8 | 3.3 ± 5.4 | 0.2 ± 3.0 | 2.3 ± 6.1 | -2.1 ± 2.4 | 7.4 ± 6.1 |
| CB | 19.7 ± 5.1 | 15.4 ± 7.3 | 13.2 ± 5.1 | 12.6 ± 2.6 | 21.7 ± 3.6 | 15.4 ± 3.7 | 16.2 ± 5.2 | 9.7 ± 5.7 |
| COPA | 42.7 ± 2.2 | 39.5 ± 2.2 | 40.9 ± 2.0 | 41.5 ± 2.1 | 38.5 ± 2.4 | 40.4 ± 2.4 | 38.6 ± 2.6 | 28.5 ± 3.1 |
| HellaSwag | 16.3 ± 0.1 | 16.3 ± 0.2 | 16.3 ± 0.2 | 16.1 ± 0.2 | 16.0 ± 0.1 | 15.9 ± 0.2 | 15.0 ± 0.2 | 11.7 ± 0.1 |
| PiQA | 41.2 ± 0.7 | 41.4 ± 0.5 | 40.3 ± 0.4 | 40.6 ± 0.5 | 40.3 ± 0.9 | 39.8 ± 0.6 | 38.8 ± 1.1 | 31.0 ± 0.4 |
| RTE | 3.9 ± 1.1 | 2.1 ± 1.6 | 2.3 ± 3.3 | 1.6 ± 3.0 | 0.5 ± 2.1 | 2.9 ± 2.5 | 0.9 ± 3.4 | -3.2 ± 2.7 |
| SciQ | 83.2 ± 0.6 | 82.4 ± 0.6 | 82.1 ± 0.9 | 82.6 ± 0.7 | 81.5 ± 0.9 | 80.5 ± 0.6 | 76.5 ± 1.3 | 57.7 ± 1.8 |
| StoryCloze 2016 | 52.8 ± 0.3 | 52.9 ± 0.4 | 52.6 ± 0.3 | 53.0 ± 0.4 | 52.3 ± 0.4 | 52.4 ± 0.4 | 51.8 ± 0.7 | 47.9 ± 0.5 |
| WinoGrande XL | 5.8 ± 0.9 | 4.4 ± 1.4 | 4.5 ± 0.3 | 4.2 ± 1.3 | 4.5 ± 0.6 | 4.1 ± 0.7 | 1.7 ± 1.2 | 0.8 ± 1.3 |
| E2E NLG | 20.3 ± 0.3 | 19.9 ± 0.5 | 19.9 ± 0.7 | 20.9 ± 0.9 | 19.7 ± 0.7 | 20.4 ± 0.6 | 19.1 ± 0.8 | 14.2 ± 0.7 |
| XSUM | 3.0 ± 0.1 | 2.9 ± 0.0 | 2.9 ± 0.3 | 2.9 ± 0.2 | 2.9 ± 0.1 | 2.8 ± 0.3 | 2.6 ± 0.2 | 1.8 ± 0.1 |
| WebNLG EN | 8.8 ± 0.4 | 8.3 ± 0.6 | 8.5 ± 0.3 | 8.4 ± 0.6 | 8.1 ± 0.2 | 8.2 ± 0.2 | 7.2 ± 0.3 | 3.3 ± 0.3 |
| WikiLingua EN | 2.9 ± 0.1 | 3.1 ± 0.2 | 3.1 ± 0.1 | 3.0 ± 0.1 | 3.1 ± 0.1 | 3.2 ± 0.3 | 2.7 ± 0.2 | 1.7 ± 0.2 |
| bAbI | 15.5 ± 1.0 | 15.7 ± 1.1 | 15.3 ± 0.8 | 15.1 ± 1.5 | 15.9 ± 1.1 | 16.2 ± 0.9 | 14.3 ± 0.6 | 6.6 ± 0.6 |
| Average | 19.4 ± 0.5 | 18.5 ± 0.2 | 18.4 ± 0.4 | 18.2 ± 0.4 | 18.2 ± 0.4 | 18.1 ± 0.4 | 16.8 ± 0.5 | 12.7 ± 0.7 |
Table 5: Results for 2.8B parameter models trained on repeated data on OSCAR for 55B total tokens. Scores are normalized averages of 0-5 few-shots and reported as percentages. We report mean/std. err. across five different models, each trained with a different random seed.
| Unique Tokens | 84B | 42B | 28B | 21B | 17B | 12B | 6B | 1.9B |
|---|---|---|---|---|---|---|---|---|
| Epochs | 1 | 2 | 3 | 4 | 5 | 7 | 14 | 44 |
| ANLI R1 | -1.0 ± 0.3 | -0.7 ± 1.1 | -0.7 ± 1.0 | -0.4 ± 1.1 | 0.4 ± 0.8 | 0.5 ± 1.1 | 0.1 ± 0.9 | 0.2 ± 0.9 |
| ANLI R2 | 0.8 ± 0.5 | 0.8 ± 0.8 | 0.0 ± 1.4 | 0.5 ± 0.7 | 0.5 ± 0.9 | 0.3 ± 1.0 | 0.7 ± 0.7 | 2.5 ± 1.0 |
| ANLI R3 | 1.1 ± 0.7 | 0.8 ± 0.9 | 0.3 ± 0.8 | 1.4 ± 1.1 | 1.3 ± 0.9 | 2.3 ± 0.2 | 1.3 ± 0.2 | 1.6 ± 1.2 |
| ARC-Challenge | 5.3 ± 0.6 | 5.1 ± 0.9 | 5.2 ± 2.0 | 6.0 ± 0.8 | 4.7 ± 0.8 | 3.1 ± 0.4 | 2.9 ± 1.0 | -1.3 ± 1.0 |
| ARC-Easy | 49.2 ± 0.9 | 50.4 ± 1.2 | 47.4 ± 4.5 | 49.4 ± 0.7 | 48.7 ± 1.5 | 44.9 ± 0.7 | 45.0 ± 1.2 | 31.9 ± 0.9 |
| BoolQ | 18.2 ± 4.0 | 19.6 ± 5.1 | 22.1 ± 1.0 | 20.4 ± 3.6 | 18.4 ± 6.0 | 18.4 ± 3.9 | 18.9 ± 2.6 | -3.3 ± 7.1 |
| CB | 12.0 ± 7.2 | 8.5 ± 9.2 | 7.9 ± 10.4 | 19.6 ± 7.3 | 17.8 ± 7.3 | 15.1 ± 5.8 | 17.5 ± 3.5 | 19.5 ± 6.6 |
| COPA | 59.1 ± 5.4 | 57.7 ± 3.5 | 56.7 ± 2.0 | 55.5 ± 2.4 | 56.8 ± 1.8 | 58.9 ± 1.7 | 48.7 ± 3.3 | 34.9 ± 3.4 |
| HellaSwag | 27.8 ± 4.8 | 30.2 ± 0.5 | 29.8 ± 0.9 | 29.9 ± 0.7 | 28.5 ± 1.1 | 29.0 ± 0.5 | 27.0 ± 1.2 | 19.7 ± 0.5 |
| PiQA | 50.6 ± 0.5 | 50.8 ± 0.5 | 48.6 ± 3.4 | 50.9 ± 0.7 | 50.3 ± 1.3 | 49.5 ± 0.4 | 47.6 ± 1.2 | 39.5 ± 1.3 |
| RTE | 5.6 ± 3.1 | 2.6 ± 3.9 | 7.2 ± 2.7 | 7.0 ± 3.2 | 8.8 ± 5.3 | 9.3 ± 3.6 | 3.0 ± 4.3 | 2.6 ± 4.2 |
| SciQ | 84.6 ± 3.9 | 86.1 ± 1.3 | 84.4 ± 3.7 | 85.9 ± 0.7 | 86.2 ± 0.8 | 79.0 ± 0.7 | 81.1 ± 1.4 | 65.3 ± 1.1 |
| StoryCloze 2016 | 61.1 ± 3.7 | 62.6 ± 0.2 | 61.9 ± 2.2 | 62.6 ± 0.4 | 61.8 ± 0.8 | 61.5 ± 0.8 | 60.1 ± 0.7 | 53.9 ± 0.5 |
| WinoGrande XL | 17.0 ± 2.6 | 17.8 ± 1.4 | 16.5 ± 1.8 | 17.1 ± 1.8 | 14.9 ± 1.5 | 15.9 ± 1.2 | 11.8 ± 1.5 | 3.9 ± 0.8 |
| E2E NLG | 18.2 ± 1.2 | 18.8 ± 0.8 | 17.8 ± 1.5 | 16.0 ± 2.2 | 15.9 ± 2.5 | 13.8 ± 1.3 | 15.7 ± 0.9 | 11.2 ± 1.4 |
| XSUM | 2.9 ± 0.2 | 3.0 ± 0.2 | 2.8 ± 0.3 | 2.9 ± 0.2 | 2.9 ± 0.2 | 1.0 ± 0.4 | 2.4 ± 0.1 | 1.8 ± 0.1 |
| WebNLG EN | 4.8 ± 2.0 | 5.7 ± 0.2 | 5.4 ± 0.3 | 5.6 ± 0.2 | 5.4 ± 0.5 | 5.5 ± 0.1 | 5.4 ± 0.2 | 3.4 ± 0.3 |
| WikiLingua EN | 3.3 ± 0.5 | 3.6 ± 0.1 | 3.4 ± 0.1 | 3.4 ± 0.1 | 3.3 ± 0.1 | 1.4 ± 0.6 | 3.0 ± 0.1 | 2.2 ± 0.1 |
| bAbI | 0.0 ± 0.0 | 0.0 ± 0.0 | 0.0 ± 0.0 | 0.0 ± 0.0 | 0.0 ± 0.0 | 0.0 ± 0.0 | 0.0 ± 0.0 | 0.0 ± 0.0 |
| Average | 22.1 ± 1.7 | 22.3 ± 0.9 | 21.9 ± 1.2 | 22.8 ± 0.5 | 22.5 ± 0.6 | 21.6 ± 0.5 | 20.6 ± 0.6 | 15.2 ± 1.0 |
Table 6: Results for 4.2B parameter models trained on repeated data on C4 for 84B total tokens. Scores are normalized averages of 0-5 few-shots and reported as percentages. We report mean/std. err. across five different models, each trained with a different random seed.
| 唯一 Token | 84B | 42B | 28B | 21B | 17B | 12B | 6B | 1.9B |
|---|---|---|---|---|---|---|---|---|
| Epochs | 1 | 2 | 3 | 4 | 5 | 7 | 14 | 44 |
| ANLI R1 | -1.0 ± 0.3 | -0.7 ± 1.1 | -0.7 ± 1.0 | -0.4 ± 1.1 | 0.4 ± 0.8 | 0.5 ± 1.1 | 0.1 ± 0.9 | 0.2 ± 0.9 |
| ANLI R2 | 0.8 ± 0.5 | 0.8 ± 0.8 | 0.0 ± 1.4 | 0.5 ± 0.7 | 0.5 ± 0.9 | 0.3 ± 1.0 | 0.7 ± 0.7 | 2.5 ± 1.0 |
| ANLI R3 | 1.1 ± 0.7 | 0.8 ± 0.9 | 0.3 ± 0.8 | 1.4 ± 1.1 | 1.3 ± 0.9 | 2.3 ± 0.2 | 1.3 ± 0.2 | 1.6 ± 1.2 |
| ARC-Challenge | 5.3 ± 0.6 | 5.1 ± 0.9 | 5.2 ± 2.0 | 6.0 ± 0.8 | 4.7 ± 0.8 | 3.1 ± 0.4 | 2.9 ± 1.0 | -1.3 ± 1.0 |
| ARC-Easy | 49.2 ± 0.9 | 50.4 ± 1.2 | 47.4 ± 4.5 | 49.4 ± 0.7 | 48.7 ± 1.5 | 44.9 ± 0.7 | 45.0 ± 1.2 | 31.9 ± 0.9 |
| BoolQ | 18.2 ± 4.0 | 19.6 ± 5.1 | 22.1 ± 1.0 | 20.4 ± 3.6 | 18.4 ± 6.0 | 18.4 ± 3.9 | 18.9 ± 2.6 | -3.3 ± 7.1 |
| CB | 12.0 ± 7.2 | 8.5 ± 9.2 | 7.9 ± 10.4 | 19.6 ± 7.3 | 17.8 ± 7.3 | 15.1 ± 5.8 | 17.5 ± 3.5 | 19.5 ± 6.6 |
| COPA | 59.1 ± 5.4 | 57.7 ± 3.5 | 56.7 ± 2.0 | 55.5 ± 2.4 | 56.8 ± 1.8 | 58.9 ± 1.7 | 48.7 ± 3.3 | 34.9 ± 3.4 |
| HellaSwag | 27.8 ± 4.8 | 30.2 ± 0.5 | 29.8 ± 0.9 | 29.9 ± 0.7 | 28.5 ± 1.1 | 29.0 ± 0.5 | 27.0 ± 1.2 | 19.7 ± 0.5 |
| PiQA | 50.6 ± 0.5 | 50.8 ± 0.5 | 48.6 ± 3.4 | 50.9 ± 0.7 | 50.3 ± 1.3 | 49.5 ± 0.4 | 47.6 ± 1.2 | 39.5 ± 1.3 |
| RTE | 5.6 ± 3.1 | 2.6 ± 3.9 | 7.2 ± 2.7 | 7.0 ± 3.2 | 8.8 ± 5.3 | 9.3 ± 3.6 | 3.0 ± 4.3 | 2.6 ± 4.2 |
| SciQ | 84.6 ± 3.9 | 86.1 ± 1.3 | 84.4 ± 3.7 | 85.9 ± 0.7 | 86.2 ± 0.8 | 79.0 ± 0.7 | 81.1 ± 1.4 | 65.3 ± 1.1 |
| StoryCloze 2016 | 61.1 ± 3.7 | 62.6 ± 0.2 | 61.9 ± 2.2 | 62.6 ± 0.4 | 61.8 ± 0.8 | 61.5 ± 0.8 | 60.1 ± 0.7 | 53.9 ± 0.5 |
| WinoGrande XL | 17.0 ± 2.6 | 17.8 ± 1.4 | 16.5 ± 1.8 | 17.1 ± 1.8 | 14.9 ± 1.5 | 15.9 ± 1.2 | 11.8 ± 1.5 | 3.9 ± 0.8 |
| E2E NLG | 18.2 ± 1.2 | 18.8 ± 0.8 | 17.8 ± 1.5 | 16.0 ± 2.2 | 15.9 ± 2.5 | 13.8 ± 1.3 | 15.7 ± 0.9 | 11.2 ± 1.4 |
| XSUM | 2.9 ± 0.2 | 3.0 ± 0.2 | 2.8 ± 0.3 | 2.9 ± 0.2 | 2.9 ± 0.2 | 1.0 ± 0.4 | 2.4 ± 0.1 | 1.8 ± 0.1 |
| WebNLG EN | 4.8 ± 2.0 | 5.7 ± 0.2 | 5.4 ± 0.3 | 5.6 ± 0.2 | 5.4 ± 0.5 | 5.5 ± 0.1 | 5.4 ± 0.2 | 3.4 ± 0.3 |
| WikiLingua EN | 3.3 ± 0.5 | 3.6 ± 0.1 | 3.4 ± 0.1 | 3.4 ± 0.1 | 3.3 ± 0.1 | 1.4 ± 0.6 | 3.0 ± 0.1 | 2.2 ± 0.1 |
| bAbI | 0.0 ± 0.0 | 0.0 ± 0.0 | 0.0 ± 0.0 | 0.0 ± 0.0 | 0.0 ± 0.0 | 0.0 ± 0.0 | 0.0 ± 0.0 | 0.0 ± 0.0 |
| Average | 22.1 ± 1.7 | 22.3 ± 0.9 | 21.9 ± 1.2 | 22.8 ± 0.5 | 22.5 ± 0.6 | 21.6 ± 0.5 | 20.6 ± 0.6 | 15.2 ± 1.0 |
Table 6: Results for 4.2B parameter models trained on repeated data on C4 for 84B total tokens. Scores are normalized averages of 0-5 few-shots and reported as percentages. We report mean/std. err. across five different models, each trained with a different random seed.
| Unique Tokens | 84B | 42B | 28B | 21B | 17B | 12B | 6B | 1.9B |
|---|---|---|---|---|---|---|---|---|
| Epochs | 1 | 2 | 3 | 4 | 5 | 7 | 14 | 44 |
| ANLI R1 | -0.9 ± 0.5 | -0.8 ± 1.1 | -0.9 ± 1.4 | -0.4 ± 0.4 | -0.1 ± 1.2 | 0.3 ± 1.1 | -0.5 ± 0.8 | 1.1 ± 1.3 |
| ANLI R2 | 0.7 ± 0.9 | 0.7 ± 1.1 | 1.3 ± 1.0 | 1.5 ± 1.1 | 1.7 ± 1.3 | 0.9 ± 0.8 | 0.9 ± 1.0 | 1.7 ± 1.3 |
| ANLI R3 | 0.4 ± 0.6 | 0.6 ± 0.4 | 0.7 ± 0.3 | 0.4 ± 0.8 | 0.7 ± 1.2 | 0.6 ± 1.2 | 0.7 ± 0.5 | 0.8 ± 1.2 |
| ARC-Challenge | 1.3 ± 0.5 | 1.8 ± 0.5 | 1.6 ± 0.7 | 2.4 ± 1.1 | 1.6 ± 0.7 | 2.0 ± 0.7 | 1.6 ± 0.5 | -2.1 ± 0.5 |
| ARC-Easy | 45.5 ± 0.8 | 45.1 ± 1.2 | 44.8 ± 0.9 | 44.8 ± 0.6 | 45.0 ± 1.0 | 43.9 ± 0.7 | 40.7 ± 0.7 | 28.0 ± 0.9 |
| BoolQ | 14.5 ± 1.9 | 15.1 ± 4.6 | 10.8 ± 5.1 | 12.5 ± 1.9 | 6.7 ± 4.0 | 10.1 ± 4.2 | -0.0 ± 6.9 | -4.3 ± 7.2 |
| CB | 21.3 ± 2.3 | 19.2 ± 3.8 | 12.9 ± 6.4 | 16.9 ± 3.4 | 15.1 ± 9.4 | 17.8 ± 3.6 | 15.0 ± 8.1 | 11.2 ± 4.1 |
| COPA | 43.1 ± 3.0 | 42.5 ± 3.7 | 44.4 ± 1.1 | 43.0 ± 3.4 | 41.8 ± 2.3 | 44.6 ± 2.7 | 40.3 ± 3.0 | 34.9 ± 4.9 |
| HellaSwag | 21.1 ± 0.2 | 21.0 ± 0.2 | 20.9 ± 0.1 | 20.7 ± 0.2 | 20.5 ± 0.3 | 20.3 ± 0.1 | 19.3 ± 0.1 | 14.5 ± 0.2 |
| PiQA | 45.3 ± 0.9 | 44.8 ± 0.7 | 44.8 ± 0.9 | 44.4 ± 0.6 | 44.3 ± 0.6 | 43.9 ± 0.5 | 42.2 ± 0.9 | 34.0 ± 0.8 |
| RTE | 4.2 ± 2.8 | 1.5 ± 2.4 | -1.1 ± 3.9 | -2.5 ± 3.9 | 5.3 ± 1.8 | 4.4 ± 1.9 | 1.6 ± 2.2 | -1.0 ± 2.4 |
| SciQ | 86.6 ± 0.7 | 86.5 ± 0.5 | 86.0 ± 0.2 | 86.3 ± 1.0 | 85.4 ± 0.8 | 84.7 ± 0.4 | 82.0 ± 1.4 | 62.9 ± 2.5 |
| StoryCloze 2016 | 56.5 ± 0.6 | 56.8 ± 0.6 | 56.5 ± 0.7 | 55.8 ± 0.3 | 55.9 ± 0.2 | 56.0 ± 0.3 | 54.5 ± 0.7 | 49.3 ± 0.2 |
| WinoGrande XL | 9.7 ± 1.4 | 9.0 ± 1.8 | 9.5 ± 0.7 | 8.9 ± 1.0 | 7.8 ± 1.2 | 7.4 ± 1.4 | 6.8 ± 1.4 | 2.1 ± 1.0 |
| E2E NLG | 21.4 ± 1.3 | 21.9 ± 0.4 | 21.2 ± 1.0 | 21.8 ± 0.6 | 21.0 ± 0.9 | 20.5 ± 0.7 | 20.9 ± 1.0 | 16.0 ± 0.6 |
| XSUM | 3.6 ± 0.2 | 3.5 ± 0.2 | 3.5 ± 0.2 | 3.5 ± 0.2 | 3.5 ± 0.3 | 3.2 ± 0.5 | 3.0 ± 0.2 | 1.9 ± 0.1 |
| WebNLG EN | 9.9 ± 0.4 | 9.7 ± 0.8 | 9.3 ± 0.6 | 9.7 ± 0.5 | 9.3 ± 0.7 | 9.4 ± 0.3 | 8.9 ± 0.5 | 3.8 ± 0.4 |
| WikiLingua EN | 3.9 ± 0.1 | 3.8 ± 0.2 | 3.6 ± 0.3 | 3.7 ± 0.2 | 3.6 ± 0.2 | 3.7 ± 0.1 | 3.3 ± 0.2 | 2.1 ± 0.2 |
| bAbI | 15.0 ± 7.5 | 19.0 ± 1.2 | 18.8 ± 1.4 | 18.5 ± 1.4 | 19.2 ± 0.6 | 18.1 ± 1.4 | 14.5 ± 1.5 | 9.6 ± 1.7 |
| Average | 21.2 ± 0.2 | 21.1 ± 0.4 | 20.4 ± 0.3 | 20.6 ± 0.5 | 20.4 ± 0.5 | 20.6 ± 0.2 | 18.7 ± 0.5 | 14.0 ± 0.6 |
Table 7: Results for 4.2B parameter models trained on repeated data on OSCAR for 84B total tokens. Scores are normalized averages of 0-5 few-shots and reported as percentages. We report mean/std. err. across five different models, each trained with a different random seed.
| 唯一 Token | 84B | 42B | 28B | 21B | 17B | 12B | 6B | 1.9B |
|---|---|---|---|---|---|---|---|---|
| Epochs | 1 | 2 | 3 | 4 | 5 | 7 | 14 | 44 |
| ANLI R1 | -0.9 ± 0.5 | -0.8 ± 1.1 | -0.9 ± 1.4 | -0.4 ± 0.4 | -0.1 ± 1.2 | 0.3 ± 1.1 | -0.5 ± 0.8 | 1.1 ± 1.3 |
| ANLI R2 | 0.7 ± 0.9 | 0.7 ± 1.1 | 1.3 ± 1.0 | 1.5 ± 1.1 | 1.7 ± 1.3 | 0.9 ± 0.8 | 0.9 ± 1.0 | 1.7 ± 1.3 |
| ANLI R3 | 0.4 ± 0.6 | 0.6 ± 0.4 | 0.7 ± 0.3 | 0.4 ± 0.8 | 0.7 ± 1.2 | 0.6 ± 1.2 | 0.7 ± 0.5 | 0.8 ± 1.2 |
| ARC-Challenge | 1.3 ± 0.5 | 1.8 ± 0.5 | 1.6 ± 0.7 | 2.4 ± 1.1 | 1.6 ± 0.7 | 2.0 ± 0.7 | 1.6 ± 0.5 | -2.1 ± 0.5 |
| ARC-Easy | 45.5 ± 0.8 | 45.1 ± 1.2 | 44.8 ± 0.9 | 44.8 ± 0.6 | 45.0 ± 1.0 | 43.9 ± 0.7 | 40.7 ± 0.7 | 28.0 ± 0.9 |
| BoolQ | 14.5 ± 1.9 | 15.1 ± 4.6 | 10.8 ± 5.1 | 12.5 ± 1.9 | 6.7 ± 4.0 | 10.1 ± 4.2 | -0.0 ± 6.9 | -4.3 ± 7.2 |
| CB | 21.3 ± 2.3 | 19.2 ± 3.8 | 12.9 ± 6.4 | 16.9 ± 3.4 | 15.1 ± 9.4 | 17.8 ± 3.6 | 15.0 ± 8.1 | 11.2 ± 4.1 |
| COPA | 43.1 ± 3.0 | 42.5 ± 3.7 | 44.4 ± 1.1 | 43.0 ± 3.4 | 41.8 ± 2.3 | 44.6 ± 2.7 | 40.3 ± 3.0 | 34.9 ± 4.9 |
| HellaSwag | 21.1 ± 0.2 | 21.0 ± 0.2 | 20.9 ± 0.1 | 20.7 ± 0.2 | 20.5 ± 0.3 | 20.3 ± 0.1 | 19.3 ± 0.1 | 14.5 ± 0.2 |
| PiQA | 45.3 ± 0.9 | 44.8 ± 0.7 | 44.8 ± 0.9 | 44.4 ± 0.6 | 44.3 ± 0.6 | 43.9 ± 0.5 | 42.2 ± 0.9 | 34.0 ± 0.8 |
| RTE | 4.2 ± 2.8 | 1.5 ± 2.4 | -1.1 ± 3.9 | -2.5 ± 3.9 | 5.3 ± 1.8 | 4.4 ± 1.9 | 1.6 ± 2.2 | -1.0 ± 2.4 |
| SciQ | 86.6 ± 0.7 | 86.5 ± 0.5 | 86.0 ± 0.2 | 86.3 ± 1.0 | 85.4 ± 0.8 | 84.7 ± 0.4 | 82.0 ± 1.4 | 62.9 ± 2.5 |
| StoryCloze 2016 | 56.5 ± 0.6 | 56.8 ± 0.6 | 56.5 ± 0.7 | 55.8 ± 0.3 | 55.9 ± 0.2 | 56.0 ± 0.3 | 54.5 ± 0.7 | 49.3 ± 0.2 |
| WinoGrande XL | 9.7 ± 1.4 | 9.0 ± 1.8 | 9.5 ± 0.7 | 8.9 ± 1.0 | 7.8 ± 1.2 | 7.4 ± 1.4 | 6.8 ± 1.4 | 2.1 ± 1.0 |
| E2E NLG | 21.4 ± 1.3 | 21.9 ± 0.4 | 21.2 ± 1.0 | 21.8 ± 0.6 | 21.0 ± 0.9 | 20.5 ± 0.7 | 20.9 ± 1.0 | 16.0 ± 0.6 |
| XSUM | 3.6 ± 0.2 | 3.5 ± 0.2 | 3.5 ± 0.2 | 3.5 ± 0.2 | 3.5 ± 0.3 | 3.2 ± 0.5 | 3.0 ± 0.2 | 1.9 ± 0.1 |
| WebNLG EN | 9.9 ± 0.4 | 9.7 ± 0.8 | 9.3 ± 0.6 | 9.7 ± 0.5 | 9.3 ± 0.7 | 9.4 ± 0.3 | 8.9 ± 0.5 | 3.8 ± 0.4 |
| WikiLingua EN | 3.9 ± 0.1 | 3.8 ± 0.2 | 3.6 ± 0.3 | 3.7 ± 0.2 | 3.6 ± 0.2 | 3.7 ± 0.1 | 3.3 ± 0.2 | 2.1 ± 0.2 |
| bAbI | 15.0 ± 7.5 | 19.0 ± 1.2 | 18.8 ± 1.4 | 18.5 ± 1.4 | 19.2 ± 0.6 | 18.1 ± 1.4 | 14.5 ± 1.5 | 9.6 ± 1.7 |
| Average | 21.2 ± 0.2 | 21.1 ± 0.4 | 20.4 ± 0.3 | 20.6 ± 0.5 | 20.4 ± 0.5 | 20.6 ± 0.2 | 18.7 ± 0.5 | 14.0 ± 0.6 |
Table 7: Results for 4.2B parameter models trained on repeated data on OSCAR for 84B total tokens. Scores are normalized averages of 0-5 few-shots and reported as percentages. We report mean/std. err. across five different models, each trained with a different random seed.
| Parameters | 8.7B | 6.3B | |||||||
|---|---|---|---|---|---|---|---|---|---|
| Unique Tokens | 178B | 88B | 58B | 44B | 35B | 25B | 13B | 4B | 25B |
| Epochs | 1 | 2 | 3 | 4 | 5 | 7 | 14 | 44 | 9.7 |
| ANLI R1 | -0.9 | -1.2 | -4.2 | 0.7 | -1.3 | 0.1 | 1.2 | 2.1 | -0.9 |
| ANLI R2 | -0.4 | -1.2 | -0.2 | 0.2 | -0.4 | -0.1 | 0.4 | 2.2 | 1.0 |
| ANLI R3 | 0.7 | 0.5 | 0.7 | 1.8 | 0.4 | 1.6 | 2.0 | 4.0 | 2.6 |
| ARC-Challenge | 12.2 | 11.9 | 10.5 | 12.2 | 10.6 | 11.8 | 8.3 | 2.2 | 12.7 |
| ARC-Easy | 58.5 | 58.0 | 56.9 | 57.4 | 56.7 | 58.5 | 52.9 | 37.4 | 57.2 |
| BoolQ | 26.1 | 31.8 | 31.3 | 30.3 | 28.8 | 28.5 | 27.9 | 4.1 | 30.6 |
| CB | 7.6 | 12.9 | -15.2 | 17.9 | 14.3 | -22.8 | -12.1 | 17.4 | 6.2 |
| COPA | 68.0 | 64.7 | 62.3 | 66.3 | 63.3 | 70.0 | 57.0 | 45.0 | 66.0 |
| HellaSwag | 37.8 | 37.8 | 37.3 | 37.4 | 37.1 | 37.5 | 36.1 | 27.5 | 38.1 |
| PiQA | 55.9 | 55.6 | 54.7 | 56.5 | 55.8 | 53.9 | 52.4 | 45.7 | 54.3 |
| RTE | 14.1 | 11.4 | 11.0 | 8.7 | 15.9 | -2.6 | -1.8 | -3.2 | 7.7 |
| SciQ | 90.4 | 91.1 | 90.7 | 90.0 | 89.8 | 89.8 | 87.9 | 72.9 | 90.3 |
| StoryCloze 2016 | 68.3 | 67.3 | 67.2 | 67.6 | 67.8 | 66.8 | 66.2 | 58.9 | 68.4 |
| WinoGrande XL | 26.3 | 27.7 | 26.5 | 29.0 | 26.1 | 23.5 | 18.1 | 10.0 | 27.0 |
| E2E NLG | 20.5 | 17.9 | 18.7 | 20.0 | 17.2 | 17.7 | 17.4 | 11.2 | 16.9 |
| XSUM | 3.6 | 3.3 | 3.8 | 3.8 | 3.5 | 3.0 | 3.3 | 2.0 | 3.8 |
| WebNLG EN | 5.3 | 5.8 | 5.9 | 5.6 | 5.8 | 5.2 | 5.7 | 4.9 | 5.3 |
| WikiLingua EN | 4.1 | 4.2 | 4.2 | 4.1 | 4.2 | 4.0 | 3.5 | 2.7 | 4.0 |
| bAbI | 0.0 | 0.0 | 0.0 | 0.0 | 0.0 | 0.0 | 0.0 | 0.0 | 0.0 |
| Average | 26.2 | 26.3 | 24.3 | 26.8 | 26.1 | 23.5 | 22.4 | 18.3 | 25.9 |
Table 8: Results for 8.7B parameter models trained on repeated data on C4 for 178B total tokens and a data-constrained compute-optimal 6.3B model. Scores are normalized averages of 0-5 few-shots and reported as percentages. The two models with 25 billion unique tokens are the ones depicted in Figure 1 (right). The data-constrained compute-optimal variant (6.3 billion parameters) performs better by using fewer parameters and repeating more data.
| 参数 | 8.7B | 6.3B | |||||||
|---|---|---|---|---|---|---|---|---|---|
| 唯一 Token | 178B | 88B | 58B | 44B | 35B | 25B | 13B | 4B | 25B |
| Epochs | 1 | 2 | 3 | 4 | 5 | 7 | 14 | 44 | 9.7 |
| ANLI R1 | -0.9 | -1.2 | -4.2 | 0.7 | -1.3 | 0.1 | 1.2 | 2.1 | -0.9 |
| ANLI R2 | -0.4 | -1.2 | -0.2 | 0.2 | -0.4 | -0.1 | 0.4 | 2.2 | 1.0 |
| ANLI R3 | 0.7 | 0.5 | 0.7 | 1.8 | 0.4 | 1.6 | 2.0 | 4.0 | 2.6 |
| ARC-Challenge | 12.2 | 11.9 | 10.5 | 12.2 | 10.6 | 11.8 | 8.3 | 2.2 | 12.7 |
| ARC-Easy | 58.5 | 58.0 | 56.9 | 57.4 | 56.7 | 58.5 | 52.9 | 37.4 | 57.2 |
| BoolQ | 26.1 | 31.8 | 31.3 | 30.3 | 28.8 | 28.5 | 27.9 | 4.1 | 30.6 |
| CB | 7.6 | 12.9 | -15.2 | 17.9 | 14.3 | -22.8 | -12.1 | 17.4 | 6.2 |
| COPA | 68.0 | 64.7 | 62.3 | 66.3 | 63.3 | 70.0 | 57.0 | 45.0 | 66.0 |
| HellaSwag | 37.8 | 37.8 | 37.3 | 37.4 | 37.1 | 37.5 | 36.1 | 27.5 | 38.1 |
| PiQA | 55.9 | 55.6 | 54.7 | 56.5 | 55.8 | 53.9 | 52.4 | 45.7 | 54.3 |
| RTE | 14.1 | 11.4 | 11.0 | 8.7 | 15.9 | -2.6 | -1.8 | -3.2 | 7.7 |
| SciQ | 90.4 | 91.1 | 90.7 | 90.0 | 89.8 | 89.8 | 87.9 | 72.9 | 90.3 |
| StoryCloze 2016 | 68.3 | 67.3 | 67.2 | 67.6 | 67.8 | 66.8 | 66.2 | 58.9 | 68.4 |
| WinoGrande XL | 26.3 | 27.7 | 26.5 | 29.0 | 26.1 | 23.5 | 18.1 | 10.0 | 27.0 |
| E2E NLG | 20.5 | 17.9 | 18.7 | 20.0 | 17.2 | 17.7 | 17.4 | 11.2 | 16.9 |
| XSUM | 3.6 | 3.3 | 3.8 | 3.8 | 3.5 | 3.0 | 3.3 | 2.0 | 3.8 |
| WebNLG EN | 5.3 | 5.8 | 5.9 | 5.6 | 5.8 | 5.2 | 5.7 | 4.9 | 5.3 |
| WikiLingua EN | 4.1 | 4.2 | 4.2 | 4.1 | 4.2 | 4.0 | 3.5 | 2.7 | 4.0 |
| bAbI | 0.0 | 0.0 | 0.0 | 0.0 | 0.0 | 0.0 | 0.0 | 0.0 | 0.0 |
| Average | 26.2 | 26.3 | 24.3 | 26.8 | 26.1 | 23.5 | 22.4 | 18.3 | 25.9 |
Table 8: Results for 8.7B parameter models trained on repeated data on C4 for 178B total tokens and a data-constrained compute-optimal 6.3B model. Scores are normalized averages of 0-5 few-shots and reported as percentages. The two models with 25 billion unique tokens are the ones depicted in Figure 1 (right). The data-constrained compute-optimal variant (6.3 billion parameters) performs better by using fewer parameters and repeating more data.
| Unique Tokens | 178B | 88B | 58B | 44B | 35B | 25B | 13B | 4B |
|---|---|---|---|---|---|---|---|---|
| Epochs | 1 | 2 | 3 | 4 | 5 | 7 | 14 | 44 |
| ANLI R1 | -1.3 | -2.3 | -0.5 | -1.8 | 0.1 | -0.3 | 2.6 | -0.4 |
| ANLI R2 | 0.8 | 3.2 | -0.2 | -1.3 | 1.0 | 0.2 | 1.5 | 0.5 |
| ANLI R3 | 1.1 | 1.2 | 1.3 | 0.9 | 2.8 | -0.4 | 1.1 | -0.1 |
| ARC-Challenge | 6.9 | 6.7 | 6.9 | 3.8 | 6.6 | 4.8 | 4.0 | -0.9 |
| ARC-Easy | 50.2 | 51.6 | 51.2 | 51.0 | 51.9 | 50.8 | 47.0 | 33.0 |
| BoolQ | 18.4 | 11.7 | 19.4 | 22.4 | 17.5 | 20.8 | 7.6 | 4.1 |
| CB | 11.2 | 13.4 | 16.1 | 19.6 | 21.4 | 25.0 | 9.8 | 20.1 |
| COPA | 46.7 | 53.0 | 52.0 | 53.7 | 51.0 | 53.3 | 48.7 | 41.7 |
| HellaSwag | 27.4 | 27.2 | 26.8 | 26.8 | 27.3 | 26.7 | 25.5 | 19.6 |
| PiQA | 49.2 | 49.3 | 50.1 | 48.7 | 48.1 | 47.2 | 45.6 | 37.0 |
| RTE | -0.5 | 1.1 | 0.2 | 1.2 | 10.2 | 3.2 | -3.0 | -7.8 |
| SciQ | 88.1 | 88.0 | 88.4 | 87.9 | 87.9 | 87.4 | 86.3 | 64.6 |
| StoryCloze 2016 | 61.6 | 61.1 | 60.2 | 60.6 | 61.3 | 59.0 | 58.8 | 52.7 |
| WinoGrande XL | 17.6 | 16.3 | 15.4 | 13.7 | 13.9 | 12.8 | 10.8 | -0.6 |
| E2E NLG | 23.3 | 24.2 | 22.2 | 22.9 | 23.1 | 22.1 | 22.9 | 16.8 |
| XSUM | 4.2 | 3.8 | 3.9 | 3.8 | 4.3 | 4.0 | 3.2 | 2.4 |
| WebNLG EN | 9.9 | 10.1 | 10.0 | 10.5 | 9.5 | 9.9 | 10.7 | 5.2 |
| WikiLingua EN | 4.3 | 4.0 | 4.1 | 3.7 | 4.3 | 4.2 | 4.0 | 2.7 |
| bAbI | 20.4 | 20.6 | 21.7 | 21.4 | 21.1 | 21.3 | 19.4 | 10.7 |
| Average | 23.1 | 23.4 | 23.6 | 23.7 | 24.4 | 23.8 | 21.4 | 15.9 |
Table 9: Results for 8.7B parameter models trained on repeated data on OSCAR for 178B total tokens. Scores are normalized averages of 0-5 few-shots and reported as percentages.
| 唯一 Token | 178B | 88B | 58B | 44B | 35B | 25B | 13B | 4B |
|---|---|---|---|---|---|---|---|---|
| Epochs | 1 | 2 | 3 | 4 | 5 | 7 | 14 | 44 |
| ANLI R1 | -1.3 | -2.3 | -0.5 | -1.8 | 0.1 | -0.3 | 2.6 | -0.4 |
| ANLI R2 | 0.8 | 3.2 | -0.2 | -1.3 | 1.0 | 0.2 | 1.5 | 0.5 |
| ANLI R3 | 1.1 | 1.2 | 1.3 | 0.9 | 2.8 | -0.4 | 1.1 | -0.1 |
| ARC-Challenge | 6.9 | 6.7 | 6.9 | 3.8 | 6.6 | 4.8 | 4.0 | -0.9 |
| ARC-Easy | 50.2 | 51.6 | 51.2 | 51.0 | 51.9 | 50.8 | 47.0 | 33.0 |
| BoolQ | 18.4 | 11.7 | 19.4 | 22.4 | 17.5 | 20.8 | 7.6 | 4.1 |
| CB | 11.2 | 13.4 | 16.1 | 19.6 | 21.4 | 25.0 | 9.8 | 20.1 |
| COPA | 46.7 | 53.0 | 52.0 | 53.7 | 51.0 | 53.3 | 48.7 | 41.7 |
| HellaSwag | 27.4 | 27.2 | 26.8 | 26.8 | 27.3 | 26.7 | 25.5 | 19.6 |
| PiQA | 49.2 | 49.3 | 50.1 | 48.7 | 48.1 | 47.2 | 45.6 | 37.0 |
| RTE | -0.5 | 1.1 | 0.2 | 1.2 | 10.2 | 3.2 | -3.0 | -7.8 |
| SciQ | 88.1 | 88.0 | 88.4 | 87.9 | 87.9 | 87.4 | 86.3 | 64.6 |
| StoryCloze 2016 | 61.6 | 61.1 | 60.2 | 60.6 | 61.3 | 59.0 | 58.8 | 52.7 |
| WinoGrande XL | 17.6 | 16.3 | 15.4 | 13.7 | 13.9 | 12.8 | 10.8 | -0.6 |
| E2E NLG | 23.3 | 24.2 | 22.2 | 22.9 | 23.1 | 22.1 | 22.9 | 16.8 |
| XSUM | 4.2 | 3.8 | 3.9 | 3.8 | 4.3 | 4.0 | 3.2 | 2.4 |
| WebNLG EN | 9.9 | 10.1 | 10.0 | 10.5 | 9.5 | 9.9 | 10.7 | 5.2 |
| WikiLingua EN | 4.3 | 4.0 | 4.1 | 3.7 | 4.3 | 4.2 | 4.0 | 2.7 |
| bAbI | 20.4 | 20.6 | 21.7 | 21.4 | 21.1 | 21.3 | 19.4 | 10.7 |
| Average | 23.1 | 23.4 | 23.6 | 23.7 | 24.4 | 23.8 | 21.4 | 15.9 |
Table 9: Results for 8.7B parameter models trained on repeated data on OSCAR for 178B total tokens. Scores are normalized averages of 0-5 few-shots and reported as percentages.
Appendix M Detailed Code Augmentation Results
附录 M 代码增强详细结果
We report tabular results for replacing part of C4 or OSCAR with code for 4.2 billion parameter and 2.8 billion parameter models in Tables 10-11. We find that training on up to 50% of Python data maintains performance on all natural language tasks while enabling huge performance gains on state-tracking (bAbI) for C4. For OSCAR gains are less clear, which is likely due to OSCAR containing code [83], while code data was explicitly filtered out for C4 [90].
我们报告用代码替换部分 C4 或 OSCAR、在 42 亿与 28 亿参数模型上的表格结果。列对应不同 Python 混合比例;自然语言任务平均分显示:最多约 50% 代码时分数大致持平,更高比例后下降。
| % of Python pre-training data (remainder is C4) | ||||||||||
|---|---|---|---|---|---|---|---|---|---|---|
| Dataset () | 0 | 10 | 20 | 30 | 40 | 50 | 60 | 70 | 80 | 90 |
| ANLI R1 | -1.0 ± 0.3 | -0.7 ± 0.6 | 0.5 ± 0.6 | -0.2 ± 1.1 | -1.5 ± 0.7 | -0.7 ± 1.1 | -1.1 ± 0.9 | -1.2 ± 1.1 | -1.4 ± 0.7 | -1.4 ± 0.6 |
| ANLI R2 | 0.8 ± 0.5 | 0.4 ± 0.8 | 0.3 ± 1.0 | 0.6 ± 0.5 | 0.5 ± 0.6 | 0.3 ± 0.6 | 0.8 ± 0.7 | 0.4 ± 0.5 | 0.1 ± 1.2 | 1.0 ± 0.3 |
| ANLI R3 | 1.1 ± 0.7 | 0.6 ± 0.5 | 0.5 ± 0.6 | 0.2 ± 0.4 | 0.3 ± 0.5 | 0.2 ± 0.5 | 0.3 ± 0.2 | -0.1 ± 0.3 | -0.0 ± 0.2 | -0.1 ± 0.2 |
| ARC-Challenge | 5.3 ± 0.6 | 6.4 ± 1.0 | 5.2 ± 2.4 | 4.3 ± 1.4 | 5.2 ± 0.8 | 5.2 ± 0.5 | 2.6 ± 0.4 | 1.7 ± 0.5 | -0.4 ± 0.4 | -3.0 ± 0.4 |
| ARC-Easy | 49.2 ± 0.9 | 52.4 ± 1.1 | 49.6 ± 3.7 | 48.1 ± 4.1 | 50.1 ± 1.0 | 49.7 ± 0.3 | 48.0 ± 0.5 | 45.6 ± 0.5 | 43.3 ± 0.4 | 37.7 ± 0.7 |
| BoolQ | 18.2 ± 4.0 | 10.5 ± 12.0 | 16.3 ± 5.2 | 17.8 ± 3.3 | 13.4 ± 3.4 | 14.8 ± 2.1 | 12.5 ± 8.9 | 12.1 ± 6.6 | 7.2 ± 6.7 | 10.7 ± 7.3 |
| CB | 12.0 ± 7.2 | 20.3 ± 2.7 | 14.4 ± 7.1 | 16.5 ± 1.2 | 22.3 ± 3.1 | 22.1 ± 4.8 | 19.4 ± 4.8 | 23.8 ± 3.3 | 23.8 ± 4.1 | 23.4 ± 2.4 |
| COPA | 59.1 ± 5.4 | 56.4 ± 4.9 | 46.7 ± 8.7 | 50.2 ± 3.7 | 52.7 ± 2.5 | 50.1 ± 4.5 | 46.5 ± 1.9 | 43.1 ± 4.2 | 39.2 ± 3.7 | 35.9 ± 4.9 |
| HellaSwag | 27.8 ± 4.8 | 29.4 ± 0.4 | 25.7 ± 4.8 | 27.0 ± 1.7 | 26.3 ± 2.4 | 26.3 ± 0.6 | 25.0 ± 0.1 | 22.6 ± 0.1 | 19.5 ± 0.2 | 14.7 ± 0.1 |
| PiQA | 50.6 ± 0.5 | 50.8 ± 0.6 | 48.6 ± 3.0 | 48.2 ± 2.8 | 48.7 ± 0.7 | 48.4 ± 1.0 | 47.1 ± 0.7 | 45.6 ± 0.3 | 43.4 ± 0.9 | 39.0 ± 0.8 |
| RTE | 5.6 ± 3.1 | 7.3 ± 3.4 | 4.4 ± 4.7 | 6.1 ± 2.6 | 9.1 ± 4.0 | 8.1 ± 5.9 | 7.7 ± 5.3 | 4.0 ± 2.1 | 6.2 ± 2.1 | 4.6 ± 2.5 |
| SciQ | 84.6 ± 3.9 | 87.1 ± 0.2 | 84.6 ± 4.8 | 86.9 ± 1.2 | 86.9 ± 1.2 | 87.9 ± 0.9 | 87.6 ± 0.6 | 87.0 ± 0.2 | 86.0 ± 0.2 | 84.5 ± 0.6 |
| StoryCloze 2016 | 61.1 ± 3.7 | 62.0 ± 0.6 | 59.0 ± 4.8 | 60.8 ± 1.5 | 59.9 ± 1.9 | 60.0 ± 0.7 | 59.0 ± 0.4 | 57.2 ± 0.5 | 54.9 ± 0.4 | 51.0 ± 0.3 |
| WinoGrande XL | 17.0 ± 2.6 | 17.4 ± 2.1 | 14.9 ± 4.4 | 15.2 ± 2.0 | 15.7 ± 1.2 | 14.2 ± 1.0 | 13.5 ± 1.3 | 10.7 ± 1.3 | 9.1 ± 0.6 | 5.3 ± 1.3 |
| E2E NLG | 18.2 ± 1.2 | 21.8 ± 1.6 | 15.9 ± 8.6 | 23.3 ± 0.6 | 21.5 ± 3.8 | 23.9 ± 0.6 | 23.7 ± 0.6 | 23.7 ± 0.5 | 24.3 ± 0.7 | 24.0 ± 0.9 |
| XSUM | 2.9 ± 0.2 | 3.2 ± 0.5 | 3.4 ± 0.3 | 3.3 ± 0.3 | 3.6 ± 0.6 | 3.4 ± 0.2 | 3.5 ± 0.2 | 2.9 ± 0.3 | 2.8 ± 0.4 | 2.7 ± 0.2 |
| WebNLG EN | 4.8 ± 2.0 | 9.5 ± 0.7 | 10.2 ± 1.1 | 10.5 ± 0.7 | 10.4 ± 0.8 | 10.4 ± 0.6 | 9.9 ± 0.4 | 10.0 ± 0.5 | 9.3 ± 0.6 | 9.2 ± 0.2 |
| WikiLingua EN | 3.3 ± 0.5 | 4.0 ± 0.1 | 4.0 ± 0.2 | 4.2 ± 0.1 | 4.3 ± 0.3 | 4.2 ± 0.2 | 4.4 ± 0.3 | 4.1 ± 0.2 | 3.9 ± 0.2 | 3.6 ± 0.3 |
| bAbI | 0.0 ± 0.0 | 12.5 ± 6.7 | 13.8 ± 7.2 | 15.8 ± 8.2 | 17.4 ± 9.2 | 23.2 ± 1.2 | 23.4 ± 2.0 | 24.3 ± 1.4 | 23.2 ± 1.0 | 24.6 ± 1.8 |
| Average | 22.1 ± 1.7 | 23.7 ± 0.7 | 22.0 ± 3.0 | 23.1 ± 1.1 | 23.5 ± 1.0 | 23.8 ± 0.5 | 22.8 ± 1.0 | 22.0 ± 0.6 | 20.8 ± 0.5 | 19.3 ± 0.3 |
| Average (no bAbI) | 23.4 ± 1.8 | 24.4 ± 0.7 | 22.5 ± 2.8 | 23.5 ± 0.8 | 23.9 ± 0.9 | 23.8 ± 0.5 | 22.8 ± 1.0 | 21.8 ± 0.6 | 20.6 ± 0.6 | 19.1 ± 0.4 |
Table 10: Results for code-augmentation for 4.2B parameter models. Models trained on a mix of natural language (C4) and Python (The Stack). Scores are normalized averages of 0-5 few-shots and reported as percentages. We report mean/std. err. across five different models, each trained with a different random seed.
| Python 预训练数据占比(其余为 C4) | ||||||||||
|---|---|---|---|---|---|---|---|---|---|---|
| Dataset () | 0 | 10 | 20 | 30 | 40 | 50 | 60 | 70 | 80 | 90 |
| ANLI R1 | -1.0 ± 0.3 | -0.7 ± 0.6 | 0.5 ± 0.6 | -0.2 ± 1.1 | -1.5 ± 0.7 | -0.7 ± 1.1 | -1.1 ± 0.9 | -1.2 ± 1.1 | -1.4 ± 0.7 | -1.4 ± 0.6 |
| ANLI R2 | 0.8 ± 0.5 | 0.4 ± 0.8 | 0.3 ± 1.0 | 0.6 ± 0.5 | 0.5 ± 0.6 | 0.3 ± 0.6 | 0.8 ± 0.7 | 0.4 ± 0.5 | 0.1 ± 1.2 | 1.0 ± 0.3 |
| ANLI R3 | 1.1 ± 0.7 | 0.6 ± 0.5 | 0.5 ± 0.6 | 0.2 ± 0.4 | 0.3 ± 0.5 | 0.2 ± 0.5 | 0.3 ± 0.2 | -0.1 ± 0.3 | -0.0 ± 0.2 | -0.1 ± 0.2 |
| ARC-Challenge | 5.3 ± 0.6 | 6.4 ± 1.0 | 5.2 ± 2.4 | 4.3 ± 1.4 | 5.2 ± 0.8 | 5.2 ± 0.5 | 2.6 ± 0.4 | 1.7 ± 0.5 | -0.4 ± 0.4 | -3.0 ± 0.4 |
| ARC-Easy | 49.2 ± 0.9 | 52.4 ± 1.1 | 49.6 ± 3.7 | 48.1 ± 4.1 | 50.1 ± 1.0 | 49.7 ± 0.3 | 48.0 ± 0.5 | 45.6 ± 0.5 | 43.3 ± 0.4 | 37.7 ± 0.7 |
| BoolQ | 18.2 ± 4.0 | 10.5 ± 12.0 | 16.3 ± 5.2 | 17.8 ± 3.3 | 13.4 ± 3.4 | 14.8 ± 2.1 | 12.5 ± 8.9 | 12.1 ± 6.6 | 7.2 ± 6.7 | 10.7 ± 7.3 |
| CB | 12.0 ± 7.2 | 20.3 ± 2.7 | 14.4 ± 7.1 | 16.5 ± 1.2 | 22.3 ± 3.1 | 22.1 ± 4.8 | 19.4 ± 4.8 | 23.8 ± 3.3 | 23.8 ± 4.1 | 23.4 ± 2.4 |
| COPA | 59.1 ± 5.4 | 56.4 ± 4.9 | 46.7 ± 8.7 | 50.2 ± 3.7 | 52.7 ± 2.5 | 50.1 ± 4.5 | 46.5 ± 1.9 | 43.1 ± 4.2 | 39.2 ± 3.7 | 35.9 ± 4.9 |
| HellaSwag | 27.8 ± 4.8 | 29.4 ± 0.4 | 25.7 ± 4.8 | 27.0 ± 1.7 | 26.3 ± 2.4 | 26.3 ± 0.6 | 25.0 ± 0.1 | 22.6 ± 0.1 | 19.5 ± 0.2 | 14.7 ± 0.1 |
| PiQA | 50.6 ± 0.5 | 50.8 ± 0.6 | 48.6 ± 3.0 | 48.2 ± 2.8 | 48.7 ± 0.7 | 48.4 ± 1.0 | 47.1 ± 0.7 | 45.6 ± 0.3 | 43.4 ± 0.9 | 39.0 ± 0.8 |
| RTE | 5.6 ± 3.1 | 7.3 ± 3.4 | 4.4 ± 4.7 | 6.1 ± 2.6 | 9.1 ± 4.0 | 8.1 ± 5.9 | 7.7 ± 5.3 | 4.0 ± 2.1 | 6.2 ± 2.1 | 4.6 ± 2.5 |
| SciQ | 84.6 ± 3.9 | 87.1 ± 0.2 | 84.6 ± 4.8 | 86.9 ± 1.2 | 86.9 ± 1.2 | 87.9 ± 0.9 | 87.6 ± 0.6 | 87.0 ± 0.2 | 86.0 ± 0.2 | 84.5 ± 0.6 |
| StoryCloze 2016 | 61.1 ± 3.7 | 62.0 ± 0.6 | 59.0 ± 4.8 | 60.8 ± 1.5 | 59.9 ± 1.9 | 60.0 ± 0.7 | 59.0 ± 0.4 | 57.2 ± 0.5 | 54.9 ± 0.4 | 51.0 ± 0.3 |
| WinoGrande XL | 17.0 ± 2.6 | 17.4 ± 2.1 | 14.9 ± 4.4 | 15.2 ± 2.0 | 15.7 ± 1.2 | 14.2 ± 1.0 | 13.5 ± 1.3 | 10.7 ± 1.3 | 9.1 ± 0.6 | 5.3 ± 1.3 |
| E2E NLG | 18.2 ± 1.2 | 21.8 ± 1.6 | 15.9 ± 8.6 | 23.3 ± 0.6 | 21.5 ± 3.8 | 23.9 ± 0.6 | 23.7 ± 0.6 | 23.7 ± 0.5 | 24.3 ± 0.7 | 24.0 ± 0.9 |
| XSUM | 2.9 ± 0.2 | 3.2 ± 0.5 | 3.4 ± 0.3 | 3.3 ± 0.3 | 3.6 ± 0.6 | 3.4 ± 0.2 | 3.5 ± 0.2 | 2.9 ± 0.3 | 2.8 ± 0.4 | 2.7 ± 0.2 |
| WebNLG EN | 4.8 ± 2.0 | 9.5 ± 0.7 | 10.2 ± 1.1 | 10.5 ± 0.7 | 10.4 ± 0.8 | 10.4 ± 0.6 | 9.9 ± 0.4 | 10.0 ± 0.5 | 9.3 ± 0.6 | 9.2 ± 0.2 |
| WikiLingua EN | 3.3 ± 0.5 | 4.0 ± 0.1 | 4.0 ± 0.2 | 4.2 ± 0.1 | 4.3 ± 0.3 | 4.2 ± 0.2 | 4.4 ± 0.3 | 4.1 ± 0.2 | 3.9 ± 0.2 | 3.6 ± 0.3 |
| bAbI | 0.0 ± 0.0 | 12.5 ± 6.7 | 13.8 ± 7.2 | 15.8 ± 8.2 | 17.4 ± 9.2 | 23.2 ± 1.2 | 23.4 ± 2.0 | 24.3 ± 1.4 | 23.2 ± 1.0 | 24.6 ± 1.8 |
| Average | 22.1 ± 1.7 | 23.7 ± 0.7 | 22.0 ± 3.0 | 23.1 ± 1.1 | 23.5 ± 1.0 | 23.8 ± 0.5 | 22.8 ± 1.0 | 22.0 ± 0.6 | 20.8 ± 0.5 | 19.3 ± 0.3 |
| Average (no bAbI) | 23.4 ± 1.8 | 24.4 ± 0.7 | 22.5 ± 2.8 | 23.5 ± 0.8 | 23.9 ± 0.9 | 23.8 ± 0.5 | 22.8 ± 1.0 | 21.8 ± 0.6 | 20.6 ± 0.6 | 19.1 ± 0.4 |
Table 10: Results for code-augmentation for 4.2B parameter models. Models trained on a mix of natural language (C4) and Python (The Stack). Scores are normalized averages of 0-5 few-shots and reported as percentages. We report mean/std. err. across five different models, each trained with a different random seed.
| % of Python pre-training data (rest is C4) | % of Python pre-training data (rest is OSCAR) | |||||||||||
|---|---|---|---|---|---|---|---|---|---|---|---|---|
| Dataset () | 0 | 10 | 20 | 30 | 40 | 50 | 0 | 10 | 20 | 30 | 40 | 50 |
| ANLI R1 | 0.4 ± 1.6 | -1.5 | -0.9 | -1.0 | -0.7 | -2.4 | -0.3 ± 0.5 | 0.0 | -0.6 | -1.6 | -2.4 | -1.7 |
| ANLI R2 | 0.9 ± 0.4 | 0.7 | 0.0 | 0.1 | -0.1 | 0.1 | 1.0 ± 1.0 | 1.2 | -0.1 | -0.0 | 0.0 | 0.8 |
| ANLI R3 | 1.7 ± 0.5 | 0.6 | -0.7 | -0.2 | 0.4 | 0.0 | 0.4 ± 0.8 | -0.4 | -0.2 | -1.7 | -0.8 | -0.5 |
| ARC-Challenge | 1.6 ± 1.0 | 4.2 | 1.7 | 1.5 | 0.2 | -0.2 | -1.4 ± 0.8 | -0.7 | -1.4 | -3.4 | -2.3 | -3.1 |
| ARC-Easy | 44.5 ± 0.5 | 46.4 | 46.5 | 45.4 | 43.6 | 42.7 | 39.7 ± 0.3 | 39.8 | 38.7 | 39.1 | 37.3 | 37.6 |
| BoolQ | 18.8 ± 3.4 | 15.7 | 19.0 | 13.4 | 16.0 | 4.4 | 12.8 ± 4.4 | 3.3 | 12.5 | 10.6 | 5.8 | 8.5 |
| CB | 20.0 ± 4.7 | 22.8 | 10.7 | 20.5 | 17.4 | 15.2 | 19.7 ± 5.1 | 14.7 | 15.6 | 19.6 | 22.8 | 17.0 |
| COPA | 49.7 ± 3.5 | 46.3 | 49.3 | 46.3 | 42.7 | 40.0 | 42.7 ± 2.2 | 42.7 | 41.0 | 42.7 | 35.7 | 38.0 |
| HellaSwag | 24.7 ± 0.3 | 24.1 | 23.3 | 22.3 | 21.9 | 20.9 | 16.3 ± 0.1 | 15.7 | 15.9 | 15.5 | 15.1 | 13.7 |
| PiQA | 47.9 ± 0.6 | 46.9 | 47.7 | 45.1 | 46.2 | 45.5 | 41.2 ± 0.7 | 41.6 | 39.9 | 40.5 | 38.8 | 38.6 |
| RTE | 5.1 ± 4.0 | 8.8 | 7.7 | 5.1 | 7.8 | 10.8 | 3.9 ± 1.1 | 2.2 | 4.3 | 1.1 | 3.7 | -1.7 |
| SciQ | 83.2 ± 0.6 | 83.3 | 85.3 | 84.8 | 83.2 | 83.7 | 83.2 ± 0.6 | 82.4 | 83.5 | 82.8 | 83.3 | 83.2 |
| StoryCloze 2016 | 58.7 ± 0.2 | 59.3 | 57.9 | 56.9 | 56.5 | 56.0 | 52.8 ± 0.3 | 52.0 | 52.2 | 52.0 | 51.8 | 50.9 |
| WinoGrande XL | 11.6 ± 0.8 | 13.0 | 10.7 | 9.3 | 8.2 | 9.6 | 5.8 ± 0.9 | 3.2 | 5.6 | 5.8 | 4.6 | 3.9 |
| E2E NLG | 17.0 ± 1.4 | 19.8 | 21.1 | 20.2 | 22.1 | 21.0 | 20.3 ± 0.3 | 21.9 | 20.7 | 20.5 | 20.7 | 21.1 |
| XSUM | 2.4 ± 0.1 | 2.7 | 2.0 | 2.2 | 2.0 | 2.3 | 3.0 ± 0.1 | 2.8 | 3.1 | 3.4 | 3.1 | 2.9 |
| WebNLG EN | 5.3 ± 0.1 | 9.1 | 8.0 | 8.5 | 8.5 | 9.1 | 8.8 ± 0.4 | 8.7 | 9.6 | 9.1 | 8.7 | 9.4 |
| WikiLingua EN | 3.0 ± 0.1 | 3.2 | 3.2 | 3.6 | 3.3 | 3.7 | 2.9 ± 0.1 | 3.3 | 3.6 | 3.5 | 3.4 | 3.5 |
| bAbI | 0.0 ± 0.0 | 4.6 | 14.2 | 14.2 | 14.8 | 15.1 | 15.5 ± 1.0 | 16.6 | 17.2 | 17.2 | 17.7 | 15.9 |
| Average | 20.9 ± 0.4 | 21.6 | 21.4 | 21.0 | 20.7 | 19.9 | 19.4 ± 0.5 | 18.5 | 19.0 | 18.8 | 18.3 | 17.8 |
| Average (without bAbI) | 22.0 ± 0.5 | 22.5 | 21.8 | 21.3 | 21.1 | 20.1 | 19.6 ± 0.5 | 18.6 | 19.1 | 18.9 | 18.3 | 17.9 |
Table 11: Results for code-augmentation for 2.8B parameter models. Models trained on a mix of natural language (C4) and Python (The Stack). Scores are normalized averages of 0-5 few-shots and reported as percentages. We report mean/std. err. across five different models, each trained with a different random seed.
| Python 预训练占比(其余为 C4) | Python 预训练占比(其余为 OSCAR) | |||||||||||
|---|---|---|---|---|---|---|---|---|---|---|---|---|
| Dataset () | 0 | 10 | 20 | 30 | 40 | 50 | 0 | 10 | 20 | 30 | 40 | 50 |
| ANLI R1 | 0.4 ± 1.6 | -1.5 | -0.9 | -1.0 | -0.7 | -2.4 | -0.3 ± 0.5 | 0.0 | -0.6 | -1.6 | -2.4 | -1.7 |
| ANLI R2 | 0.9 ± 0.4 | 0.7 | 0.0 | 0.1 | -0.1 | 0.1 | 1.0 ± 1.0 | 1.2 | -0.1 | -0.0 | 0.0 | 0.8 |
| ANLI R3 | 1.7 ± 0.5 | 0.6 | -0.7 | -0.2 | 0.4 | 0.0 | 0.4 ± 0.8 | -0.4 | -0.2 | -1.7 | -0.8 | -0.5 |
| ARC-Challenge | 1.6 ± 1.0 | 4.2 | 1.7 | 1.5 | 0.2 | -0.2 | -1.4 ± 0.8 | -0.7 | -1.4 | -3.4 | -2.3 | -3.1 |
| ARC-Easy | 44.5 ± 0.5 | 46.4 | 46.5 | 45.4 | 43.6 | 42.7 | 39.7 ± 0.3 | 39.8 | 38.7 | 39.1 | 37.3 | 37.6 |
| BoolQ | 18.8 ± 3.4 | 15.7 | 19.0 | 13.4 | 16.0 | 4.4 | 12.8 ± 4.4 | 3.3 | 12.5 | 10.6 | 5.8 | 8.5 |
| CB | 20.0 ± 4.7 | 22.8 | 10.7 | 20.5 | 17.4 | 15.2 | 19.7 ± 5.1 | 14.7 | 15.6 | 19.6 | 22.8 | 17.0 |
| COPA | 49.7 ± 3.5 | 46.3 | 49.3 | 46.3 | 42.7 | 40.0 | 42.7 ± 2.2 | 42.7 | 41.0 | 42.7 | 35.7 | 38.0 |
| HellaSwag | 24.7 ± 0.3 | 24.1 | 23.3 | 22.3 | 21.9 | 20.9 | 16.3 ± 0.1 | 15.7 | 15.9 | 15.5 | 15.1 | 13.7 |
| PiQA | 47.9 ± 0.6 | 46.9 | 47.7 | 45.1 | 46.2 | 45.5 | 41.2 ± 0.7 | 41.6 | 39.9 | 40.5 | 38.8 | 38.6 |
| RTE | 5.1 ± 4.0 | 8.8 | 7.7 | 5.1 | 7.8 | 10.8 | 3.9 ± 1.1 | 2.2 | 4.3 | 1.1 | 3.7 | -1.7 |
| SciQ | 83.2 ± 0.6 | 83.3 | 85.3 | 84.8 | 83.2 | 83.7 | 83.2 ± 0.6 | 82.4 | 83.5 | 82.8 | 83.3 | 83.2 |
| StoryCloze 2016 | 58.7 ± 0.2 | 59.3 | 57.9 | 56.9 | 56.5 | 56.0 | 52.8 ± 0.3 | 52.0 | 52.2 | 52.0 | 51.8 | 50.9 |
| WinoGrande XL | 11.6 ± 0.8 | 13.0 | 10.7 | 9.3 | 8.2 | 9.6 | 5.8 ± 0.9 | 3.2 | 5.6 | 5.8 | 4.6 | 3.9 |
| E2E NLG | 17.0 ± 1.4 | 19.8 | 21.1 | 20.2 | 22.1 | 21.0 | 20.3 ± 0.3 | 21.9 | 20.7 | 20.5 | 20.7 | 21.1 |
| XSUM | 2.4 ± 0.1 | 2.7 | 2.0 | 2.2 | 2.0 | 2.3 | 3.0 ± 0.1 | 2.8 | 3.1 | 3.4 | 3.1 | 2.9 |
| WebNLG EN | 5.3 ± 0.1 | 9.1 | 8.0 | 8.5 | 8.5 | 9.1 | 8.8 ± 0.4 | 8.7 | 9.6 | 9.1 | 8.7 | 9.4 |
| WikiLingua EN | 3.0 ± 0.1 | 3.2 | 3.2 | 3.6 | 3.3 | 3.7 | 2.9 ± 0.1 | 3.3 | 3.6 | 3.5 | 3.4 | 3.5 |
| bAbI | 0.0 ± 0.0 | 4.6 | 14.2 | 14.2 | 14.8 | 15.1 | 15.5 ± 1.0 | 16.6 | 17.2 | 17.2 | 17.7 | 15.9 |
| Average | 20.9 ± 0.4 | 21.6 | 21.4 | 21.0 | 20.7 | 19.9 | 19.4 ± 0.5 | 18.5 | 19.0 | 18.8 | 18.3 | 17.8 |
| Average (without bAbI) | 22.0 ± 0.5 | 22.5 | 21.8 | 21.3 | 21.1 | 20.1 | 19.6 ± 0.5 | 18.6 | 19.1 | 18.9 | 18.3 | 17.9 |
Table 11: Results for code-augmentation for 2.8B parameter models. Models trained on a mix of natural language (C4) and Python (The Stack). Scores are normalized averages of 0-5 few-shots and reported as percentages. We report mean/std. err. across five different models, each trained with a different random seed.
Appendix N Filtering Procedure
附录 N 过滤流程
Perplexity filtering
We follow the approach of [54] to perform perplexity filtering and reuse their artifacts - a SentencePiece tokenizer [52] and a KenLM 5-gram language model [37] trained on Wikipedia introductions and available to download from their repository.[^4] We compute the model’s perplexity on all OSCAR and C4 samples and only select samples that fall within a certain percentile threshold. For example, to select the top 25%, we only select samples with perplexity lower than the 25th percentile. Figure 18 provides a visual representation of perplexity distribution for respective datasets, highlighting the relevant percentile thresholds.
困惑度过滤
我们遵循 [54] 的做法做困惑度过滤,并复用其产物——在 Wikipedia 上训练的 SentencePiece 模型与 KenLM。按该模型困惑度对文档排序,保留最低困惑度的前 25%(或按实验所述比例)。
Deduplication
We perform deduplication leveraging the suffix array-based approach proposed by Lee et al. 2021. We remove any document with at least a 100-character span overlapping with any other document in the corpus. We deduplicate the full C4 dataset. In the case of OSCAR, the memory requirements of the deduplication procedure make performing the full dataset deduplication infeasible. Instead, we select a 25% subset of the full OSCAR and build a suffix array for this subset. We experiment with leveraging the 25% OSCAR suffix array in two ways. First, we deduplicate the selected subset. This is very strict and preserves less than 5% of the full OSCAR. Subsequently, we use the 25% suffix array to deduplicate the full OSCAR, i.e. we remove any document which has at least a 100-character span overlapping with the 25% subset we selected. This is more permissive and allows us to preserve 31% of the original dataset. We refer to the latter as expanded in Table 12 and it is used for the training of the 4.2 billion parameter model in Table 14, while the smaller deduplicated version of OSCAR is used for the 2.8 billion parameter model.
去重
我们采用 Lee et al. 2021 提出的基于后缀数组的方法去重。去掉存在至少 100 个连续字符重叠的文档。该过程显著缩小语料(例如 C4 子集可从约 840 亿 token 量级降到约 210 亿),因而训练中需要更多 epoch 才能吃满同一总 token 预算。
ROOTS filter
In addition, we benchmark with the filtering procedure from the ROOTS corpus [54]. It applies the following set of filters:
ROOTS 过滤
此外,我们用 ROOTS 语料 [54] 的过滤流程做基准。它应用如下过滤集合:
- • Discarding documents with too few words
- • 丢弃词数过少的文档
- • Discarding documents with overly repeated character- and word-n-grams
- • 丢弃字符级与词级 n-gram 过度重复的文档
- • Discarding documents with too many special characters
- • 丢弃特殊字符过多的文档
- • Discarding documents with too few grammatical function words (e.g. “of”, “and”)
- • 丢弃语法功能词(如 “of”“and”)过少的文档
- • Discarding documents with too many flagged words
- • 丢弃被标记词过多的文档
- • Discarding documents with a low fasttext language identification score
- • 丢弃 fasttext 语言识别分数过低的文档
- • Perplexity filtering
- • 困惑度过滤
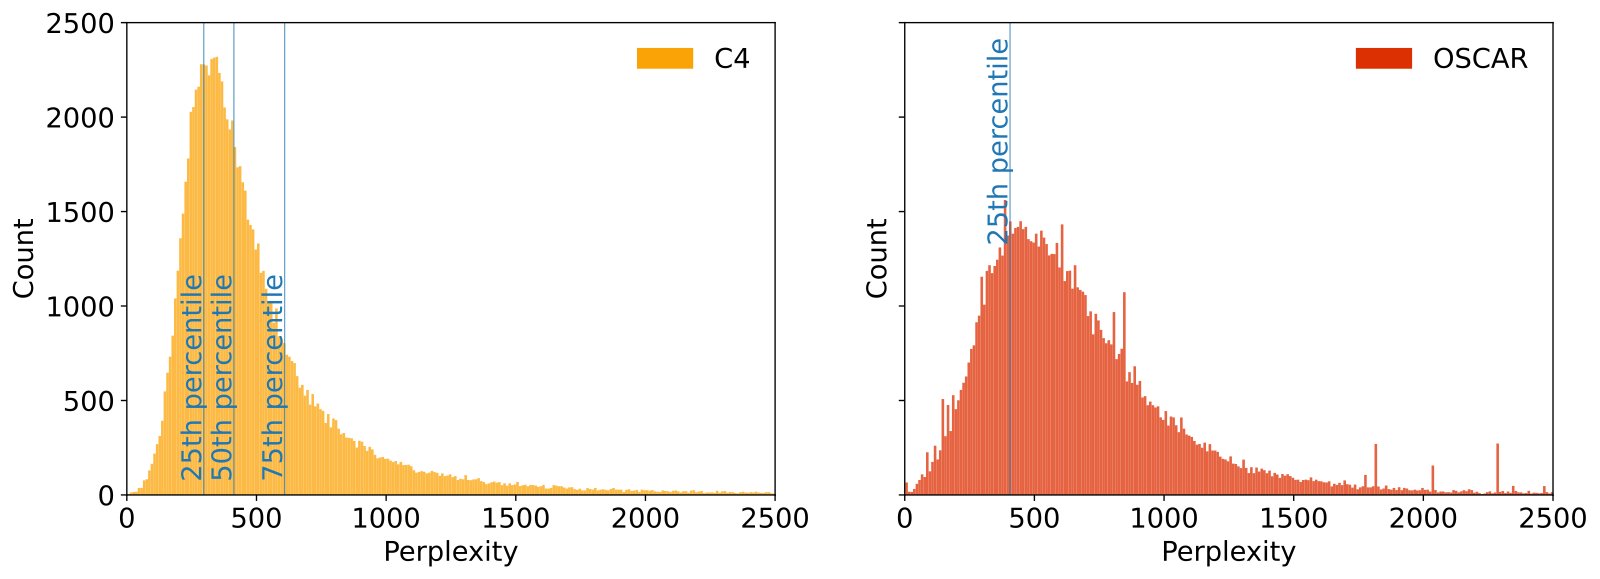
Figure 18: Perplexity histograms for respective datasets. For demonstration purposes, we use 100,000 random samples of each dataset.
图 18:各数据集的困惑度直方图。为演示,每个数据集使用 100,000 个随机样本。
| Base Dataset | Filter | Tokens after filtering |
|---|---|---|
| C4 | Deduplication | 21 billion |
| C4 | Perplexity Top 25% | 44 billion |
| C4 | Perplexity Top 50% | 89 billion |
| C4 | Perplexity 25-75% | 89 billion |
| OSCAR | Deduplication | 9 billion |
| OSCAR | Deduplication-expanded | 94 billion |
| OSCAR | Perplexity Top 25% | 80 billion |
| OSCAR | ROOTS | 99 billion |
Table 12: Sizes of filtered datasets.
| 基础数据集 | 过滤 | 过滤后 Token |
|---|---|---|
| C4 | 去重 | 21 billion |
| C4 | 困惑度 Top 25% | 44 billion |
| C4 | 困惑度 Top 50% | 89 billion |
| C4 | 困惑度 25-75% | 89 billion |
| OSCAR | 去重 | 9 billion |
| OSCAR | 去重-expanded | 94 billion |
| OSCAR | 困惑度 Top 25% | 80 billion |
| OSCAR | ROOTS | 99 billion |
Table 12: Sizes of filtered datasets.
Appendix O Detailed Filtering Results
附录 O 过滤详细结果
In Table 13, we report detailed perplexity filtering results on C4 and OSCAR. For C4, perplexity filtering is only effective at 4.2B parameters. Meanwhile, for OSCAR, which is noisier than C4, perplexity filtering seems effective both for 2.8B and 4.2B parameters. Table 14 contains deduplication results and results for the ROOTS filter. Deduplication does not improve downstream performance for C4 while being effective for OSCAR which has significantly more noise. Applying the ROOTS filter on OSCAR is not better than the unfiltered OSCAR on our benchmark, but might have other beneficial effects, such as reducing obscenity, templated messages, or repetition, depending on the final use case.
表 13 报告 C4 与 OSCAR 上困惑度过滤的详细结果。对 C4,困惑度过滤仅在与重复策略比较时略有效;对更嘈杂的 OSCAR,过滤带来更明显的下游改进。这支持主文建议:把过滤主要用于嘈杂数据,干净数据上优先考虑重复与代码增强。
| Training Data | C4 | OSCAR | |||||||||
|---|---|---|---|---|---|---|---|---|---|---|---|
| Parameters | 2.8B | 4.2B | 2.8B | 4.2B | |||||||
| Percentile | All | 25% | 50% | All | 25% | 50% | 25-75% | All | 25% | All | 25% |
| ANLI R1 | 0.4 ± 1.6 | -0.1 | 0.9 | -0.5 ± 1.4 | -0.0 | -0.7 | -0.8 | -0.3 ± 0.5 | -0.4 | -0.4 ± 1.2 | -2.2 |
| ANLI R2 | 0.9 ± 0.4 | -0.2 | -0.7 | 0.0 ± 1.3 | -0.4 | -0.0 | 1.1 | 1.0 ± 1.0 | 1.7 | 1.0 ± 0.9 | 0.7 |
| ANLI R3 | 1.7 ± 0.5 | 0.5 | 1.4 | 0.7 ± 0.5 | 0.7 | 2.9 | 0.4 | 0.4 ± 0.8 | 1.7 | 1.2 ± 0.5 | 2.1 |
| ARC-Challenge | 1.6 ± 1.0 | 3.3 | 2.9 | 4.2 ± 1.6 | 10.2 | 9.3 | 7.9 | -1.4 ± 0.8 | 3.3 | 1.8 ± 0.8 | 6.3 |
| ARC-Easy | 44.5 ± 0.5 | 47.3 | 47.7 | 48.1 ± 4.8 | 55.8 | 53.7 | 51.0 | 39.7 ± 0.3 | 46.8 | 45.7 ± 0.6 | 51.8 |
| BoolQ | 18.8 ± 3.4 | 17.1 | 17.7 | 22.4 ± 3.3 | 27.7 | 23.5 | 24.5 | 12.8 ± 4.4 | 11.8 | 12.4 ± 5.9 | 22.2 |
| CB | 20.0 ± 4.7 | 16.1 | 13.8 | 9.3 ± 16.6 | 24.6 | 22.3 | 12.5 | 19.7 ± 5.1 | 17.0 | 23.9 ± 3.8 | 20.1 |
| COPA | 49.7 ± 3.5 | 55.7 | 56.0 | 55.3 ± 3.8 | 60.7 | 66.0 | 61.0 | 42.7 ± 2.2 | 44.0 | 41.1 ± 3.0 | 49.3 |
| HellaSwag | 24.7 ± 0.3 | 24.7 | 26.0 | 29.4 ± 1.3 | 30.7 | 32.7 | 33.1 | 16.3 ± 0.1 | 19.0 | 21.0 ± 0.2 | 23.3 |
| PiQA | 47.9 ± 0.6 | 43.4 | 45.8 | 48.8 ± 3.8 | 47.9 | 52.2 | 52.1 | 41.2 ± 0.7 | 38.3 | 45.0 ± 0.6 | 44.4 |
| RTE | 5.1 ± 4.0 | 5.7 | 7.3 | 6.9 ± 3.1 | 11.9 | 2.2 | 10.3 | 3.9 ± 1.1 | -1.2 | 2.2 ± 4.3 | 7.0 |
| SciQ | 83.2 ± 0.6 | 82.4 | 82.8 | 86.3 ± 1.1 | 88.6 | 87.4 | 88.4 | 83.2 ± 0.6 | 84.0 | 86.3 ± 0.6 | 86.5 |
| StoryCloze 2016 | 58.7 ± 0.2 | 61.1 | 61.2 | 62.8 ± 0.5 | 65.5 | 65.6 | 65.1 | 52.8 ± 0.3 | 57.9 | 57.2 ± 0.6 | 60.2 |
| WinoGrande XL | 11.6 ± 0.8 | 15.3 | 14.3 | 18.7 ± 1.0 | 24.9 | 22.3 | 18.7 | 5.8 ± 0.9 | 9.7 | 10.1 ± 1.0 | 14.8 |
| E2E NLG | 17.0 ± 1.4 | 16.1 | 16.8 | 17.9 ± 0.7 | 18.8 | 17.8 | 19.2 | 20.3 ± 0.3 | 19.5 | 21.6 ± 0.7 | 22.6 |
| XSUM | 2.4 ± 0.1 | 2.6 | 3.0 | 3.0 ± 0.3 | 3.9 | 3.2 | 3.0 | 3.0 ± 0.1 | 3.2 | 3.7 ± 0.2 | 2.7 |
| WebNLG EN | 5.3 ± 0.1 | 4.8 | 5.1 | 5.6 ± 0.3 | 5.4 | 5.7 | 5.2 | 8.8 ± 0.4 | 6.9 | 9.3 ± 0.5 | 10.6 |
| WikiLingua EN | 3.0 ± 0.1 | 3.2 | 3.3 | 3.6 ± 0.2 | 3.4 | 3.5 | 3.4 | 2.9 ± 0.1 | 3.4 | 4.0 ± 0.1 | 3.8 |
| bAbI | 0.0 ± 0.0 | 0.0 | 0.0 | 0.0 ± 0.0 | 0.0 | 0.0 | 0.0 | 15.5 ± 1.0 | 14.5 | 19.3 ± 1.0 | 17.2 |
| Average | 20.9 ± 0.4 | 21.0 | 21.3 | 22.2 ± 1.4 | 25.3 | 24.7 | 24.0 | 19.4 ± 0.5 | 20.1 | 21.4 ± 0.5 | 23.3 |
Table 13: Results for perplexity-filtering. The training data is perplexity filtered according to the given percentile, e.g. 25% corresponds to the top 25% percent of examples with the lowest perplexity. The resulting dataset sizes are in Table 12. The data is repeated until it matches 55B tokens for 2.8B parameter and 84B tokens for 4.2B parameter models. Scores are normalized averages of 0-5 few-shots and reported as percentages. For unfiltered models we report mean/std. err. across five different models, each trained with a different random seed.
| 训练数据 | C4 | OSCAR | |||||||||
|---|---|---|---|---|---|---|---|---|---|---|---|
| 参数 | 2.8B | 4.2B | 2.8B | 4.2B | |||||||
| Percentile | All | 25% | 50% | All | 25% | 50% | 25-75% | All | 25% | All | 25% |
| ANLI R1 | 0.4 ± 1.6 | -0.1 | 0.9 | -0.5 ± 1.4 | -0.0 | -0.7 | -0.8 | -0.3 ± 0.5 | -0.4 | -0.4 ± 1.2 | -2.2 |
| ANLI R2 | 0.9 ± 0.4 | -0.2 | -0.7 | 0.0 ± 1.3 | -0.4 | -0.0 | 1.1 | 1.0 ± 1.0 | 1.7 | 1.0 ± 0.9 | 0.7 |
| ANLI R3 | 1.7 ± 0.5 | 0.5 | 1.4 | 0.7 ± 0.5 | 0.7 | 2.9 | 0.4 | 0.4 ± 0.8 | 1.7 | 1.2 ± 0.5 | 2.1 |
| ARC-Challenge | 1.6 ± 1.0 | 3.3 | 2.9 | 4.2 ± 1.6 | 10.2 | 9.3 | 7.9 | -1.4 ± 0.8 | 3.3 | 1.8 ± 0.8 | 6.3 |
| ARC-Easy | 44.5 ± 0.5 | 47.3 | 47.7 | 48.1 ± 4.8 | 55.8 | 53.7 | 51.0 | 39.7 ± 0.3 | 46.8 | 45.7 ± 0.6 | 51.8 |
| BoolQ | 18.8 ± 3.4 | 17.1 | 17.7 | 22.4 ± 3.3 | 27.7 | 23.5 | 24.5 | 12.8 ± 4.4 | 11.8 | 12.4 ± 5.9 | 22.2 |
| CB | 20.0 ± 4.7 | 16.1 | 13.8 | 9.3 ± 16.6 | 24.6 | 22.3 | 12.5 | 19.7 ± 5.1 | 17.0 | 23.9 ± 3.8 | 20.1 |
| COPA | 49.7 ± 3.5 | 55.7 | 56.0 | 55.3 ± 3.8 | 60.7 | 66.0 | 61.0 | 42.7 ± 2.2 | 44.0 | 41.1 ± 3.0 | 49.3 |
| HellaSwag | 24.7 ± 0.3 | 24.7 | 26.0 | 29.4 ± 1.3 | 30.7 | 32.7 | 33.1 | 16.3 ± 0.1 | 19.0 | 21.0 ± 0.2 | 23.3 |
| PiQA | 47.9 ± 0.6 | 43.4 | 45.8 | 48.8 ± 3.8 | 47.9 | 52.2 | 52.1 | 41.2 ± 0.7 | 38.3 | 45.0 ± 0.6 | 44.4 |
| RTE | 5.1 ± 4.0 | 5.7 | 7.3 | 6.9 ± 3.1 | 11.9 | 2.2 | 10.3 | 3.9 ± 1.1 | -1.2 | 2.2 ± 4.3 | 7.0 |
| SciQ | 83.2 ± 0.6 | 82.4 | 82.8 | 86.3 ± 1.1 | 88.6 | 87.4 | 88.4 | 83.2 ± 0.6 | 84.0 | 86.3 ± 0.6 | 86.5 |
| StoryCloze 2016 | 58.7 ± 0.2 | 61.1 | 61.2 | 62.8 ± 0.5 | 65.5 | 65.6 | 65.1 | 52.8 ± 0.3 | 57.9 | 57.2 ± 0.6 | 60.2 |
| WinoGrande XL | 11.6 ± 0.8 | 15.3 | 14.3 | 18.7 ± 1.0 | 24.9 | 22.3 | 18.7 | 5.8 ± 0.9 | 9.7 | 10.1 ± 1.0 | 14.8 |
| E2E NLG | 17.0 ± 1.4 | 16.1 | 16.8 | 17.9 ± 0.7 | 18.8 | 17.8 | 19.2 | 20.3 ± 0.3 | 19.5 | 21.6 ± 0.7 | 22.6 |
| XSUM | 2.4 ± 0.1 | 2.6 | 3.0 | 3.0 ± 0.3 | 3.9 | 3.2 | 3.0 | 3.0 ± 0.1 | 3.2 | 3.7 ± 0.2 | 2.7 |
| WebNLG EN | 5.3 ± 0.1 | 4.8 | 5.1 | 5.6 ± 0.3 | 5.4 | 5.7 | 5.2 | 8.8 ± 0.4 | 6.9 | 9.3 ± 0.5 | 10.6 |
| WikiLingua EN | 3.0 ± 0.1 | 3.2 | 3.3 | 3.6 ± 0.2 | 3.4 | 3.5 | 3.4 | 2.9 ± 0.1 | 3.4 | 4.0 ± 0.1 | 3.8 |
| bAbI | 0.0 ± 0.0 | 0.0 | 0.0 | 0.0 ± 0.0 | 0.0 | 0.0 | 0.0 | 15.5 ± 1.0 | 14.5 | 19.3 ± 1.0 | 17.2 |
| Average | 20.9 ± 0.4 | 21.0 | 21.3 | 22.2 ± 1.4 | 25.3 | 24.7 | 24.0 | 19.4 ± 0.5 | 20.1 | 21.4 ± 0.5 | 23.3 |
Table 13: Results for perplexity-filtering. The training data is perplexity filtered according to the given percentile, e.g. 25% corresponds to the top 25% percent of examples with the lowest perplexity. The resulting dataset sizes are in Table 12. The data is repeated until it matches 55B tokens for 2.8B parameter and 84B tokens for 4.2B parameter models. Scores are normalized averages of 0-5 few-shots and reported as percentages. For unfiltered models we report mean/std. err. across five different models, each trained with a different random seed.
| Training Data | C4 | OSCAR | ||||||||
|---|---|---|---|---|---|---|---|---|---|---|
| Parameters | 2.8B parameters | 4.2B parameters | 2.8B parameters | 4.2B parameters | ||||||
| Method | All | Dedup. | All | Dedup. | All | Dedup. | ROOTS | All | Dedup.-exp. | ROOTS |
| ANLI R1 | 0.4 ± 1.6 | -0.2 | -0.5 ± 1.4 | -0.8 | -0.3 ± 0.5 | -2.1 | -1.7 | -0.4 ± 1.2 | -1.8 | 1.2 |
| ANLI R2 | 0.9 ± 0.4 | 1.1 | 0.0 ± 1.3 | -0.1 | 1.0 ± 1.0 | 2.0 | 0.7 | 1.0 ± 0.9 | -0.5 | -0.3 |
| ANLI R3 | 1.7 ± 0.5 | 1.8 | 0.7 ± 0.5 | 0.4 | 0.4 ± 0.8 | 0.4 | 0.2 | 1.2 ± 0.5 | 0.8 | -0.3 |
| ARC-Challenge | 1.6 ± 1.0 | 0.6 | 4.2 ± 1.6 | 3.9 | -1.4 ± 0.8 | 2.6 | -0.9 | 1.8 ± 0.8 | 6.8 | 0.6 |
| ARC-Easy | 44.5 ± 0.5 | 43.0 | 48.1 ± 4.8 | 46.8 | 39.7 ± 0.3 | 44.6 | 42.3 | 45.7 ± 0.6 | 51.0 | 47.1 |
| BoolQ | 18.8 ± 3.4 | 1.5 | 22.4 ± 3.3 | 2.2 | 12.8 ± 4.4 | 3.4 | 13.4 | 12.4 ± 5.9 | 13.0 | 7.0 |
| CB | 20.0 ± 4.7 | 0.4 | 9.3 ± 16.6 | 0.9 | 19.7 ± 5.1 | 25.4 | 14.3 | 23.9 ± 3.8 | 25.0 | 28.1 |
| COPA | 49.7 ± 3.5 | 57.0 | 55.3 ± 3.8 | 60.0 | 42.7 ± 2.2 | 47.3 | 37.7 | 41.1 ± 3.0 | 55.3 | 43.0 |
| HellaSwag | 24.7 ± 0.3 | 25.1 | 29.4 ± 1.3 | 30.7 | 16.3 ± 0.1 | 22.8 | 17.6 | 21.0 ± 0.2 | 26.3 | 22.4 |
| PiQA | 47.9 ± 0.6 | 49.1 | 48.8 ± 3.8 | 53.4 | 41.2 ± 0.7 | 45.1 | 41.9 | 45.0 ± 0.6 | 48.5 | 46.3 |
| RTE | 5.1 ± 4.0 | 3.2 | 6.9 ± 3.1 | 0.1 | 3.9 ± 1.1 | 6.1 | 5.8 | 2.2 ± 4.3 | 1.1 | 8.9 |
| SciQ | 83.2 ± 0.6 | 80.4 | 86.3 ± 1.1 | 82.2 | 83.2 ± 0.6 | 82.6 | 83.1 | 86.3 ± 0.6 | 88.5 | 86.4 |
| StoryCloze 2016 | 58.7 ± 0.2 | 61.8 | 62.8 ± 0.5 | 65.2 | 52.8 ± 0.3 | 58.1 | 54.3 | 57.2 ± 0.6 | 61.6 | 58.6 |
| WinoGrande XL | 11.6 ± 0.8 | 13.3 | 18.7 ± 1.0 | 19.7 | 5.8 ± 0.9 | 12.7 | 5.6 | 10.1 ± 1.0 | 16.2 | 11.0 |
| E2E NLG | 17.0 ± 1.4 | 15.6 | 17.9 ± 0.7 | 14.2 | 20.3 ± 0.3 | 20.5 | 20.5 | 21.6 ± 0.7 | 2.4 | 22.6 |
| XSUM | 2.4 ± 0.1 | 2.1 | 3.0 ± 0.3 | 2.5 | 3.0 ± 0.1 | 3.2 | 3.1 | 3.7 ± 0.2 | 4.6 | 3.8 |
| WebNLG EN | 5.3 ± 0.1 | 4.3 | 5.6 ± 0.3 | 4.4 | 8.8 ± 0.4 | 7.4 | 7.4 | 9.3 ± 0.5 | 9.7 | 9.4 |
| WikiLingua EN | 3.0 ± 0.1 | 3.2 | 3.6 ± 0.2 | 3.2 | 2.9 ± 0.1 | 3.0 | 3.1 | 4.0 ± 0.1 | 4.3 | 4.0 |
| bAbI | 0.0 ± 0.0 | 0.0 | 0.0 ± 0.0 | 0.0 | 15.5 ± 1.0 | 17.2 | 14.3 | 19.3 ± 1.0 | 21.1 | 18.0 |
| Average | 20.9 ± 0.4 | 19.1 | 22.2 ± 1.4 | 20.5 | 19.4 ± 0.5 | 21.2 | 19.1 | 21.4 ± 0.5 | 22.8 | 22.0 |
Table 14: Results for filtering with deduplication and the ROOTS filters. The resulting dataset sizes are in Table 12. The data is repeated until it matches 55B tokens for 2.8B parameter and 84B tokens for 4.2B parameter models. Scores are normalized averages of 0-5 few-shots and reported as percentages. For unfiltered models we report mean/std. err. across five different models, each trained with a different random seed.
| 训练数据 | C4 | OSCAR | ||||||||
|---|---|---|---|---|---|---|---|---|---|---|
| 参数 | 2.8B parameters | 4.2B parameters | 2.8B parameters | 4.2B parameters | ||||||
| Method | All | Dedup. | All | Dedup. | All | Dedup. | ROOTS | All | Dedup.-exp. | ROOTS |
| ANLI R1 | 0.4 ± 1.6 | -0.2 | -0.5 ± 1.4 | -0.8 | -0.3 ± 0.5 | -2.1 | -1.7 | -0.4 ± 1.2 | -1.8 | 1.2 |
| ANLI R2 | 0.9 ± 0.4 | 1.1 | 0.0 ± 1.3 | -0.1 | 1.0 ± 1.0 | 2.0 | 0.7 | 1.0 ± 0.9 | -0.5 | -0.3 |
| ANLI R3 | 1.7 ± 0.5 | 1.8 | 0.7 ± 0.5 | 0.4 | 0.4 ± 0.8 | 0.4 | 0.2 | 1.2 ± 0.5 | 0.8 | -0.3 |
| ARC-Challenge | 1.6 ± 1.0 | 0.6 | 4.2 ± 1.6 | 3.9 | -1.4 ± 0.8 | 2.6 | -0.9 | 1.8 ± 0.8 | 6.8 | 0.6 |
| ARC-Easy | 44.5 ± 0.5 | 43.0 | 48.1 ± 4.8 | 46.8 | 39.7 ± 0.3 | 44.6 | 42.3 | 45.7 ± 0.6 | 51.0 | 47.1 |
| BoolQ | 18.8 ± 3.4 | 1.5 | 22.4 ± 3.3 | 2.2 | 12.8 ± 4.4 | 3.4 | 13.4 | 12.4 ± 5.9 | 13.0 | 7.0 |
| CB | 20.0 ± 4.7 | 0.4 | 9.3 ± 16.6 | 0.9 | 19.7 ± 5.1 | 25.4 | 14.3 | 23.9 ± 3.8 | 25.0 | 28.1 |
| COPA | 49.7 ± 3.5 | 57.0 | 55.3 ± 3.8 | 60.0 | 42.7 ± 2.2 | 47.3 | 37.7 | 41.1 ± 3.0 | 55.3 | 43.0 |
| HellaSwag | 24.7 ± 0.3 | 25.1 | 29.4 ± 1.3 | 30.7 | 16.3 ± 0.1 | 22.8 | 17.6 | 21.0 ± 0.2 | 26.3 | 22.4 |
| PiQA | 47.9 ± 0.6 | 49.1 | 48.8 ± 3.8 | 53.4 | 41.2 ± 0.7 | 45.1 | 41.9 | 45.0 ± 0.6 | 48.5 | 46.3 |
| RTE | 5.1 ± 4.0 | 3.2 | 6.9 ± 3.1 | 0.1 | 3.9 ± 1.1 | 6.1 | 5.8 | 2.2 ± 4.3 | 1.1 | 8.9 |
| SciQ | 83.2 ± 0.6 | 80.4 | 86.3 ± 1.1 | 82.2 | 83.2 ± 0.6 | 82.6 | 83.1 | 86.3 ± 0.6 | 88.5 | 86.4 |
| StoryCloze 2016 | 58.7 ± 0.2 | 61.8 | 62.8 ± 0.5 | 65.2 | 52.8 ± 0.3 | 58.1 | 54.3 | 57.2 ± 0.6 | 61.6 | 58.6 |
| WinoGrande XL | 11.6 ± 0.8 | 13.3 | 18.7 ± 1.0 | 19.7 | 5.8 ± 0.9 | 12.7 | 5.6 | 10.1 ± 1.0 | 16.2 | 11.0 |
| E2E NLG | 17.0 ± 1.4 | 15.6 | 17.9 ± 0.7 | 14.2 | 20.3 ± 0.3 | 20.5 | 20.5 | 21.6 ± 0.7 | 2.4 | 22.6 |
| XSUM | 2.4 ± 0.1 | 2.1 | 3.0 ± 0.3 | 2.5 | 3.0 ± 0.1 | 3.2 | 3.1 | 3.7 ± 0.2 | 4.6 | 3.8 |
| WebNLG EN | 5.3 ± 0.1 | 4.3 | 5.6 ± 0.3 | 4.4 | 8.8 ± 0.4 | 7.4 | 7.4 | 9.3 ± 0.5 | 9.7 | 9.4 |
| WikiLingua EN | 3.0 ± 0.1 | 3.2 | 3.6 ± 0.2 | 3.2 | 2.9 ± 0.1 | 3.0 | 3.1 | 4.0 ± 0.1 | 4.3 | 4.0 |
| bAbI | 0.0 ± 0.0 | 0.0 | 0.0 ± 0.0 | 0.0 | 15.5 ± 1.0 | 17.2 | 14.3 | 19.3 ± 1.0 | 21.1 | 18.0 |
| Average | 20.9 ± 0.4 | 19.1 | 22.2 ± 1.4 | 20.5 | 19.4 ± 0.5 | 21.2 | 19.1 | 21.4 ± 0.5 | 22.8 | 22.0 |
Table 14: Results for filtering with deduplication and the ROOTS filters. The resulting dataset sizes are in Table 12. The data is repeated until it matches 55B tokens for 2.8B parameter and 84B tokens for 4.2B parameter models. Scores are normalized averages of 0-5 few-shots and reported as percentages. For unfiltered models we report mean/std. err. across five different models, each trained with a different random seed.
Appendix P Loss Curves for Complementary Strategies
附录 P 互补策略的损失曲线
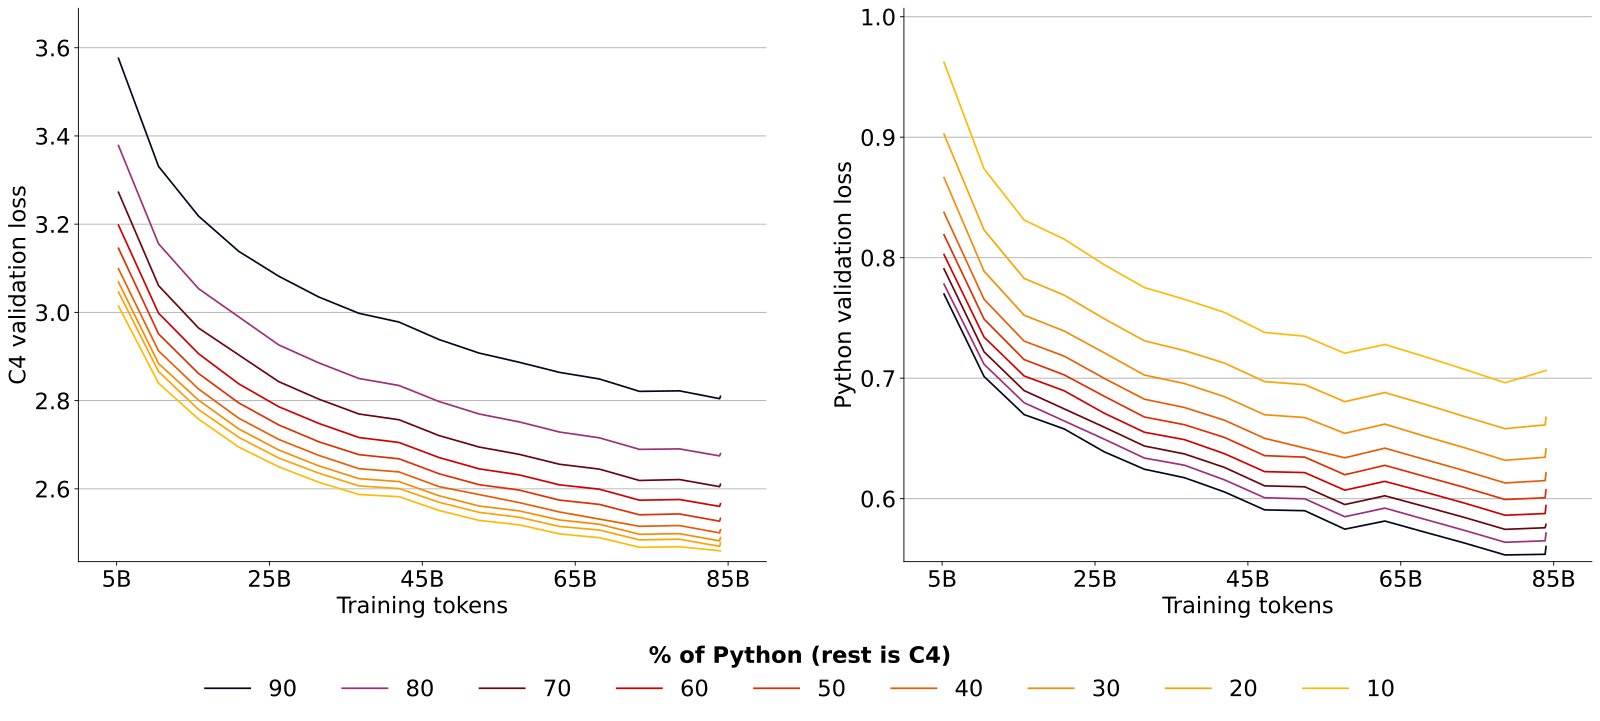
Figure 19: Validation loss of models trained on a mix of natural language (C4) and Python data.
图 19:在自然语言(C4)与 Python 数据混合上训练的模型的验证损失。
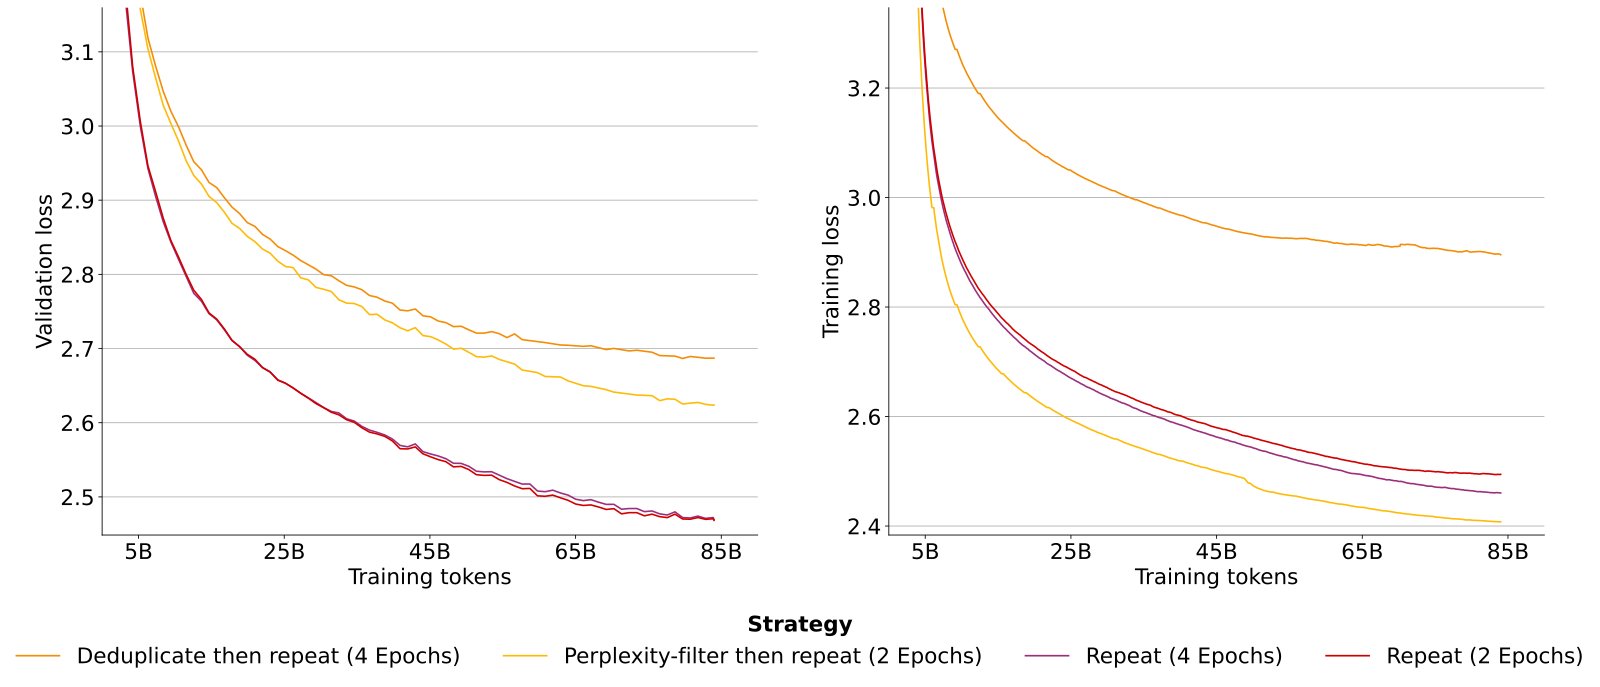
Figure 20: Validation and training loss of models trained with different data strategies. Training loss is smoothed with exponential moving average smoothing and a weight of 0.999. Downstream performance of the models is in Figure 6.
图 20:不同数据策略训练的模型的验证与训练损失。训练损失经平滑;验证损失显示过滤与重复策略的差异。
To compare complementary data strategies in §7, we have used downstream performance on natural language tasks detailed in Appendix K instead of loss. This is because validation loss gives an unfair advantage to models trained on a larger fraction of data from the same distribution. For example, when making up for missing natural language data with code, models that are trained on more code will have better validation loss on code data while having worse loss on the natural language data as seen in Figure 19: The model pre-trained on 90% of Python code data and 10% of C4 has the highest C4 validation loss, but the lowest Python validation loss.
为比较第 7 节的互补数据策略,我们使用附录 K 详述的自然语言任务下游表现。损失因数据分布不同而不可直接跨策略比较,但仍有助于诊断过拟合:例如重度重复时训练损失继续下降而验证损失上升。
Models trained on deduplicated or perplexity-filtered data have higher validation loss as the held-out validation data has not gone through the same filtering steps. Thus, its distribution more closely resembles the training data of models trained on the unfiltered data resulting in worse validation loss for the two filtering strategies in Figure 20 (left). Meanwhile, for training loss in Figure 20 (right) the model trained on perplexity-filtered data has the lowest loss. Its training data has been filtered to the top 25% of examples with the lowest perplexity (Appendix N) thus high loss examples have been explicitly filtered out from the training data resulting in low training loss. The model trained on deduplicated data has the highest validation and training loss. This is because commonly repeated sequences have been filtered out from its training data. Thus, when encountering these common sequences in the unfiltered validation set, its loss is comparatively high as other models have likely simply memorized them. Similarly, fewer repeated sequences during training results in higher training loss as unseen sequences are harder to predict.
在去重或困惑度过滤数据上训练的模型,验证损失往往更高,因为留出验证数据仍来自未过滤分布,与训练分布错位。因此我们更依赖下游分数做策略排序。图 19–20 显示:代码混合在验证损失上可接近纯 C4 重复;过滤策略的损失解读需谨慎。
Appendix Q Limitations and Future Work
附录 Q 局限与未来工作
Repeating fractions of the data
In this work we focus on repeating the entire unique dataset for several epochs. Alternatively, one can repeat only a fraction of the dataset. For example, repeating 10% of the dataset for 10 epochs while repeating the rest only for a single epoch as done by Hernandez et al. 2022. To predict loss in that scenario, one may need to adapt our scaling laws with an additional parameter to account for the fraction that is repeated and possibly a parameter that captures at what point in training the data is repeated. Repeating earlier in training when most model weights are still randomly initialized is likely to cause less damage than later in training. Adapting our parametric fit to make concrete scaling predictions for such scenarios is an exciting future research direction.
重复数据的一部分
本文聚焦把整个唯一数据集重复多个 epoch。也有工作研究只上采样语料中的一小部分 [40]。部分重复可能改变记忆与泛化的权衡,我们未系统扫描「重复比例×重复次数」网格。未来工作可检验:只重复高质子集是否比均匀重复全数据更划算。
Sensitivity to hyperparameters
The returns from additional epochs may heavily depend on hyperparameters such as learning rate, dropout, or the optimizer choice. It is likely that increasing the learning rate, for example, would lead to diminishing returns from additional epochs kicking in earlier. In this work, we have fixed most hyperparameters to commonly used values for the training of LLMs and leave such explorations to future work.
对超参的敏感性
额外 epoch 的收益可能强烈依赖学习率日程、批大小与正则等超参。我们基本沿用 Chinchilla/Gopher 式余弦衰减并关闭早停;换日程或更强正则可能移动 的有效位置。
Other datasets
The optimal data strategy is dependent on the dataset at hand and we cannot give universally applicable filtering recommendations. By looking into C4 and OSCAR, we have covered two of the most commonly used English text datasets. Our findings on both datasets were overall in agreement with each other. We have highlighted some of the differences, such as deduplication being more effective on OSCAR due to it being more noisy than C4. Further, we have focused on large-scale pre-training datasets. There is a lot of research on the optimal fine-tuning dataset and methodology for LLMs [94, 62, 128, 85, 117, 68, 116, 134, 115, 36, 125, 72, 63]. More investigations of resolving data-constraints when fine-tuning LLMs may be of interest for future work.
其他数据集
最优数据策略依赖手头数据集,我们无法给出对所有领域普遍适用的常数。C4、OSCAR 与科学域(Galactica)上的定性结论一致,但 、 的数值应在新域重新拟合。
Other modalities or architectures
Our work focuses on text datasets and uses the GPT transformer architecture [88]. Prior work has experimented with many variations to the GPT or transformer architecture [27, 104, 96], as well as scaling laws for non-text datasets [1]. Overall, variations of the GPT or transformer architecture have proven very robust and generalizable to other domains [43, 18, 70, 66, 71, 104, 26]. Nonetheless, it may be of interest for future work to test the applicability of our findings in this work to different data modalities or model architectures.
其他模态或架构
本文聚焦文本数据集,并使用 GPT Transformer 架构 [88]。视觉、语音或多模态数据受限缩放,以及 MoE/检索增强架构下的重复规律,是否服从同一指数衰减形式,仍待验证。
Other strategies
There are numerous strategies to solve data constraints not covered in this work that are worth exploring. Like we have shown for Python, future research may consider to what extent augmenting with a natural language (e.g. Chinese) improves performance in another language (e.g. English) and what is the best language to choose [61, 124]. Similarly, while we have looked at deduplication and perplexity filtering, other filtering strategies, such as popularity-based filters [3, 133] and toxicity filters [33, 38, 64, 87, 86] are worth exploring.
其他策略
还有大量本文未覆盖、值得探索的数据约束应对策略:合成数据、检索增强、课程学习、跨语言迁移、更激进的去噪与重标注等。我们把代码增强与过滤当作互补基线,而非穷尽列表。
Appendix R Contributions
附录 R 贡献
Niklas Muennighoff led experiments, analysis, writing, and the overall project. He implemented, trained and evaluated all models.
Niklas Muennighoff 主导实验、分析、写作与整体项目。他实现、训练并评测了全部模型。
Alexander M. Rush contributed to framing, results analysis, and paper writing.
Alexander M. Rush 贡献于问题框定、结果分析与论文写作。
Boaz Barak contributed to formal and experimental analysis as well as paper writing.
Boaz Barak 贡献于形式化与实验分析以及论文写作。
Teven Le Scao provided guidance, led data choices and preprocessing, and contributed to framing and writing.
Teven Le Scao 提供指导,主导数据选择与预处理,并贡献于框定与写作。
Aleksandra Piktus created perplexity and deduplication datasets and contributed to writing.
Aleksandra Piktus 创建困惑度与去重数据集,并贡献于写作。
Nouamane Tazi contributed to enabling high-performance training on AMD hardware.
Nouamane Tazi 贡献于在 AMD 硬件上实现高性能训练。
Sampo Pyysalo contributed to enabling high-performance training and early repetition experiments.
Sampo Pyysalo 贡献于实现高性能训练与早期重复实验。
Thomas Wolf provided guidance on experimental design and contributed to paper writing.
Thomas Wolf 为实验设计提供指导,并贡献于论文写作。
Colin Raffel provided guidance on experimental design and contributed to paper writing.
Colin Raffel 为实验设计提供指导,并贡献于论文写作。
Appendix S Hyperparameters and Setup
附录 S 超参与设定
For all training runs we use 1% of tokens for linear warm-up of the learning rate to a maximum learning rate of 2e-4 that is decayed to 2e-5 following a cosine schedule. We use a batch size of 256 for models with fewer than 2 billion parameters, 512 for models with 2 - 5 billion parameters and 1024 for models with more than 5 billion parameters. All models are trained in bfloat16 precision using the Adam optimizer [48] with , . For , we found a value of to result in slightly lower final loss and fewer loss spikes than the default value of in implementations such as PyTorch. However, except for models with FLOP budgets of and , we always use . We use a dropout rate of , a weight decay rate of and clip gradients at . These hyperparameter choices are largely based on prior work [42, 110] and performance on test runs. As none of our hyperparameter choices is particularly exotic, we expect our setup to generalize to many other setups. In Table 15 we list the model architectures we use. They are an extended version of the architectures from [42]. We calculate model parameters following [78], which includes embedding parameters:
全部训练运行用 1% token 做学习率线性预热,最大学习率 2e-4,再按余弦衰减 。优化器为 Adam,批大小按模型规模选取以保持稳定。我们使用 GPT-2 分词器与架构变体;参数量按下列公式核算,并在需要时微调头数以匹配硬件。
where is the final parameter count, are layers, is the hidden dimension, the vocabulary size and the sequence length. We find the parameter counts reported in Chinchilla [42] to be significantly different than our calculations, especially at larger scales. We report both in Table 15, but we use our parameter estimates everywhere in this work. Further, we have corrected the number of heads of the 3,530 and 4,084 million parameter models from [42] to obey the relationship .
其中 为最终参数量, 为层数, 为隐藏维度, 为词表大小, 为序列长度相关项。该公式用于在设计模型时对齐目标参数量。
To train our models, we have forked the Megatron-DeepSpeed [91, 99] framework and adapted it for ROCm to enable training on AMD GPUs. We have made our training code publicly available at https://github.com/TurkuNLP/Megatron-DeepSpeed. Models are trained using data, tensor and pipeline parallelism on up to 256 AMD Instinct MI250X GPUs distributed across up to 64 nodes on the LUMI supercomputer located in Finland. As of June 2023, LUMI is the largest supercomputer in Europe and ranks third worldwide with a performance of around 310 PFLOPs.[^5] We trained models in parallel using up to 2,200 nodes at a single point in time (equivalent to around 8,800 GPUs or 17,600 GCDs or 86% of all GPUs on LUMI). We have used a total of around 3 million GPU hours. The cluster is powered 100% by renewable energy (hydroelectricity) and its waste heat is used for heating the nearby city reducing the city’s carbon emissions by up to 20%. Thanks to the low temperatures in Finland, relatively little cooling for the cluster is required further reducing its impact on the environment. As of June 2023, it ranks as the seventh greenest supercomputer.[^6]
为训练模型,我们 fork 了 Megatron-DeepSpeed [91, 99] 框架并适配 ROCm,以便在 LUMI 的 AMD GPU 上训练。检查点、日志与配置随 datablations 发布。除非消融实验另有说明,默认不使用 dropout。序列长度与 [42] 常用设定对齐。
| Parameters (millions) | d_model | ffw_size | kv_size | n_heads | n_layers | |
|---|---|---|---|---|---|---|
| This work | Chinchilla | |||||
| 7 | - | 128 | 512 | 32 | 4 | 3 |
| 14 | - | 224 | 896 | 32 | 7 | 4 |
| 20 | - | 288 | 1152 | 32 | 7 | 5 |
| 38 | - | 448 | 1792 | 32 | 7 | 6 |
| 52 | 44 | 512 | 2048 | 64 | 8 | 8 |
| 66 | 57 | 576 | 2304 | 64 | 9 | 9 |
| 83 | 74 | 640 | 2560 | 64 | 10 | 10 |
| 97 | 90 | 640 | 2560 | 64 | 10 | 13 |
| 112 | 106 | 640 | 2560 | 64 | 10 | 16 |
| 125 | 117 | 768 | 3072 | 64 | 12 | 12 |
| 146 | 140 | 768 | 3072 | 64 | 12 | 15 |
| 168 | 163 | 768 | 3072 | 64 | 12 | 18 |
| 182 | 175 | 896 | 3584 | 64 | 14 | 14 |
| 201 | 196 | 896 | 3584 | 64 | 14 | 16 |
| 220 | 217 | 896 | 3584 | 64 | 14 | 18 |
| 255 | 251 | 1024 | 4096 | 64 | 16 | 16 |
| 280 | 278 | 1024 | 4096 | 64 | 16 | 18 |
| 305 | 306 | 1024 | 4096 | 64 | 16 | 20 |
| 421 | 425 | 1280 | 5120 | 128 | 10 | 18 |
| 480 | 489 | 1280 | 5120 | 128 | 10 | 21 |
| 502 | 509 | 1408 | 5632 | 128 | 11 | 18 |
| 539 | 552 | 1280 | 5120 | 128 | 10 | 24 |
| 574 | 587 | 1408 | 5632 | 128 | 11 | 21 |
| 619 | 632 | 1536 | 6144 | 128 | 12 | 19 |
| 645 | 664 | 1408 | 5632 | 128 | 11 | 24 |
| 704 | 724 | 1536 | 6144 | 128 | 12 | 22 |
| 789 | 816 | 1536 | 6144 | 128 | 12 | 25 |
| 865 | 893 | 1792 | 7168 | 128 | 14 | 20 |
| 981 | 1018 | 1792 | 7168 | 128 | 14 | 23 |
| 1096 | 1143 | 1792 | 7168 | 128 | 14 | 26 |
| 1215 | 1266 | 2048 | 8192 | 128 | 16 | 22 |
| 1364 | 1424 | 2176 | 8704 | 128 | 17 | 22 |
| 1366 | 1429 | 2048 | 8192 | 128 | 16 | 25 |
| 1517 | 1593 | 2048 | 8192 | 128 | 16 | 28 |
| 1535 | 1609 | 2176 | 8704 | 128 | 17 | 25 |
| 1650 | 1731 | 2304 | 9216 | 128 | 18 | 24 |
| 1706 | 1794 | 2176 | 8704 | 128 | 17 | 28 |
| 1905 | 2007 | 2304 | 9216 | 128 | 18 | 28 |
| 2160 | 2283 | 2304 | 9216 | 128 | 18 | 32 |
| 2179 | 2298 | 2560 | 10240 | 128 | 20 | 26 |
| 2494 | 2639 | 2560 | 10240 | 128 | 20 | 30 |
| 2809 | 2980 | 2560 | 10240 | 128 | 20 | 34 |
| 3090 | - | 2688 | 10752 | 128 | 22 | 34 |
| 3263 | 3530 | 2688 | 10752 | 128 | 21 | 36 |
| 3574 | 3802 | 2816 | 11264 | 128 | 22 | 36 |
| 3900 | 4084 | 2944 | 11776 | 128 | 23 | 36 |
| 4239 | 4516 | 3072 | 12288 | 128 | 24 | 36 |
| 6355 | 6796 | 3584 | 14336 | 128 | 28 | 40 |
| 8672 | 9293 | 4096 | 16384 | 128 | 32 | 42 |
| 10912 | 11452 | 4352 | 17408 | 128 | 32 | 47 |
| 11455 | 12295 | 4608 | 18432 | 128 | 36 | 44 |
| 12220 | 12569 | 4608 | 18432 | 128 | 32 | 47 |
| 13601 | 13735 | 4864 | 19456 | 128 | 32 | 47 |
| 14917 | 14940 | 4992 | 19968 | 128 | 32 | 49 |
| 15056 | 16183 | 5120 | 20480 | 128 | 40 | 47 |
Table 15: Model architectures. We list the architectures of all models trained as part of this work. Many shown models have been trained multiple times on different amounts of unique data and for varying epochs.
| 参数量(百万) | d_model | ffw_size | kv_size | n_heads | n_layers | |
|---|---|---|---|---|---|---|
| 本工作rk | Chinchilla | |||||
| 7 | - | 128 | 512 | 32 | 4 | 3 |
| 14 | - | 224 | 896 | 32 | 7 | 4 |
| 20 | - | 288 | 1152 | 32 | 7 | 5 |
| 38 | - | 448 | 1792 | 32 | 7 | 6 |
| 52 | 44 | 512 | 2048 | 64 | 8 | 8 |
| 66 | 57 | 576 | 2304 | 64 | 9 | 9 |
| 83 | 74 | 640 | 2560 | 64 | 10 | 10 |
| 97 | 90 | 640 | 2560 | 64 | 10 | 13 |
| 112 | 106 | 640 | 2560 | 64 | 10 | 16 |
| 125 | 117 | 768 | 3072 | 64 | 12 | 12 |
| 146 | 140 | 768 | 3072 | 64 | 12 | 15 |
| 168 | 163 | 768 | 3072 | 64 | 12 | 18 |
| 182 | 175 | 896 | 3584 | 64 | 14 | 14 |
| 201 | 196 | 896 | 3584 | 64 | 14 | 16 |
| 220 | 217 | 896 | 3584 | 64 | 14 | 18 |
| 255 | 251 | 1024 | 4096 | 64 | 16 | 16 |
| 280 | 278 | 1024 | 4096 | 64 | 16 | 18 |
| 305 | 306 | 1024 | 4096 | 64 | 16 | 20 |
| 421 | 425 | 1280 | 5120 | 128 | 10 | 18 |
| 480 | 489 | 1280 | 5120 | 128 | 10 | 21 |
| 502 | 509 | 1408 | 5632 | 128 | 11 | 18 |
| 539 | 552 | 1280 | 5120 | 128 | 10 | 24 |
| 574 | 587 | 1408 | 5632 | 128 | 11 | 21 |
| 619 | 632 | 1536 | 6144 | 128 | 12 | 19 |
| 645 | 664 | 1408 | 5632 | 128 | 11 | 24 |
| 704 | 724 | 1536 | 6144 | 128 | 12 | 22 |
| 789 | 816 | 1536 | 6144 | 128 | 12 | 25 |
| 865 | 893 | 1792 | 7168 | 128 | 14 | 20 |
| 981 | 1018 | 1792 | 7168 | 128 | 14 | 23 |
| 1096 | 1143 | 1792 | 7168 | 128 | 14 | 26 |
| 1215 | 1266 | 2048 | 8192 | 128 | 16 | 22 |
| 1364 | 1424 | 2176 | 8704 | 128 | 17 | 22 |
| 1366 | 1429 | 2048 | 8192 | 128 | 16 | 25 |
| 1517 | 1593 | 2048 | 8192 | 128 | 16 | 28 |
| 1535 | 1609 | 2176 | 8704 | 128 | 17 | 25 |
| 1650 | 1731 | 2304 | 9216 | 128 | 18 | 24 |
| 1706 | 1794 | 2176 | 8704 | 128 | 17 | 28 |
| 1905 | 2007 | 2304 | 9216 | 128 | 18 | 28 |
| 2160 | 2283 | 2304 | 9216 | 128 | 18 | 32 |
| 2179 | 2298 | 2560 | 10240 | 128 | 20 | 26 |
| 2494 | 2639 | 2560 | 10240 | 128 | 20 | 30 |
| 2809 | 2980 | 2560 | 10240 | 128 | 20 | 34 |
| 3090 | - | 2688 | 10752 | 128 | 22 | 34 |
| 3263 | 3530 | 2688 | 10752 | 128 | 21 | 36 |
| 3574 | 3802 | 2816 | 11264 | 128 | 22 | 36 |
| 3900 | 4084 | 2944 | 11776 | 128 | 23 | 36 |
| 4239 | 4516 | 3072 | 12288 | 128 | 24 | 36 |
| 6355 | 6796 | 3584 | 14336 | 128 | 28 | 40 |
| 8672 | 9293 | 4096 | 16384 | 128 | 32 | 42 |
| 10912 | 11452 | 4352 | 17408 | 128 | 32 | 47 |
| 11455 | 12295 | 4608 | 18432 | 128 | 36 | 44 |
| 12220 | 12569 | 4608 | 18432 | 128 | 32 | 47 |
| 13601 | 13735 | 4864 | 19456 | 128 | 32 | 47 |
| 14917 | 14940 | 4992 | 19968 | 128 | 32 | 49 |
| 15056 | 16183 | 5120 | 20480 | 128 | 40 | 47 |
Table 15: Model architectures. We list the architectures of all models trained as part of this work. Many shown models have been trained multiple times on different amounts of unique data and for varying epochs.
Appendix T Prompts and Samples
附录 T 提示与样本
The following figures illustrate the prompts with samples from each evaluation dataset. Prompts stem from PromptSource [5] or GPT-3 [15]. All data comes from the ground truth datasets in this section, and no generations are shown here.
下列各图展示每个评测数据集的提示与样本。提示来自 PromptSource [4];我们展示上下文与正确答案格式以便复现。
| Context | Edmond (or Edmund) Halley, FRS (pronounced ; 8 November [O.S. 29 October] 1656 – 25 January 1742 [O.S. 14 January 1741] ) was an English astronomer, geophysicist, mathematician, meteorologist, and physicist who is best known for computing the orbit of Halley’s Comet. He was the second Astronomer Royal in Britain, succeeding John Flamsteed. Question: Edmond Halley was born outside of the United Kingdom. True, False, or Neither? Answer: |
|---|---|
| Correct Answer | Neither |
| Incorrect Answer | True |
| Incorrect Answer | False |
Figure 21: Formatted dataset example from ANLI R1 evaluated using accuracy as described in Appendix K.
| 上下文 | Edmond (or Edmund) Halley, FRS (pronounced ; 8 November [O.S. 29 October] 1656 – 25 January 1742 [O.S. 14 January 1741] ) was an English astronomer, geophysicist, mathematician, meteorologist, and physicist who is best known for computing the orbit of Halley’s Comet. He was the second Astronomer Royal in Britain, succeeding John Flamsteed. Question: Edmond Halley was born outside of the United Kingdom. True, False, or Neither? Answer: |
|---|---|
| 正确答案 | Neither |
| Incorrect Answer | True |
| Incorrect Answer | False |
Figure 21: Formatted dataset example from ANLI R1 evaluated using accuracy as described in Appendix K.
| Context | The 1970 Swedish Open was a combined men’s and women’s tennis tournament played on outdoor clay courts held in Båstad, Sweden and was part of the Grand Prix circuit of the 1970 Tour. It was the 23rd edition of the tournament and was held from 2 July through 12 July 1970. Dick Crealy and Peaches Bartkowicz won the singles titles. Question: Dick Crealy and Peaches Bartkowicz beat eachother in the 1970 Swedish Open. True, False, or Neither? Answer: |
|---|---|
| Correct Answer | False |
| Incorrect Answer | True |
| Incorrect Answer | Neither |
Figure 22: Formatted dataset example from ANLI R2 evaluated using accuracy as described in Appendix K.
| 上下文 | The 1970 Swedish Open was a combined men’s and women’s tennis tournament played on outdoor clay courts held in Båstad, Sweden and was part of the Grand Prix circuit of the 1970 Tour. It was the 23rd edition of the tournament and was held from 2 July through 12 July 1970. Dick Crealy and Peaches Bartkowicz won the singles titles. Question: Dick Crealy and Peaches Bartkowicz beat eachother in the 1970 Swedish Open. True, False, or Neither? Answer: |
|---|---|
| 正确答案 | False |
| Incorrect Answer | True |
| Incorrect Answer | Neither |
Figure 22: Formatted dataset example from ANLI R2 evaluated using accuracy as described in Appendix K.
| Context | Tokyo - Food group Nestle is seeking to lure Japanese holiday shoppers with a taste for fine snacking with a gold-wrapped Kit Kat chocolate bar. The single finger Kit Kat is wrapped in a thin layer of gold leaf. Only 500 of the bars go on sale from Dec. 29 with a price tag of around 2,016 yen ($16). The Kit Kat chocolate bar made its debut in Japan in 1973 and since then a variety of flavors -- from green tea to wasabi -- have been produced. Question: Japanese like kit kat. True, False, or Neither? Answer: |
|---|---|
| Correct Answer | True |
| Incorrect Answer | False |
| Incorrect Answer | Neither |
Figure 23: Formatted dataset example from ANLI R3 evaluated using accuracy as described in Appendix K.
| 上下文 | Tokyo - Food group Nestle is seeking to lure Japanese holiday shoppers with a taste for fine snacking with a gold-wrapped Kit Kat chocolate bar. The single finger Kit Kat is wrapped in a thin layer of gold leaf. Only 500 of the bars go on sale from Dec. 29 with a price tag of around 2,016 yen ($16). The Kit Kat chocolate bar made its debut in Japan in 1973 and since then a variety of flavors -- from green tea to wasabi -- have been produced. Question: Japanese like kit kat. True, False, or Neither? Answer: |
|---|---|
| 正确答案 | True |
| Incorrect Answer | False |
| Incorrect Answer | Neither |
Figure 23: Formatted dataset example from ANLI R3 evaluated using accuracy as described in Appendix K.
| Context | An astronomer observes that a planet rotates faster after a meteorite impact. Which is the most likely effect of this increase in rotation? |
|---|---|
| Correct Answer | Planetary days will become shorter. |
| Incorrect Answer | Planetary years will become longer. |
| Incorrect Answer | Planetary gravity will become stronger. |
Figure 24: Formatted dataset example from ARC-Challenge evaluated using accuracy as described in Appendix K.
| 上下文 | An astronomer observes that a planet rotates faster after a meteorite impact. Which is the most likely effect of this increase in rotation? |
|---|---|
| 正确答案 | Planetary days will become shorter. |
| Incorrect Answer | Planetary years will become longer. |
| Incorrect Answer | Planetary gravity will become stronger. |
Figure 24: Formatted dataset example from ARC-Challenge evaluated using accuracy as described in Appendix K.
| Context | To express the distance between the Milky Way galaxy and other galaxies, the most appropriate unit of measurement is the |
|---|---|
| Correct Answer | light-year. |
| Incorrect Answer | meter. |
| Incorrect Answer | kilometer. |
| Incorrect Answer | astronomical unit. |
Figure 25: Formatted dataset example from ARC-Easy evaluated using accuracy as described in Appendix K.
| 上下文 | To express the distance between the Milky Way galaxy and other galaxies, the most appropriate unit of measurement is the |
|---|---|
| 正确答案 | light-year. |
| Incorrect Answer | meter. |
| Incorrect Answer | kilometer. |
| Incorrect Answer | astronomical unit. |
Figure 25: Formatted dataset example from ARC-Easy evaluated using accuracy as described in Appendix K.
| Context | Radio wave -- Radio waves are a type of electromagnetic radiation with wavelengths in the electromagnetic spectrum longer than infrared light. Radio waves have frequencies as high as 300 gigahertz (GHz) to as low as 30 hertz (Hz). At 300 GHz, the corresponding wavelength is 1 mm, and at 30 Hz is 10,000 km. Like all other electromagnetic waves, radio waves travel at the speed of light. They are generated by electric charges undergoing acceleration, such as time varying electric currents. Naturally occurring radio waves are emitted by lightning and astronomical objects. Question: do radio waves travel at the speed of light? Answer: |
|---|---|
| Correct Answer | yes |
| Incorrect Answer | no |
Figure 26: Formatted dataset example from BoolQ evaluated using accuracy as described in Appendix K.
| 上下文 | Radio wave -- Radio waves are a type of electromagnetic radiation with wavelengths in the electromagnetic spectrum longer than infrared light. Radio waves have frequencies as high as 300 gigahertz (GHz) to as low as 30 hertz (Hz). At 300 GHz, the corresponding wavelength is 1 mm, and at 30 Hz is 10,000 km. Like all other electromagnetic waves, radio waves travel at the speed of light. They are generated by electric charges undergoing acceleration, such as time varying electric currents. Naturally occurring radio waves are emitted by lightning and astronomical objects. Question: do radio waves travel at the speed of light? Answer: |
|---|---|
| 正确答案 | yes |
| Incorrect Answer | no |
Figure 26: Formatted dataset example from BoolQ evaluated using accuracy as described in Appendix K.
| Context | A: Okay. So Frank, what, uh, type of, uh, budget do you or your family have? B: Well, uh I don’t know that we really have a budget. Question: he and his family really have a budget. True, False or Neither? Answer: |
|---|---|
| Correct Answer | False |
| Incorrect Answer | True |
| Incorrect Answer | Neither |
Figure 27: Formatted dataset example from CB evaluated using accuracy as described in Appendix K.
| 上下文 | A: Okay. So Frank, what, uh, type of, uh, budget do you or your family have? B: Well, uh I don’t know that we really have a budget. Question: he and his family really have a budget. True, False or Neither? Answer: |
|---|---|
| 正确答案 | False |
| Incorrect Answer | True |
| Incorrect Answer | Neither |
Figure 27: Formatted dataset example from CB evaluated using accuracy as described in Appendix K.
| Context | The computer was expensive to fix therefore |
|---|---|
| Correct Answer | I bought a new one. |
| Incorrect Answer | I got it repaired. |
Figure 28: Formatted dataset example from COPA evaluated using accuracy as described in Appendix K.
| 上下文 | The computer was expensive to fix therefore |
|---|---|
| 正确答案 | I bought a new one. |
| Incorrect Answer | I got it repaired. |
Figure 28: Formatted dataset example from COPA evaluated using accuracy as described in Appendix K.
| Context | Canoeing: Two women in a child are shown in a canoe while a man pulls the canoe while standing in the water, with other individuals visible in the background. The child and a different man |
|---|---|
| Correct Answer | sit in a canoe while the man paddles. |
| Incorrect Answer | are then shown paddling down a river in a boat while a woman talks. |
| Incorrect Answer | are driving the canoe, they go down the river flowing side to side. |
| Incorrect Answer | walking go down the rapids, while the man in his helicopter almost falls and goes out of canoehood. |
Figure 29: Formatted dataset example from HellaSwag evaluated using accuracy as described in Appendix K.
| 上下文 | Canoeing: Two women in a child are shown in a canoe while a man pulls the canoe while standing in the water, with other individuals visible in the background. The child and a different man |
|---|---|
| 正确答案 | sit in a canoe while the man paddles. |
| Incorrect Answer | are then shown paddling down a river in a boat while a woman talks. |
| Incorrect Answer | are driving the canoe, they go down the river flowing side to side. |
| Incorrect Answer | walking go down the rapids, while the man in his helicopter almost falls and goes out of canoehood. |
Figure 29: Formatted dataset example from HellaSwag evaluated using accuracy as described in Appendix K.
| Context | Question: How to sleep in proper posture? Answer: |
|---|---|
| Correct Answer | Sleep straight with a pillow under your head. |
| Incorrect Answer | Sleep straight with a pillow over your head. |
Figure 30: Formatted dataset example from PiQA evaluated using accuracy as described in Appendix K.
| 上下文 | Question: How to sleep in proper posture? Answer: |
|---|---|
| 正确答案 | Sleep straight with a pillow under your head. |
| Incorrect Answer | Sleep straight with a pillow over your head. |
Figure 30: Formatted dataset example from PiQA evaluated using accuracy as described in Appendix K.
| Context | As spacecraft commander for Apollo XI, the first manned lunar landing mission, Armstrong was the first man to walk on the Moon. "That’s one small step for a man, one giant leap for mankind." With these historic words, man’s dream of the ages was fulfilled. Question: Neil Armstrong was the first man who landed on the Moon. True or False? Answer: |
|---|---|
| Correct Answer | True. |
| Incorrect Answer | False. |
Figure 31: Formatted dataset example from RTE evaluated using accuracy as described in Appendix K.
| 上下文 | As spacecraft commander for Apollo XI, the first manned lunar landing mission, Armstrong was the first man to walk on the Moon. "That’s one small step for a man, one giant leap for mankind." With these historic words, man’s dream of the ages was fulfilled. Question: Neil Armstrong was the first man who landed on the Moon. True or False? Answer: |
|---|---|
| 正确答案 | True. |
| Incorrect Answer | False. |
Figure 31: Formatted dataset example from RTE evaluated using accuracy as described in Appendix K.
| Context | The electromagnetic spectrum encompasses a very wide range of wavelengths and frequencies. Visible light is only a very small portion of the spectrum with wavelengths from 400-700 nm. Question: With wavelengths from 400-700 nm, what kind of light represents only a very small portion of the spectrum? Answer: |
|---|---|
| Correct Answer | visible light. |
| Incorrect Answer | ultraviolet light. |
| Incorrect Answer | invisible light. |
| Incorrect Answer | sunlight. |
Figure 32: Formatted dataset example from SciQ evaluated using accuracy as described in Appendix K.
| 上下文 | The electromagnetic spectrum encompasses a very wide range of wavelengths and frequencies. Visible light is only a very small portion of the spectrum with wavelengths from 400-700 nm. Question: With wavelengths from 400-700 nm, what kind of light represents only a very small portion of the spectrum? Answer: |
|---|---|
| 正确答案 | visible light. |
| Incorrect Answer | ultraviolet light. |
| Incorrect Answer | invisible light. |
| Incorrect Answer | sunlight. |
Figure 32: Formatted dataset example from SciQ evaluated using accuracy as described in Appendix K.
| Context | Bob went to the gas station to fill up his car. His tank was completely empty and so was his wallet. The cashier offered to pay for his gas if he came back later to pay. Bob felt grateful as he drove home. Answer: |
|---|---|
| Correct Answer | Bob believed that there were good people in the world. |
| Incorrect Answer | Bob contemplated how unfriendly the world was. |
Figure 33: Formatted dataset example from StoryCloze evaluated using accuracy as described in Appendix K.
| 上下文 | Bob went to the gas station to fill up his car. His tank was completely empty and so was his wallet. The cashier offered to pay for his gas if he came back later to pay. Bob felt grateful as he drove home. Answer: |
|---|---|
| 正确答案 | Bob believed that there were good people in the world. |
| Incorrect Answer | Bob contemplated how unfriendly the world was. |
Figure 33: Formatted dataset example from StoryCloze evaluated using accuracy as described in Appendix K.
| Correct Context | Johnny likes fruits more than vegetables in his new keto diet because the fruits: |
|---|---|
| Incorrect Context | Johnny likes fruits more than vegetables in his new keto diet because the vegetables: |
| Target Completion | are saccharine. |
Figure 34: Formatted dataset example from WinoGrande evaluated using accuracy as described in Appendix K.
| Correct 上下文 | Johnny likes fruits more than vegetables in his new keto diet because the fruits: |
|---|---|
| Incorrect 上下文 | Johnny likes fruits more than vegetables in his new keto diet because the vegetables: |
| Target Completion | are saccharine. |
Figure 34: Formatted dataset example from WinoGrande evaluated using accuracy as described in Appendix K.
| Context | Given the following data about a restaurant: name : The Wrestlers eatType : pub food : Japanese priceRange : cheap area : riverside near : Raja Indian Cuisine |
|---|---|
| Generate some text about this restaurant. | |
| Target | The Wrestlers offers Japanese food and pub with cheap price near Raja Indian Cuisine in riverside. |
Figure 35: Formatted dataset example from E2E NLG evaluated using ROUGE as described in Appendix K.
| 上下文 | Given the following data about a restaurant: name : The Wrestlers eatType : pub food : Japanese priceRange : cheap area : riverside near : Raja Indian Cuisine |
|---|---|
| Generate some text about this restaurant. | |
| Target | The Wrestlers offers Japanese food and pub with cheap price near Raja Indian Cuisine in riverside. |
Figure 35: Formatted dataset example from E2E NLG evaluated using ROUGE as described in Appendix K.
| Context | Article: The artificial intelligence system - LipNet - watches video of a person speaking and matches the text to the movement of their mouths with 93% accuracy, the researchers said. Automating the process could help millions, they suggested. But experts said the system needed to be tested in real-life situations. Lip-reading is a notoriously tricky business with professionals only able to decipher what someone is saying up to 60% of the time. "Machine lip-readers have enormous potential, with applications in improved hearing aids, silent dictation in public spaces, covert conversations, speech recognition in noisy environments, biometric identification and silent-movie processing," wrote the researchers. They said that the AI system was provided with whole sentences so that it could teach itself which letter corresponded to which lip movement. To train the AI, the team - from Oxford University’s AI lab - fed it nearly 29,000 videos, labelled with the correct text. Each video was three seconds long and followed a similar grammatical pattern. While human testers given similar videos had an error rate of 47.7%, the AI had one of just 6.6%. The fact that the AI learned from specialist training videos led some on Twitter to criticise the research. Writing in OpenReview, Neil Lawrence pointed out that the videos had "limited vocabulary and a single syntax grammar". "While it’s promising to perform well on this data, it’s not really groundbreaking. While the model may be able to read my lips better than a human, it can only do so when I say a meaningless list of words from a highly constrained vocabulary in a specific order," he writes. The project was partially funded by Google’s artificial intelligence firm DeepMind. |
|---|---|
| Summary: | |
| Target | Scientists at Oxford University have developed a machine that can lip-read better than humans. |
Figure 36: Formatted dataset example from XSUM evaluated using ROUGE as described in Appendix K.
| 上下文 | Article: The artificial intelligence system - LipNet - watches video of a person speaking and matches the text to the movement of their mouths with 93% accuracy, the researchers said. Automating the process could help millions, they suggested. But experts said the system needed to be tested in real-life situations. Lip-reading is a notoriously tricky business with professionals only able to decipher what someone is saying up to 60% of the time. "Machine lip-readers have enormous potential, with applications in improved hearing aids, silent dictation in public spaces, covert conversations, speech recognition in noisy environments, biometric identification and silent-movie processing," wrote the researchers. They said that the AI system was provided with whole sentences so that it could teach itself which letter corresponded to which lip movement. To train the AI, the team - from Oxford University’s AI lab - fed it nearly 29,000 videos, labelled with the correct text. Each video was three seconds long and followed a similar grammatical pattern. While human testers given similar videos had an error rate of 47.7%, the AI had one of just 6.6%. The fact that the AI learned from specialist training videos led some on Twitter to criticise the research. Writing in OpenReview, Neil Lawrence pointed out that the videos had "limited vocabulary and a single syntax grammar". "While it’s promising to perform well on this data, it’s not really groundbreaking. While the model may be able to read my lips better than a human, it can only do so when I say a meaningless list of words from a highly constrained vocabulary in a specific order," he writes. The project was partially funded by Google’s artificial intelligence firm DeepMind. |
|---|---|
| Summary: | |
| Target | Scientists at Oxford University have developed a machine that can lip-read better than humans. |
Figure 36: Formatted dataset example from XSUM evaluated using ROUGE as described in Appendix K.
| Context | I will verbalize an abstract representation of a sentence in natural language. To do so, I will first show the representation and then the natural language. The text needs to include all of the information in the representation. Brandon_Carter | almaMater | University_of_Cambridge, University_of_Cambridge | chancellor | David_Sainsbury,_Baron_Sainsbury_of_Turville, Brandon_Carter | birthPlace | England, University_of_Cambridge | viceChancellor | Leszek_Borysiewicz |
|---|---|
| Target | The University of Cambridge is the alma mater of Brandon Carter, who was born in England. David Sainsbury, also known as the Baron Sainsbury of Turville, and Leszek Borysiewicz are respectively the chancellor and vice chancellor of the University of Cambridge. |
Figure 37: Formatted dataset example from WebNLG evaluated using ROUGE as described in Appendix K.
| 上下文 | I will verbalize an abstract representation of a sentence in natural language. To do so, I will first show the representation and then the natural language. The text needs to include all of the information in the representation. Brandon_Carter | almaMater | University_of_Cambridge, University_of_Cambridge | chancellor | David_Sainsbury,_Baron_Sainsbury_of_Turville, Brandon_Carter | birthPlace | England, University_of_Cambridge | viceChancellor | Leszek_Borysiewicz |
|---|---|
| Target | The University of Cambridge is the alma mater of Brandon Carter, who was born in England. David Sainsbury, also known as the Baron Sainsbury of Turville, and Leszek Borysiewicz are respectively the chancellor and vice chancellor of the University of Cambridge. |
Figure 37: Formatted dataset example from WebNLG evaluated using ROUGE as described in Appendix K.
| Context | Attributes are placed within the tag itself, making additional alterations to the ëlement contentb̈etween the start and end tag. They never stand alone. They are written in the format name=v̈alue,̈ where name is the name of the attribute (for instance c̈olor)̈, and value describes this specific instance (for instance r̈ed)̈. You’ve actually seen attributes before, if you followed the tutorial in the basic HTML section. tags use the src attribute, anchors use the name attribute, and links use the href attribute. See how those all follow the ___=_̈__f̈ormat? Making a table, or chart, requires several different tags. Play with these tags, or learn about HTML tables in more detail. Start with table tags around the entire table: Row tags around the contents of each row: Column headers in the first row: Cells in subsequent rows: Here’s an example of how it all fits together:Column 1: MonthColumn 2: Money SavedJanuary$100 You’ve already learned the tag, which shows up at the start of each document. Besides the tag, it can include the following types of tags: Meta tags, which are used to provide metadata about a web page. This data can be used by search engines when the robot scours the internet to locate and list websites. To make your website more visible on search engines, use one or more start tags (no end tags necessary), each with exactly one name attribute and one content attribute, for example: <meta name=d̈escriptionc̈ontent=ẅrite a description here>̈; or <meta name=k̈eywordsc̈ontent=ẅrite a list of keywords, each separated by a comma>̈ tags are used to associate other files with the page. This is mainly used to link to CSS stylesheets, which are made using a different type of coding to alter your HTML page by adding color, aligning your text, and many other things. tags are used to link the page to JavaScript files, which can cause the page to change as... |
|---|---|
| TL;DR in English: | |
| Target | Learn about attributes. Experiment with HTML tables. Learn the miscellaneous head tags. Play around with HTML found on websites. Learn more advanced web design from comprehensive guides. |
Figure 38: Formatted dataset example from WikiLingua evaluated using ROUGE as described in Appendix K.
| 上下文 | Attributes are placed within the tag itself, making additional alterations to the ëlement contentb̈etween the start and end tag. They never stand alone. They are written in the format name=v̈alue,̈ where name is the name of the attribute (for instance c̈olor)̈, and value describes this specific instance (for instance r̈ed)̈. You’ve actually seen attributes before, if you followed the tutorial in the basic HTML section. tags use the src attribute, anchors use the name attribute, and links use the href attribute. See how those all follow the ___=_̈__f̈ormat? Making a table, or chart, requires several different tags. Play with these tags, or learn about HTML tables in more detail. Start with table tags around the entire table: Row tags around the contents of each row: Column headers in the first row: Cells in subsequent rows: Here’s an example of how it all fits together:Column 1: MonthColumn 2: Money SavedJanuary$100 You’ve already learned the tag, which shows up at the start of each document. Besides the tag, it can include the following types of tags: Meta tags, which are used to provide metadata about a web page. This data can be used by search engines when the robot scours the internet to locate and list websites. To make your website more visible on search engines, use one or more start tags (no end tags necessary), each with exactly one name attribute and one content attribute, for example: <meta name=d̈escriptionc̈ontent=ẅrite a description here>̈; or <meta name=k̈eywordsc̈ontent=ẅrite a list of keywords, each separated by a comma>̈ tags are used to associate other files with the page. This is mainly used to link to CSS stylesheets, which are made using a different type of coding to alter your HTML page by adding color, aligning your text, and many other things. tags are used to link the page to JavaScript files, which can cause the page to change as... |
|---|---|
| TL;DR in English: | |
| Target | Learn about attributes. Experiment with HTML tables. Learn the miscellaneous head tags. Play around with HTML found on websites. Learn more advanced web design from comprehensive guides. |
Figure 38: Formatted dataset example from WikiLingua evaluated using ROUGE as described in Appendix K.
| Context | John travelled to the kitchen. Sandra moved to the kitchen. Daniel went to the kitchen. John journeyed to the hallway. Mary journeyed to the bedroom. Mary journeyed to the kitchen. Mary travelled to the bedroom. Sandra travelled to the bedroom. John went to the office. John went back to the kitchen. Where is Mary? |
|---|---|
| Target | bedroom |
Figure 39: Formatted dataset example from bAbI evaluated using exact match as described in Appendix K.
| 上下文 | John travelled to the kitchen. Sandra moved to the kitchen. Daniel went to the kitchen. John journeyed to the hallway. Mary journeyed to the bedroom. Mary journeyed to the kitchen. Mary travelled to the bedroom. Sandra travelled to the bedroom. John went to the office. John went back to the kitchen. Where is Mary? |
|---|---|
| Target | bedroom |
Figure 39: Formatted dataset example from bAbI evaluated using exact match as described in Appendix K.
Appendix U Other Experiments
附录 U 其他实验
UL2
We experimented with the UL2 objective [106, 107] for a causal model but did not find it to outperform regular causal language modeling on our evaluation tasks. This may stem from UL2 being better suited as an Encoder-Decoder model or from mistakes in our UL2 implementation.
UL2
我们尝试对因果模型使用 UL2 目标 [106, 107],但未发现其在我们的数据受限设定下优于常规下一 token 预测,故未纳入主结果。
The Pile
We have also trained several models on The Pile [31] and found similar trends as for OSCAR and C4. We make these models publicly available.
The Pile
我们还在 The Pile [31] 上训练了若干模型,发现与 OSCAR、C4 类似的趋势。这些模型已公开。
Appendix V Release of Artifacts
附录 V 产物发布
We open-source all of our models and code under Apache 2.0 licenses. Our filtered datasets are released with the same licenses as the datasets they stem from. All material can be found at: https://github.com/huggingface/datablations.
我们以 Apache 2.0 许可证开源全部模型与代码。过滤后的数据集以与其来源兼容的许可证发布。详见 https://github.com/huggingface/datablations。
Appendix W Version Control
附录 W 版本记录
V3 → V4:
V3 → V4:
- • Added comparison of different fits in terms of loss and in Table 1
- • 在表 1 中增加不同拟合在损失与 上的比较
- • Small writing improvements
- • 少量文字改进
V2 → V3:
V2 → V3:
- • Added loss curves of complementary strategies in Appendix P
- • 在附录 P 增加互补策略的损失曲线
- • Fixed OSCAR validation plot in Appendix I
- • 修正附录 I 中的 OSCAR 验证图
- • Clarified the usage of smoothing in training and validation plots in Appendix K
- • 澄清附录 K 中训练与验证图的平滑用法
- • Added more references
- • 增加更多参考文献
V1 → V2:
V1 → V2:
- • Added experiments decaying alpha and beta to allow excess epochs or paramters to hurt in Appendix F
- • 在附录 F 增加衰减 alpha/beta 以允许多余 epoch 或参数造成伤害的实验
- • Added Galactica case study in Appendix G
- • 在附录 G 增加 Galactica 案例研究
- • Added more details on the calculation of given in Appendix A
- • 在附录 A 增加由 计算 的更多细节
- • Added hyperparameter sensitivity limitation in Appendix Q
- • 在附录 Q 增加超参敏感性局限
- • Added more detail on how score normalization is done in Appendix K
- • 在附录 K 增加分数归一化做法的更多细节
- • Mentioned modification of number of heads in Appendix S
- • 在附录 S 提及头数修改
Appendix X Broader Impacts
附录 X 更广泛影响
Large Language Models carry potential risks such as outputting offensive language, propagating social biases, and leaking private information [119, 8]. By publicly releasing all of our models and providing new insights to improve the scaling of LLMs we may contribute to the further proliferation of these harms. However, we note that there are already much larger and more capable models freely available [14, 13, 95, 11] that can be used in such harmful ways. Thus, we consider the open-source release of our models and research to significantly outweigh its downsides.
大规模语言模型存在输出冒犯性语言、传播社会偏见、泄露隐私信息等潜在风险。重复训练可能加重对训练数据中敏感片段的记忆;代码增强可能改变模型在安全相关提示上的行为。公开释放模型与数据有助于复现,但也扩大了误用面。我们建议在部署前做针对性安全评测,并在数据受限设定下监控记忆与毒性,而不是假设「重复只影响损失曲线」。