Focal Loss for Dense Object Detection
Focal Loss for Dense Object Detection
用于密集目标检测的 Focal Loss
Tsung-Yi Lin Priya Goyal Ross Girshick Kaiming He Piotr Dollár Affiliation: Facebook AI Research (FAIR)
Abstract
摘要
The highest accuracy object detectors to date are based on a two-stage approach popularized by R-CNN, where a classifier is applied to a sparse set of candidate object locations. In contrast, one-stage detectors that are applied over a regular, dense sampling of possible object locations have the potential to be faster and simpler, but have trailed the accuracy of two-stage detectors thus far. In this paper, we investigate why this is the case. We discover that the extreme foreground-background class imbalance encountered during training of dense detectors is the central cause. We propose to address this class imbalance by reshaping the standard cross entropy loss such that it down-weights the loss assigned to well-classified examples. Our novel Focal Loss focuses training on a sparse set of hard examples and prevents the vast number of easy negatives from overwhelming the detector during training. To evaluate the effectiveness of our loss, we design and train a simple dense detector we call RetinaNet. Our results show that when trained with the focal loss, RetinaNet is able to match the speed of previous one-stage detectors while surpassing the accuracy of all existing state-of-the-art two-stage detectors. Code is at: https://github.com/facebookresearch/Detectron.
迄今准确率最高的目标检测器基于 R-CNN 推广的两阶段方法:分类器作用于稀疏的候选目标位置集合。相对之下,在规则、密集采样的可能目标位置上施加的单阶段检测器有望更快、更简单,但准确率迄今仍落后于两阶段检测器。本文探究其原因。我们发现:密集检测器训练中遭遇的极端前景–背景类别不平衡是核心原因。我们提出改写标准交叉熵损失,降低已正确分类样本的损失权重,以应对这一不平衡。新颖的 Focal Loss 把训练聚焦到稀疏的难例集合,并防止海量易负例在训练中淹没检测器。为评估该损失的有效性,我们设计并训练了称为 RetinaNet 的简单密集检测器。结果表明:用 Focal Loss 训练时,RetinaNet 能匹配先前单阶段检测器的速度,同时超越所有既有当时最优两阶段检测器的准确率。代码见:https://github.com/facebookresearch/Detectron。
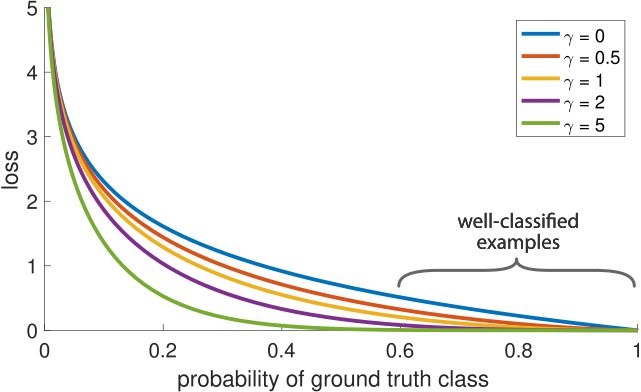
Figure 1: We propose a novel loss we term the Focal Loss that adds a factor to the standard cross entropy criterion. Setting reduces the relative loss for well-classified examples (), putting more focus on hard, misclassified examples. As our experiments will demonstrate, the proposed focal loss enables training highly accurate dense object detectors in the presence of vast numbers of easy background examples.
图 1:我们提出称为 Focal Loss 的新颖损失,在标准交叉熵准则上乘以因子 。取 会降低已正确分类样本()的相对损失,把更多注意力放在难分、误分类样本上。实验将表明:在海量易背景样本存在时,所提 Focal Loss 使训练高精度密集目标检测器成为可能。
| AP | time | |
|---|---|---|
| [A] YOLOv2† [27] | 21.6 | 25 |
| [B] SSD321 [22] | 28.0 | 61 |
| [C] DSSD321 [9] | 28.0 | 85 |
| [D] R-FCN‡ [3] | 29.9 | 85 |
| [E] SSD513 [22] | 31.2 | 125 |
| [F] DSSD513 [9] | 33.2 | 156 |
| [G] FPN FRCN [20] | 36.2 | 172 |
| RetinaNet-50-500 | 32.5 | 73 |
| RetinaNet-101-500 | 34.4 | 90 |
| RetinaNet-101-800 | 37.8 | 198 |
| †Not plotted ‡Extrapolated time |
Figure 2: Speed (ms) versus accuracy (AP) on COCO test-dev. Enabled by the focal loss, our simple one-stage RetinaNet detector outperforms all previous one-stage and two-stage detectors, including the best reported Faster R-CNN [28] system from [20]. We show variants of RetinaNet with ResNet-50-FPN (blue circles) and ResNet-101-FPN (orange diamonds) at five scales (400-800 pixels). Ignoring the low-accuracy regime (AP25), RetinaNet forms an upper envelope of all current detectors, and an improved variant (not shown) achieves 40.8 AP. Details are given in §5.
| AP | time | |
|---|---|---|
| [A] YOLOv2† [27] | 21.6 | 25 |
| [B] SSD321 [22] | 28.0 | 61 |
| [C] DSSD321 [9] | 28.0 | 85 |
| [D] R-FCN‡ [3] | 29.9 | 85 |
| [E] SSD513 [22] | 31.2 | 125 |
| [F] DSSD513 [9] | 33.2 | 156 |
| [G] FPN FRCN [20] | 36.2 | 172 |
| RetinaNet-50-500 | 32.5 | 73 |
| RetinaNet-101-500 | 34.4 | 90 |
| RetinaNet-101-800 | 37.8 | 198 |
| †未绘制 ‡外推时间 |
图 2:COCO test-dev 上速度(ms)对准确率(AP)。借助 Focal Loss,我们简单的单阶段 RetinaNet 检测器超过先前全部单阶段与两阶段检测器,包括 [20] 报告的最佳 Faster R-CNN [28] 系统。图中给出 ResNet-50-FPN(蓝圆)与 ResNet-101-FPN(橙菱)在五个尺度(400–800 像素)上的 RetinaNet 变体。忽略低准确率区间(AP25)后,RetinaNet 构成当前全部检测器的上包络;改进变体(未画出)达到 40.8 AP。细节见 §5。
1 Introduction
1 引言
Current state-of-the-art object detectors are based on a two-stage, proposal-driven mechanism. As popularized in the R-CNN framework [11], the first stage generates a sparse set of candidate object locations and the second stage classifies each candidate location as one of the foreground classes or as background using a convolutional neural network. Through a sequence of advances [10, 28, 20, 14], this two-stage framework consistently achieves top accuracy on the challenging COCO benchmark [21].
当前当时最优目标检测器基于两阶段、提议驱动的机制。如 R-CNN 框架 [11] 所推广:第一阶段生成稀疏候选目标位置集合,第二阶段用卷积神经网络把每个候选位置分类为某一前景类或背景。经一系列进展 [10, 28, 20, 14],该两阶段框架在富有挑战的 COCO 基准 [21] 上持续取得最高准确率。
Despite the success of two-stage detectors, a natural question to ask is: could a simple one-stage detector achieve similar accuracy? One stage detectors are applied over a regular, dense sampling of object locations, scales, and aspect ratios. Recent work on one-stage detectors, such as YOLO [26, 27] and SSD [22, 9], demonstrates promising results, yielding faster detectors with accuracy within 10-40% relative to state-of-the-art two-stage methods.
尽管两阶段检测器成功,一个自然问题是:简单的单阶段检测器能否达到相近准确率?单阶段检测器在规则、密集采样的目标位置、尺度与宽高比上施加。YOLO [26, 27] 与 SSD [22, 9] 等近期单阶段工作展示了有希望的结果:检测器更快,准确率相对当时最优两阶段方法约在 10–40% 以内。
This paper pushes the envelop further: we present a one-stage object detector that, for the first time, matches the state-of-the-art COCO AP of more complex two-stage detectors, such as the Feature Pyramid Network (FPN) [20] or Mask R-CNN [14] variants of Faster R-CNN [28]. To achieve this result, we identify class imbalance during training as the main obstacle impeding one-stage detector from achieving state-of-the-art accuracy and propose a new loss function that eliminates this barrier.
本文把边界再推进一步:我们提出一种单阶段目标检测器,首次匹配更复杂两阶段检测器(如 Faster R-CNN [28] 的特征金字塔网络(FPN)[20] 或 Mask R-CNN [14] 变体)的当时最优 COCO AP。为实现该结果,我们把训练中的类别不平衡识别为阻碍单阶段检测器达到当时最优准确率的主要障碍,并提出消除该障碍的新损失函数。
Class imbalance is addressed in R-CNN-like detectors by a two-stage cascade and sampling heuristics. The proposal stage (e.g., Selective Search [35], EdgeBoxes [39], DeepMask [24, 25], RPN [28]) rapidly narrows down the number of candidate object locations to a small number (e.g., 1-2k), filtering out most background samples. In the second classification stage, sampling heuristics, such as a fixed foreground-to-background ratio (1:3), or online hard example mining (OHEM) [31], are performed to maintain a manageable balance between foreground and background.
类 R-CNN 检测器通过两阶段级联与采样启发式应对类别不平衡。提议阶段(例如 Selective Search [35]、EdgeBoxes [39]、DeepMask [24, 25]、RPN [28])迅速把候选目标位置数压到较小规模(例如 1–2k),滤掉多数背景样本。在第二分类阶段,采用固定前景–背景比(1:3)或在线难例挖掘(OHEM)[31] 等采样启发式,以维持前景与背景之间可管理的平衡。
In contrast, a one-stage detector must process a much larger set of candidate object locations regularly sampled across an image. In practice this often amounts to enumerating 100k locations that densely cover spatial positions, scales, and aspect ratios. While similar sampling heuristics may also be applied, they are inefficient as the training procedure is still dominated by easily classified background examples. This inefficiency is a classic problem in object detection that is typically addressed via techniques such as bootstrapping [33, 29] or hard example mining [37, 8, 31].
相对之下,单阶段检测器必须处理在图像上规则采样的大得多的候选目标位置集合。实践中这常相当于枚举约 100k 个密集覆盖空间位置、尺度与宽高比的位置。虽也可施加类似采样启发式,但效率低,因为训练过程仍由易分类的背景样本主导。这一低效是目标检测中的经典问题,通常用 bootstrapping [33, 29] 或难例挖掘 [37, 8, 31] 等技术应对。
In this paper, we propose a new loss function that acts as a more effective alternative to previous approaches for dealing with class imbalance. The loss function is a dynamically scaled cross entropy loss, where the scaling factor decays to zero as confidence in the correct class increases, see Figure 1. Intuitively, this scaling factor can automatically down-weight the contribution of easy examples during training and rapidly focus the model on hard examples. Experiments show that our proposed Focal Loss enables us to train a high-accuracy, one-stage detector that significantly outperforms the alternatives of training with the sampling heuristics or hard example mining, the previous state-of-the-art techniques for training one-stage detectors. Finally, we note that the exact form of the focal loss is not crucial, and we show other instantiations can achieve similar results.
本文提出一种新损失函数,作为应对类别不平衡的更有效替代。该损失是动态缩放的交叉熵:随着对正确类置信度上升,缩放因子衰减到零,见图 1。直观上,该缩放因子可在训练中自动降低易例贡献,并迅速把模型聚焦到难例。实验表明,所提 Focal Loss 使我们能训练出高精度单阶段检测器,显著优于用采样启发式或难例挖掘训练的替代方案——后者是训练单阶段检测器的先前当时最优技术。最后我们指出:Focal Loss 的精确形式并非关键,并展示其他实例化也可达到相近结果。
To demonstrate the effectiveness of the proposed focal loss, we design a simple one-stage object detector called RetinaNet, named for its dense sampling of object locations in an input image. Its design features an efficient in-network feature pyramid and use of anchor boxes. It draws on a variety of recent ideas from [22, 6, 28, 20]. RetinaNet is efficient and accurate; our best model, based on a ResNet-101-FPN backbone, achieves a COCO test-dev AP of 39.1 while running at 5 fps, surpassing the previously best published single-model results from both one and two-stage detectors, see Figure 2.
为展示所提 Focal Loss 的有效性,我们设计了称为 RetinaNet 的简单单阶段目标检测器,得名于其对输入图像中目标位置的密集采样。设计特点包括高效的网络内特征金字塔与锚框使用,并汲取 [22, 6, 28, 20] 的多种近期思路。RetinaNet 高效且准确;我们最好的模型基于 ResNet-101-FPN 骨干,在 COCO test-dev 上达到 39.1 AP,同时以 5 fps 运行,超过先前已发表的单模型单阶段与两阶段最佳结果,见图 2。
2 Related Work
2 相关工作
Classic Object Detectors:
The sliding-window paradigm, in which a classifier is applied on a dense image grid, has a long and rich history. One of the earliest successes is the classic work of LeCun et al. who applied convolutional neural networks to handwritten digit recognition [19, 36]. Viola and Jones [37] used boosted object detectors for face detection, leading to widespread adoption of such models. The introduction of HOG [4] and integral channel features [5] gave rise to effective methods for pedestrian detection. DPMs [8] helped extend dense detectors to more general object categories and had top results on PASCAL [7] for many years. While the sliding-window approach was the leading detection paradigm in classic computer vision, with the resurgence of deep learning [18], two-stage detectors, described next, quickly came to dominate object detection.
经典目标检测器:
在密集图像网格上施加分类器的滑动窗口范式历史悠久。最早的成功之一是 LeCun et al. 把卷积神经网络用于手写数字识别 [19, 36]。Viola 与 Jones [37] 用提升目标检测器做人脸检测,推动此类模型广泛采用。HOG [4] 与积分通道特征 [5] 的引入催生了有效的行人检测方法。DPM [8] 帮助把密集检测器扩展到更一般的目标类别,并在 PASCAL [7] 上多年保持顶尖结果。滑动窗口曾是经典计算机视觉中的主导检测范式;随着深度学习复兴 [18],下文所述的两阶段检测器迅速主导了目标检测。
Two-stage Detectors:
The dominant paradigm in modern object detection is based on a two-stage approach. As pioneered in the Selective Search work [35], the first stage generates a sparse set of candidate proposals that should contain all objects while filtering out the majority of negative locations, and the second stage classifies the proposals into foreground classes / background. R-CNN [11] upgraded the second-stage classifier to a convolutional network yielding large gains in accuracy and ushering in the modern era of object detection. R-CNN was improved over the years, both in terms of speed [15, 10] and by using learned object proposals [6, 24, 28]. Region Proposal Networks (RPN) integrated proposal generation with the second-stage classifier into a single convolution network, forming the Faster R-CNN framework [28]. Numerous extensions to this framework have been proposed, e.g. [20, 31, 32, 16, 14].
两阶段检测器:
现代目标检测的主导范式基于两阶段方法。如 Selective Search 工作 [35] 所开创:第一阶段生成应包含全部目标并滤掉多数负位置的稀疏候选提议,第二阶段把提议分类为前景类/背景。R-CNN [11] 把第二阶段分类器升级为卷积网络,带来大幅准确率提升,开启现代目标检测时代。此后 R-CNN 在速度 [15, 10] 与使用学得目标提议 [6, 24, 28] 两方面持续改进。区域提议网络(RPN)把提议生成与第二阶段分类器集成到单一卷积网络,形成 Faster R-CNN 框架 [28]。对该框架已有大量扩展,例如 [20, 31, 32, 16, 14]。
One-stage Detectors:
OverFeat [30] was one of the first modern one-stage object detector based on deep networks. More recently SSD [22, 9] and YOLO [26, 27] have renewed interest in one-stage methods. These detectors have been tuned for speed but their accuracy trails that of two-stage methods. SSD has a 10-20% lower AP, while YOLO focuses on an even more extreme speed/accuracy trade-off. See Figure 2. Recent work showed that two-stage detectors can be made fast simply by reducing input image resolution and the number of proposals, but one-stage methods trailed in accuracy even with a larger compute budget [17]. In contrast, the aim of this work is to understand if one-stage detectors can match or surpass the accuracy of two-stage detectors while running at similar or faster speeds.
单阶段检测器:
OverFeat [30] 是最早基于深度网络的现代单阶段目标检测器之一。更近的 SSD [22, 9] 与 YOLO [26, 27] 重新激发了对单阶段方法的兴趣。这些检测器为速度做了调优,但准确率落后于两阶段方法:SSD 的 AP 低约 10–20%,YOLO 则聚焦更极端的速度/准确率权衡。见图 2。近期工作表明:两阶段检测器仅靠降低输入分辨率与提议数就能变快,但即便给更大计算预算,单阶段方法准确率仍落后 [17]。相对之下,本文目标是理解:单阶段检测器能否在相近或更快速度下匹配或超越两阶段检测器的准确率。
The design of our RetinaNet detector shares many similarities with previous dense detectors, in particular the concept of ‘anchors’ introduced by RPN [28] and use of features pyramids as in SSD [22] and FPN [20]. We emphasize that our simple detector achieves top results not based on innovations in network design but due to our novel loss.
我们 RetinaNet 检测器的设计与先前密集检测器有许多相似处,尤其是 RPN [28] 引入的「锚」概念,以及 SSD [22] 与 FPN [20] 中的特征金字塔使用。我们强调:我们简单检测器取得顶尖结果,并非基于网络设计创新,而是由于新颖损失。
Class Imbalance:
Both classic one-stage object detection methods, like boosted detectors [37, 5] and DPMs [8], and more recent methods, like SSD [22], face a large class imbalance during training. These detectors evaluate - candidate locations per image but only a few locations contain objects. This imbalance causes two problems: (1) training is inefficient as most locations are easy negatives that contribute no useful learning signal; (2) en masse, the easy negatives can overwhelm training and lead to degenerate models. A common solution is to perform some form of hard negative mining [33, 37, 8, 31, 22] that samples hard examples during training or more complex sampling/reweighing schemes [2]. In contrast, we show that our proposed focal loss naturally handles the class imbalance faced by a one-stage detector and allows us to efficiently train on all examples without sampling and without easy negatives overwhelming the loss and computed gradients.
类别不平衡:
经典单阶段目标检测方法(如提升检测器 [37, 5] 与 DPM [8])以及更近的 SSD [22] 等,训练时都面临大类别不平衡。这些检测器每图评估 – 个候选位置,但仅少数位置含目标。该不平衡造成两个问题:(1) 训练低效,因多数位置是不贡献有用学习信号的易负例;(2) 易负例整体会淹没训练并导致退化模型。常见解法是做某种形式的难负例挖掘 [33, 37, 8, 31, 22],在训练中采样难例,或采用更复杂的采样/重加权方案 [2]。相对之下,我们表明所提 Focal Loss 自然应对单阶段检测器面临的类别不平衡,使我们能高效地在全部样本上训练,无需采样,也不会被易负例淹没损失与计算梯度。
Robust Estimation:
There has been much interest in designing robust loss functions (e.g., Huber loss [13]) that reduce the contribution of outliers by down-weighting the loss of examples with large errors (hard examples). In contrast, rather than addressing outliers, our focal loss is designed to address class imbalance by down-weighting inliers (easy examples) such that their contribution to the total loss is small even if their number is large. In other words, the focal loss performs the opposite role of a robust loss: it focuses training on a sparse set of hard examples.
鲁棒估计:
设计鲁棒损失函数(例如 Huber 损失 [13])以降低离群点贡献、对大误差样本(难例)降权,一直广受关注。相对之下,我们的 Focal Loss 并非针对离群点,而是通过降低内点(易例)权重来应对类别不平衡,使其即便数量巨大,对总损失贡献仍小。换言之,Focal Loss 扮演与鲁棒损失相反的角色:把训练聚焦到稀疏的难例集合。
3 Focal Loss
The Focal Loss is designed to address the one-stage object detection scenario in which there is an extreme imbalance between foreground and background classes during training (e.g., 1:1000). We introduce the focal loss starting from the cross entropy (CE) loss for binary classification[^1]:
Focal Loss 旨在应对单阶段目标检测场景:训练中前景与背景类存在极端不平衡(例如 1:1000)。我们从二分类的交叉熵(CE)损失出发引入 Focal Loss[^1]:
$\textrm{CE}(p,y)=\begin{cases}-\log(p)&\text{ify=1$}\
-\log(1-p)&\text{otherwise.}\end{cases} \tag{1}$$
$\textrm{CE}(p,y)=\begin{cases}-\log(p)&\text{ify=1$}
-\log(1-p)&\text{otherwise.}\end{cases} \tag{1}$$
In the above specifies the ground-truth class and is the model’s estimated probability for the class with label . For notational convenience, we define :
上式中 指定真值类, 是模型对标签 的类估计概率。为记号方便,我们定义 :
$p_{\textrm{t}}=\begin{cases}p&\text{ify=1$}\
1-p&\text{otherwise,}\end{cases} \tag{2}$$
$p_{\textrm{t}}=\begin{cases}p&\text{ify=1$}
1-p&\text{otherwise,}\end{cases} \tag{2}$$
and rewrite .
并把 重写。
The CE loss can be seen as the blue (top) curve in Figure 1. One notable property of this loss, which can be easily seen in its plot, is that even examples that are easily classified () incur a loss with non-trivial magnitude. When summed over a large number of easy examples, these small loss values can overwhelm the rare class.
CE 损失可视为图 1 中蓝色(上方)曲线。该损失的一个显著性质——从图中易见——是:即便易分类样本()也会产生不可忽略量级的损失。对大量易例求和时,这些小损失值可能淹没稀有类。
3.1 Balanced Cross Entropy
3.1 平衡交叉熵
A common method for addressing class imbalance is to introduce a weighting factor for class and for class . In practice may be set by inverse class frequency or treated as a hyperparameter to set by cross validation. For notational convenience, we define analogously to how we defined . We write the -balanced CE loss as:
应对类别不平衡的常见方法是为类 1 引入权重因子 ,为类 引入 。实践中 可按逆类频设置,或作为超参由交叉验证选定。为记号方便,我们类比 定义 。-平衡 CE 损失写为:
This loss is a simple extension to CE that we consider as an experimental baseline for our proposed focal loss.
该损失是对 CE 的简单扩展,我们将其作为所提 Focal Loss 的实验基线。
3.2 Focal Loss Definition
3.2 Focal Loss 定义
As our experiments will show, the large class imbalance encountered during training of dense detectors overwhelms the cross entropy loss. Easily classified negatives comprise the majority of the loss and dominate the gradient. While balances the importance of positive/negative examples, it does not differentiate between easy/hard examples. Instead, we propose to reshape the loss function to down-weight easy examples and thus focus training on hard negatives.
实验将表明:密集检测器训练中的大类别不平衡会淹没交叉熵损失。易分类负例构成损失的主体并主导梯度。虽 能平衡正/负例重要性,却不区分易/难例。我们提出改写损失函数以降低易例权重,从而把训练聚焦到难负例。
More formally, we propose to add a modulating factor to the cross entropy loss, with tunable focusing parameter . We define the focal loss as:
更形式地,我们提议在交叉熵损失上加入调制因子 ,其中可调聚焦参数 。Focal Loss 定义为:
The focal loss is visualized for several values of in Figure 1. We note two properties of the focal loss. (1) When an example is misclassified and is small, the modulating factor is near and the loss is unaffected. As , the factor goes to 0 and the loss for well-classified examples is down-weighted. (2) The focusing parameter smoothly adjusts the rate at which easy examples are down-weighted. When , FL is equivalent to CE, and as is increased the effect of the modulating factor is likewise increased (we found to work best in our experiments).
图 1 给出若干 取值下的 Focal Loss。我们指出两个性质。(1) 当样本被误分类且 较小时,调制因子接近 1,损失不受影响;随着 ,因子趋于 0,已正确分类样本的损失被降权。(2) 聚焦参数 平滑调节易例被降权的速率。 时 FL 等价于 CE;增大 时调制因子作用随之增强(实验中发现 最佳)。
Intuitively, the modulating factor reduces the loss contribution from easy examples and extends the range in which an example receives low loss. For instance, with , an example classified with would have lower loss compared with CE and with it would have lower loss. This in turn increases the importance of correcting misclassified examples (whose loss is scaled down by at most for and ).
直观上,调制因子降低易例的损失贡献,并扩展样本获得低损失的区间。例如 时, 的样本相对 CE 损失约低 ; 时约低 。这反过来提高了纠正误分类样本的重要性(对 且 ,其损失最多被缩小约 )。
In practice we use an -balanced variant of the focal loss:
实践中我们使用 -平衡形式的 Focal Loss:
We adopt this form in our experiments as it yields slightly improved accuracy over the non--balanced form. Finally, we note that the implementation of the loss layer combines the sigmoid operation for computing with the loss computation, resulting in greater numerical stability.
实验采用该形式,因其相对非 -平衡形式准确率略高。最后指出:损失层实现把计算 的 sigmoid 与损失计算合并,以获得更好数值稳定性。
While in our main experimental results we use the focal loss definition above, its precise form is not crucial. In the appendix we consider other instantiations of the focal loss and demonstrate that these can be equally effective.
虽主要实验结果使用上述 Focal Loss 定义,其精确形式并非关键。附录中我们考虑其他 Focal Loss 实例化,并表明它们同样有效。
3.3 Class Imbalance and Model Initialization
3.3 类别不平衡与模型初始化
Binary classification models are by default initialized to have equal probability of outputting either or . Under such an initialization, in the presence of class imbalance, the loss due to the frequent class can dominate total loss and cause instability in early training. To counter this, we introduce the concept of a ‘prior’ for the value of estimated by the model for the rare class (foreground) at the start of training. We denote the prior by and set it so that the model’s estimated for examples of the rare class is low, e.g. . We note that this is a change in model initialization (see §4.1) and not of the loss function. We found this to improve training stability for both the cross entropy and focal loss in the case of heavy class imbalance.
二分类模型默认初始化为输出 或 的概率相等。在类别不平衡下,此种初始化会使频繁类的损失主导总损失,并在训练早期造成不稳定。为应对,我们引入模型在训练开始时对稀有类(前景)估计的 的「先验」概念。先验记为 ,设得使模型对稀有类样本估计的 较低,例如 。注意这是模型初始化的改变(见 §4.1),并非损失函数本身。我们发现:在重度类别不平衡下,这对交叉熵与 Focal Loss 的训练稳定性都有帮助。
3.4 Class Imbalance and Two-stage Detectors
3.4 类别不平衡与两阶段检测器
Two-stage detectors are often trained with the cross entropy loss without use of -balancing or our proposed loss. Instead, they address class imbalance through two mechanisms: (1) a two-stage cascade and (2) biased minibatch sampling. The first cascade stage is an object proposal mechanism [35, 24, 28] that reduces the nearly infinite set of possible object locations down to one or two thousand. Importantly, the selected proposals are not random, but are likely to correspond to true object locations, which removes the vast majority of easy negatives. When training the second stage, biased sampling is typically used to construct minibatches that contain, for instance, a 1:3 ratio of positive to negative examples. This ratio is like an implicit -balancing factor that is implemented via sampling. Our proposed focal loss is designed to address these mechanisms in a one-stage detection system directly via the loss function.
两阶段检测器常用交叉熵损失训练,而不使用 -平衡或我们提出的损失。它们通过两种机制应对类别不平衡:(1) 两阶段级联;(2) 有偏小批量采样。第一级联阶段是目标提议机制 [35, 24, 28],把近乎无限的可能目标位置压到一两千个。重要的是:所选提议并非随机,而很可能对应真实目标位置,从而去掉绝大多数易负例。训练第二阶段时,通常用有偏采样构造例如正负比 1:3 的小批量。该比率类似通过采样实现的隐式 -平衡因子。所提 Focal Loss 旨在单阶段检测系统中直接经由损失函数应对这些机制。
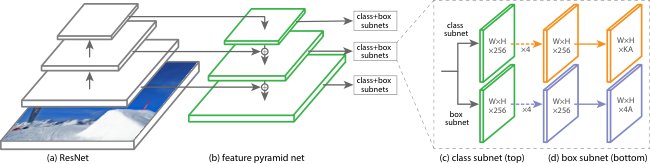
Figure 3: The one-stage RetinaNet network architecture uses a Feature Pyramid Network (FPN) [20] backbone on top of a feedforward ResNet architecture [16] (a) to generate a rich, multi-scale convolutional feature pyramid (b). To this backbone RetinaNet attaches two subnetworks, one for classifying anchor boxes (c) and one for regressing from anchor boxes to ground-truth object boxes (d). The network design is intentionally simple, which enables this work to focus on a novel focal loss function that eliminates the accuracy gap between our one-stage detector and state-of-the-art two-stage detectors like Faster R-CNN with FPN [20] while running at faster speeds.
图 3:单阶段 RetinaNet 网络架构在前馈 ResNet 架构 [16](a)之上使用特征金字塔网络(FPN)[20] 骨干,以生成丰富的多尺度卷积特征金字塔(b)。在此骨干上,RetinaNet 挂接两个子网络:一个用于分类锚框(c),一个用于从锚框回归到真值目标框(d)。网络设计刻意保持简单,使本文能聚焦于新颖的 Focal Loss 函数——它消除了我们的单阶段检测器与 Faster R-CNN with FPN [20] 等当时最优两阶段检测器之间的准确率差距,同时以更快速度运行。
4 RetinaNet Detector
4 RetinaNet 检测器
RetinaNet is a single, unified network composed of a backbone network and two task-specific subnetworks. The backbone is responsible for computing a convolutional feature map over an entire input image and is an off-the-self convolutional network. The first subnet performs convolutional object classification on the backbone’s output; the second subnet performs convolutional bounding box regression. The two subnetworks feature a simple design that we propose specifically for one-stage, dense detection, see Figure 3. While there are many possible choices for the details of these components, most design parameters are not particularly sensitive to exact values as shown in the experiments. We describe each component of RetinaNet next.
RetinaNet 是由骨干网络与两个任务专用子网络组成的单一统一网络。骨干负责在整幅输入图像上计算卷积特征图,是现成的卷积网络。第一子网在骨干输出上做卷积目标分类;第二子网做卷积边界框回归。两子网采用我们专为单阶段密集检测提出的简单设计,见图 3。虽这些组件细节有许多可能选择,实验表明多数设计参数对精确取值并不特别敏感。下文依次描述 RetinaNet 各组件。
Feature Pyramid Network Backbone:
We adopt the Feature Pyramid Network (FPN) from [20] as the backbone network for RetinaNet. In brief, FPN augments a standard convolutional network with a top-down pathway and lateral connections so the network efficiently constructs a rich, multi-scale feature pyramid from a single resolution input image, see Figure 3(a)-(b). Each level of the pyramid can be used for detecting objects at a different scale. FPN improves multi-scale predictions from fully convolutional networks (FCN) [23], as shown by its gains for RPN [28] and DeepMask-style proposals [24], as well at two-stage detectors such as Fast R-CNN [10] or Mask R-CNN [14].
特征金字塔网络骨干:
我们采用 [20] 的特征金字塔网络(FPN)作为 RetinaNet 骨干。简言之,FPN 用自上而下路径与横向连接增强标准卷积网络,使网络从单一分辨率输入图像高效构建丰富的多尺度特征金字塔,见图 3(a)-(b)。金字塔每一层可用于检测不同尺度的目标。FPN 改进了全卷积网络(FCN)[23] 的多尺度预测,其对 RPN [28] 与 DeepMask 风格提议 [24] 以及 Fast R-CNN [10] 或 Mask R-CNN [14] 等两阶段检测器的收益已表明这一点。
Following [20], we build FPN on top of the ResNet architecture [16]. We construct a pyramid with levels through , where indicates pyramid level ( has resolution lower than the input). As in [20] all pyramid levels have channels. Details of the pyramid generally follow [20] with a few modest differences.[^2] While many design choices are not crucial, we emphasize the use of the FPN backbone is; preliminary experiments using features from only the final ResNet layer yielded low AP.
遵循 [20],我们在 ResNet 架构 [16] 之上构建 FPN。金字塔含 至 ,其中 表示金字塔层级( 分辨率比输入低 )。与 [20] 相同,所有金字塔层有 通道。金字塔细节大体遵循 [20],有若干适度差异。[^2] 虽许多设计选择并非关键,我们强调使用 FPN 骨干是关键的;仅用最终 ResNet 层特征的初步实验 AP 很低。
Anchors:
We use translation-invariant anchor boxes similar to those in the RPN variant in [20]. The anchors have areas of to on pyramid levels to , respectively. As in [20], at each pyramid level we use anchors at three aspect ratios : :, :. For denser scale coverage than in [20], at each level we add anchors of sizes {, , } of the original set of 3 aspect ratio anchors. This improve AP in our setting. In total there are anchors per level and across levels they cover the scale range 32 - 813 pixels with respect to the network’s input image.
锚:
我们使用与 [20] 中 RPN 变体类似的平移不变锚框。锚在金字塔层 至 上面积分别为 至 。与 [20] 相同,每层使用三种宽高比 : :, : 的锚。为比 [20] 更密地覆盖尺度,每层再为原有 3 种宽高比锚增加尺寸 {, , }。这在我们的设定下提升了 AP。总计每层 个锚,跨层相对网络输入图像覆盖 32–813 像素尺度范围。
Each anchor is assigned a length one-hot vector of classification targets, where is the number of object classes, and a 4-vector of box regression targets. We use the assignment rule from RPN [28] but modified for multi-class detection and with adjusted thresholds. Specifically, anchors are assigned to ground-truth object boxes using an intersection-over-union (IoU) threshold of 0.5; and to background if their IoU is in [0, 0.4). As each anchor is assigned to at most one object box, we set the corresponding entry in its length label vector to and all other entries to . If an anchor is unassigned, which may happen with overlap in [0.4, 0.5), it is ignored during training. Box regression targets are computed as the offset between each anchor and its assigned object box, or omitted if there is no assignment.
每个锚被赋予长度为 的 one-hot 分类目标向量( 为目标类别数)以及 4 维框回归目标。我们使用来自 RPN [28] 的分配规则,但为多类检测做了修改并调整阈值。具体地:锚与真值目标框的交并比(IoU)阈值为 0.5 时分配为正;IoU 在 [0, 0.4) 时分配为背景。因每个锚至多分配给一个目标框,我们在其长度 标签向量的对应项置 1、其余置 0。若锚未分配(可能发生在重叠位于 [0.4, 0.5) 时),训练中忽略之。框回归目标算作各锚与其分配目标框之间的偏移;无分配则省略。
Classification Subnet:
The classification subnet predicts the probability of object presence at each spatial position for each of the anchors and object classes. This subnet is a small FCN attached to each FPN level; parameters of this subnet are shared across all pyramid levels. Its design is simple. Taking an input feature map with channels from a given pyramid level, the subnet applies four 33 conv layers, each with filters and each followed by ReLU activations, followed by a 33 conv layer with filters. Finally sigmoid activations are attached to output the binary predictions per spatial location, see Figure 3 (c). We use and in most experiments.
分类子网:
分类子网预测每个空间位置上、对每个 锚与 目标类的目标存在概率。该子网是挂在每个 FPN 层上的小型 FCN;参数跨所有金字塔层共享。设计简单:取给定金字塔层带 通道的输入特征图,施加四个 33 卷积层(各有 个滤波器、后接 ReLU),再接一个带 个滤波器的 33 卷积层;最后接 sigmoid,在每个空间位置输出 个二元预测,见图 3(c)。多数实验用 、。
In contrast to RPN [28], our object classification subnet is deeper, uses only 33 convs, and does not share parameters with the box regression subnet (described next). We found these higher-level design decisions to be more important than specific values of hyperparameters.
相对 RPN [28],我们的目标分类子网更深、仅用 33 卷积,且不与框回归子网(下节)共享参数。我们发现这些高层设计决策比超参的具体取值更重要。
Box Regression Subnet:
In parallel with the object classification subnet, we attach another small FCN to each pyramid level for the purpose of regressing the offset from each anchor box to a nearby ground-truth object, if one exists. The design of the box regression subnet is identical to the classification subnet except that it terminates in linear outputs per spatial location, see Figure 3 (d). For each of the anchors per spatial location, these outputs predict the relative offset between the anchor and the ground-truth box (we use the standard box parameterization from R-CNN [11]). We note that unlike most recent work, we use a class-agnostic bounding box regressor which uses fewer parameters and we found to be equally effective. The object classification subnet and the box regression subnet, though sharing a common structure, use separate parameters.
框回归子网:
与目标分类子网并行,我们在每个金字塔层再挂一个小型 FCN,用于把每个锚框回归到附近真值目标(若存在)的偏移。框回归子网设计与分类子网相同,只是每个空间位置终止于 个线性输出,见图 3(d)。对每个空间位置的 个锚,这 4 个输出预测锚与真值框的相对偏移(我们使用 R-CNN [11] 的标准框参数化)。注意与多数近期工作不同,我们使用与类无关的边界框回归器,参数更少,且我们发现效果相当。目标分类子网与框回归子网虽结构共通,但使用独立参数。
4.1 Inference and Training
4.1 推理与训练
Inference:
RetinaNet forms a single FCN comprised of a ResNet-FPN backbone, a classification subnet, and a box regression subnet, see Figure 3. As such, inference involves simply forwarding an image through the network. To improve speed, we only decode box predictions from at most 1k top-scoring predictions per FPN level, after thresholding detector confidence at 0.05. The top predictions from all levels are merged and non-maximum suppression with a threshold of 0.5 is applied to yield the final detections.
推理:
RetinaNet 形成由 ResNet-FPN 骨干、分类子网与框回归子网组成的单一 FCN,见图 3。因此推理只需把图像前向通过网络。为提速,我们在检测器置信度阈值 0.05 后,每 FPN 层最多解码 1k 个最高分预测。合并各层最高预测,再以阈值 0.5 做非极大值抑制,得到最终检测。
Focal Loss:
We use the focal loss introduced in this work as the loss on the output of the classification subnet. As we will show in §5, we find that works well in practice and the RetinaNet is relatively robust to . We emphasize that when training RetinaNet, the focal loss is applied to all 100k anchors in each sampled image. This stands in contrast to common practice of using heuristic sampling (RPN) or hard example mining (OHEM, SSD) to select a small set of anchors (e.g., 256) for each minibatch. The total focal loss of an image is computed as the sum of the focal loss over all 100k anchors, normalized by the number of anchors assigned to a ground-truth box. We perform the normalization by the number of assigned anchors, not total anchors, since the vast majority of anchors are easy negatives and receive negligible loss values under the focal loss. Finally we note that , the weight assigned to the rare class, also has a stable range, but it interacts with making it necessary to select the two together (see Tables 1a and 1b). In general should be decreased slightly as is increased (for , works best).
Focal Loss:
我们用本文引入的 Focal Loss 作为分类子网输出上的损失。如 §5 将表明, 在实践中效果良好,且 RetinaNet 对 相对稳健。我们强调:训练 RetinaNet 时,Focal Loss 施加于每张采样图像中的全部约 100k 个锚。这与用启发式采样(RPN)或难例挖掘(OHEM、SSD)为每个小批量选取小锚集合(例如 256)的常见做法形成对比。一幅图像的总 Focal Loss 算作全部约 100k 个锚上 Focal Loss 之和,再按分配给真值框的锚数归一化。我们按已分配锚数而非总锚数归一化,因为绝大多数锚是易负例,在 Focal Loss 下损失值可忽略。最后指出:赋给稀有类的权重 也有稳定范围,但它与 相互作用,需一并选定(见表 1a 与 1b)。一般应随 增大略降 (对 , 最佳)。
| AP | AP50 | AP75 | |
|---|---|---|---|
| .10 | 0.0 | 0.0 | 0.0 |
| .25 | 10.8 | 16.0 | 11.7 |
| .50 | 30.2 | 46.7 | 32.8 |
| .75 | 31.1 | 49.4 | 33.0 |
| .90 | 30.8 | 49.7 | 32.3 |
| .99 | 28.7 | 47.4 | 29.9 |
| .999 | 25.1 | 41.7 | 26.1 |
| AP | AP50 | AP75 | ||
|---|---|---|---|---|
| 0 | .75 | 31.1 | 49.4 | 33.0 |
| 0.1 | .75 | 31.4 | 49.9 | 33.1 |
| 0.2 | .75 | 31.9 | 50.7 | 33.4 |
| 0.5 | .50 | 32.9 | 51.7 | 35.2 |
| 1.0 | .25 | 33.7 | 52.0 | 36.2 |
| 2.0 | .25 | 34.0 | 52.5 | 36.5 |
| 5.0 | .25 | 32.2 | 49.6 | 34.8 |
| #sc | #ar | AP | AP50 | AP75 |
|---|---|---|---|---|
| 1 | 1 | 30.3 | 49.0 | 31.8 |
| 2 | 1 | 31.9 | 50.0 | 34.0 |
| 3 | 1 | 31.8 | 49.4 | 33.7 |
| 1 | 3 | 32.4 | 52.3 | 33.9 |
| 2 | 3 | 34.2 | 53.1 | 36.5 |
| 3 | 3 | 34.0 | 52.5 | 36.5 |
| 4 | 3 | 33.8 | 52.1 | 36.2 |
| method | batch | nms | AP | AP50 | AP75 |
|---|---|---|---|---|---|
| size | thr | ||||
| OHEM | 128 | .7 | 31.1 | 47.2 | 33.2 |
| OHEM | 256 | .7 | 31.8 | 48.8 | 33.9 |
| OHEM | 512 | .7 | 30.6 | 47.0 | 32.6 |
| OHEM | 128 | .5 | 32.8 | 50.3 | 35.1 |
| OHEM | 256 | .5 | 31.0 | 47.4 | 33.0 |
| OHEM | 512 | .5 | 27.6 | 42.0 | 29.2 |
| OHEM 1:3 | 128 | .5 | 31.1 | 47.2 | 33.2 |
| OHEM 1:3 | 256 | .5 | 28.3 | 42.4 | 30.3 |
| OHEM 1:3 | 512 | .5 | 24.0 | 35.5 | 25.8 |
| FL | n/a | n/a | 36.0 | 54.9 | 38.7 |
| depth | scale | AP | AP50 | AP75 | APS | APM | APL | time |
|---|---|---|---|---|---|---|---|---|
| 50 | 400 | 30.5 | 47.8 | 32.7 | 11.2 | 33.8 | 46.1 | 64 |
| 50 | 500 | 32.5 | 50.9 | 34.8 | 13.9 | 35.8 | 46.7 | 72 |
| 50 | 600 | 34.3 | 53.2 | 36.9 | 16.2 | 37.4 | 47.4 | 98 |
| 50 | 700 | 35.1 | 54.2 | 37.7 | 18.0 | 39.3 | 46.4 | 121 |
| 50 | 800 | 35.7 | 55.0 | 38.5 | 18.9 | 38.9 | 46.3 | 153 |
| 101 | 400 | 31.9 | 49.5 | 34.1 | 11.6 | 35.8 | 48.5 | 81 |
| 101 | 500 | 34.4 | 53.1 | 36.8 | 14.7 | 38.5 | 49.1 | 90 |
| 101 | 600 | 36.0 | 55.2 | 38.7 | 17.4 | 39.6 | 49.7 | 122 |
| 101 | 700 | 37.1 | 56.6 | 39.8 | 19.1 | 40.6 | 49.4 | 154 |
| 101 | 800 | 37.8 | 57.5 | 40.8 | 20.2 | 41.1 | 49.2 | 198 |
(a) Varying for CE loss ()
| AP | AP50 | AP75 | |
|---|---|---|---|
| .10 | 0.0 | 0.0 | 0.0 |
| .25 | 10.8 | 16.0 | 11.7 |
| .50 | 30.2 | 46.7 | 32.8 |
| .75 | 31.1 | 49.4 | 33.0 |
| .90 | 30.8 | 49.7 | 32.3 |
| .99 | 28.7 | 47.4 | 29.9 |
| .999 | 25.1 | 41.7 | 26.1 |
| AP | AP50 | AP75 | ||
|---|---|---|---|---|
| 0 | .75 | 31.1 | 49.4 | 33.0 |
| 0.1 | .75 | 31.4 | 49.9 | 33.1 |
| 0.2 | .75 | 31.9 | 50.7 | 33.4 |
| 0.5 | .50 | 32.9 | 51.7 | 35.2 |
| 1.0 | .25 | 33.7 | 52.0 | 36.2 |
| 2.0 | .25 | 34.0 | 52.5 | 36.5 |
| 5.0 | .25 | 32.2 | 49.6 | 34.8 |
| #sc | #ar | AP | AP50 | AP75 |
|---|---|---|---|---|
| 1 | 1 | 30.3 | 49.0 | 31.8 |
| 2 | 1 | 31.9 | 50.0 | 34.0 |
| 3 | 1 | 31.8 | 49.4 | 33.7 |
| 1 | 3 | 32.4 | 52.3 | 33.9 |
| 2 | 3 | 34.2 | 53.1 | 36.5 |
| 3 | 3 | 34.0 | 52.5 | 36.5 |
| 4 | 3 | 33.8 | 52.1 | 36.2 |
| method | batch | nms | AP | AP50 | AP75 |
|---|---|---|---|---|---|
| size | thr | ||||
| OHEM | 128 | .7 | 31.1 | 47.2 | 33.2 |
| OHEM | 256 | .7 | 31.8 | 48.8 | 33.9 |
| OHEM | 512 | .7 | 30.6 | 47.0 | 32.6 |
| OHEM | 128 | .5 | 32.8 | 50.3 | 35.1 |
| OHEM | 256 | .5 | 31.0 | 47.4 | 33.0 |
| OHEM | 512 | .5 | 27.6 | 42.0 | 29.2 |
| OHEM 1:3 | 128 | .5 | 31.1 | 47.2 | 33.2 |
| OHEM 1:3 | 256 | .5 | 28.3 | 42.4 | 30.3 |
| OHEM 1:3 | 512 | .5 | 24.0 | 35.5 | 25.8 |
| FL | n/a | n/a | 36.0 | 54.9 | 38.7 |
| depth | scale | AP | AP50 | AP75 | APS | APM | APL | time |
|---|---|---|---|---|---|---|---|---|
| 50 | 400 | 30.5 | 47.8 | 32.7 | 11.2 | 33.8 | 46.1 | 64 |
| 50 | 500 | 32.5 | 50.9 | 34.8 | 13.9 | 35.8 | 46.7 | 72 |
| 50 | 600 | 34.3 | 53.2 | 36.9 | 16.2 | 37.4 | 47.4 | 98 |
| 50 | 700 | 35.1 | 54.2 | 37.7 | 18.0 | 39.3 | 46.4 | 121 |
| 50 | 800 | 35.7 | 55.0 | 38.5 | 18.9 | 38.9 | 46.3 | 153 |
| 101 | 400 | 31.9 | 49.5 | 34.1 | 11.6 | 35.8 | 48.5 | 81 |
| 101 | 500 | 34.4 | 53.1 | 36.8 | 14.7 | 38.5 | 49.1 | 90 |
| 101 | 600 | 36.0 | 55.2 | 38.7 | 17.4 | 39.6 | 49.7 | 122 |
| 101 | 700 | 37.1 | 56.6 | 39.8 | 19.1 | 40.6 | 49.4 | 154 |
| 101 | 800 | 37.8 | 57.5 | 40.8 | 20.2 | 41.1 | 49.2 | 198 |
(a) 改变 CE 损失的 ()
Initialization:
We experiment with ResNet-50-FPN and ResNet-101-FPN backbones [20]. The base ResNet-50 and ResNet-101 models are pre-trained on ImageNet1k; we use the models released by [16]. New layers added for FPN are initialized as in [20]. All new conv layers except the final one in the RetinaNet subnets are initialized with bias and a Gaussian weight fill with . For the final conv layer of the classification subnet, we set the bias initialization to , where specifies that at the start of training every anchor should be labeled as foreground with confidence of . We use in all experiments, although results are robust to the exact value. As explained in §3.3, this initialization prevents the large number of background anchors from generating a large, destabilizing loss value in the first iteration of training.
初始化:
我们实验 ResNet-50-FPN 与 ResNet-101-FPN 骨干 [20]。基础 ResNet-50 与 ResNet-101 在 ImageNet1k 上预训练;使用 [16] 发布的模型。为 FPN 新增的层按 [20] 初始化。RetinaNet 子网中除最后一层外的全部新卷积层,偏置 ,权重用 的高斯填充。对分类子网最后卷积层,把偏置初始化设为 ,其中 指定训练开始时每个锚应以约 的置信度标为前景。全部实验用 ,结果对精确取值稳健。如 §3.3 所释,该初始化防止大量背景锚在训练第一次迭代产生巨大、破坏稳定的损失值。
Optimization:
RetinaNet is trained with stochastic gradient descent (SGD). We use synchronized SGD over 8 GPUs with a total of 16 images per minibatch (2 images per GPU). Unless otherwise specified, all models are trained for 90k iterations with an initial learning rate of 0.01, which is then divided by 10 at 60k and again at 80k iterations. We use horizontal image flipping as the only form of data augmentation unless otherwise noted. Weight decay of 0.0001 and momentum of 0.9 are used. The training loss is the sum the focal loss and the standard smooth loss used for box regression [10]. Training time ranges between 10 and 35 hours for the models in Table 1e.
优化:
RetinaNet 用随机梯度下降(SGD)训练。我们在 8 块 GPU 上同步 SGD,每小批量共 16 张图像(每 GPU 2 张)。除非另有说明,全部模型训练 90k 次迭代,初始学习率 0.01,在 60k 与 80k 迭代时各除以 10。除非另注,唯一数据增强是水平翻转。权重衰减 0.0001,动量 0.9。训练损失是 Focal Loss 与用于框回归的标准 smooth 损失 [10] 之和。表 1e 中模型的训练时间约在 10 到 35 小时之间。
5 Experiments
5 实验
We present experimental results on the bounding box detection track of the challenging COCO benchmark [21]. For training, we follow common practice [1, 20] and use the COCO trainval35k split (union of 80k images from train and a random 35k subset of images from the 40k image val split). We report lesion and sensitivity studies by evaluating on the minival split (the remaining 5k images from val). For our main results, we report COCO AP on the test-dev split, which has no public labels and requires use of the evaluation server.
我们在富有挑战的 COCO 基准 [21] 的边界框检测赛道上给出实验结果。训练遵循常见做法 [1, 20],使用 COCO trainval35k 划分(80k 张 train 图像与 40k 张 val 中随机 35k 子集的并集)。病灶与敏感性研究在 minival 划分(val 剩余 5k 张)上评估。主要结果报告 test-dev 划分上的 COCO AP;该划分无公开标签,需使用评测服务器。
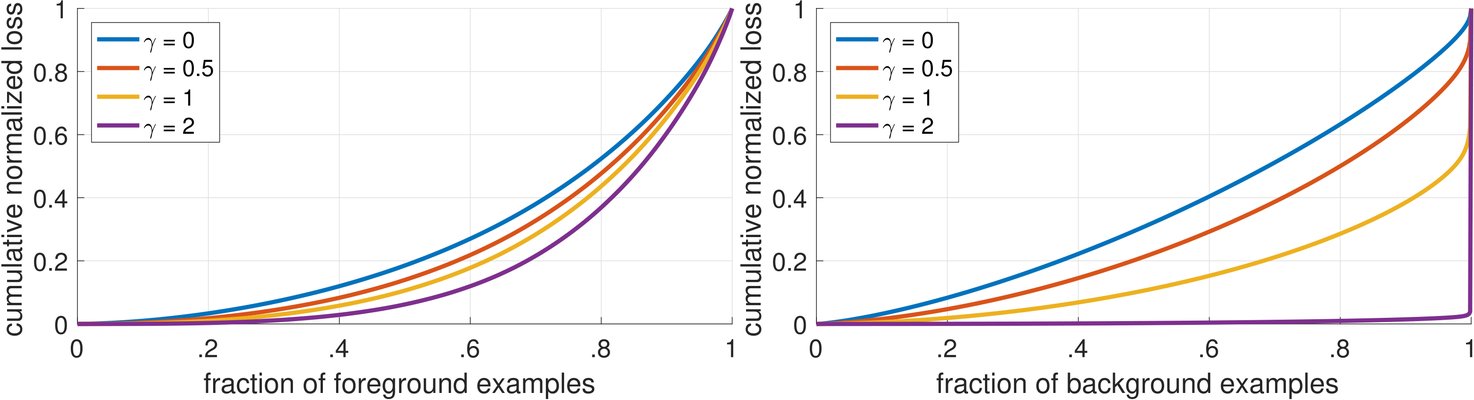
Figure 4: Cumulative distribution functions of the normalized loss for positive and negative samples for different values of for a converged model. The effect of changing on the distribution of the loss for positive examples is minor. For negatives, however, increasing heavily concentrates the loss on hard examples, focusing nearly all attention away from easy negatives.
图 4:已收敛模型在不同 下,正负样本归一化损失的累积分布函数。改变 对正例损失分布影响轻微;对负例则增大 会把损失强烈集中到难例上,几乎把全部注意力从易负例上移开。
5.1 Training Dense Detection
5.1 训练密集检测
We run numerous experiments to analyze the behavior of the loss function for dense detection along with various optimization strategies. For all experiments we use depth 50 or 101 ResNets [16] with a Feature Pyramid Network (FPN) [20] constructed on top. For all ablation studies we use an image scale of 600 pixels for training and testing.
我们做大量实验,分析密集检测损失函数行为及多种优化策略。全部实验使用深度 50 或 101 的 ResNet [16],其上构建特征金字塔网络(FPN)[20]。全部消融研究训练与测试图像尺度为 600 像素。
Network Initialization:
Our first attempt to train RetinaNet uses standard cross entropy (CE) loss without any modifications to the initialization or learning strategy. This fails quickly, with the network diverging during training. However, simply initializing the last layer of our model such that the prior probability of detecting an object is (see §4.1) enables effective learning. Training RetinaNet with ResNet-50 and this initialization already yields a respectable AP of 30.2 on COCO. Results are insensitive to the exact value of so we use for all experiments.
网络初始化:
我们首次尝试用标准交叉熵(CE)损失训练 RetinaNet,不对初始化或学习策略做任何修改。这很快失败,网络在训练中发散。然而,仅把模型最后一层初始化为检测目标的先验概率 (见 §4.1),即可有效学习。用 ResNet-50 与该初始化训练 RetinaNet,已在 COCO 上得到可观的 30.2 AP。结果对 精确取值不敏感,故全部实验用 。
Balanced Cross Entropy:
Our next attempt to improve learning involved using the -balanced CE loss described in §3.1. Results for various are shown in Table 1a. Setting gives a gain of 0.9 points AP.
平衡交叉熵:
下一步改进学习的尝试是使用 §3.1 所述 -平衡 CE 损失。不同 结果见表 1a。取 可获得 0.9 点 AP 提升。
Focal Loss:
Results using our proposed focal loss are shown in Table 1b. The focal loss introduces one new hyperparameter, the focusing parameter , that controls the strength of the modulating term. When , our loss is equivalent to the CE loss. As increases, the shape of the loss changes so that “easy” examples with low loss get further discounted, see Figure 1. FL shows large gains over CE as is increased. With , FL yields a 2.9 AP improvement over the -balanced CE loss.
Focal Loss:
使用所提 Focal Loss 的结果见表 1b。Focal Loss 引入一个新超参——控制调制项强度的聚焦参数 。 时我们的损失等价于 CE。随 增大,损失形状改变,使低损失的「易」例被进一步折扣,见图 1。随 增大,FL 相对 CE 有大幅收益。取 时,FL 相对 -平衡 CE 损失提升 2.9 AP。
For the experiments in Table 1b, for a fair comparison we find the best for each . We observe that lower ’s are selected for higher ’s (as easy negatives are down-weighted, less emphasis needs to be placed on the positives). Overall, however, the benefit of changing is much larger, and indeed the best ’s ranged in just [.25,.75] (we tested ). We use with for all experiments but works nearly as well (.4 AP lower).
对表 1b 实验,为公平比较,我们为每个 找最佳 。观察到较高 对应较低 (易负例被降权后,对正例的强调可减弱)。总体而言,改变 的收益大得多;最佳 仅落在 [.25,.75](我们测试了 )。除特别说明外全部实验用 、,但 几乎同样好(低 0.4 AP)。
Analysis of the Focal Loss:
To understand the focal loss better, we analyze the empirical distribution of the loss of a converged model. For this, we take take our default ResNet-101 600-pixel model trained with (which has 36.0 AP). We apply this model to a large number of random images and sample the predicted probability for negative windows and positive windows. Next, separately for positives and negatives, we compute FL for these samples, and normalize the loss such that it sums to one. Given the normalized loss, we can sort the loss from lowest to highest and plot its cumulative distribution function (CDF) for both positive and negative samples and for different settings for (even though model was trained with ).
Focal Loss 分析:
为更好理解 Focal Loss,我们分析已收敛模型损失的经验分布。取默认 ResNet-101 600 像素、以 训练的模型(36.0 AP)。将该模型施加于大量随机图像,采样约 个负窗口与约 个正窗口的预测概率。接着分别对正负例计算这些样本的 FL,并把损失归一化使和为 1。给定归一化损失,可按从低到高排序,画出正负样本在不同 设定下的累积分布函数(CDF)(尽管模型以 训练)。
Cumulative distribution functions for positive and negative samples are shown in Figure 4. If we observe the positive samples, we see that the CDF looks fairly similar for different values of . For example, approximately 20% of the hardest positive samples account for roughly half of the positive loss, as increases more of the loss gets concentrated in the top 20% of examples, but the effect is minor.
正负样本的累积分布函数见图 4。观察正例可见:不同 下 CDF 相当相似。例如约 20% 最难正例约占正例损失一半;随 增大,更多损失集中到前 20% 样本,但影响轻微。
The effect of on negative samples is dramatically different. For , the positive and negative CDFs are quite similar. However, as increases, substantially more weight becomes concentrated on the hard negative examples. In fact, with (our default setting), the vast majority of the loss comes from a small fraction of samples. As can be seen, FL can effectively discount the effect of easy negatives, focusing all attention on the hard negative examples.
对负例的影响截然不同。 时正负 CDF 相当接近;随 增大,显著更多权重集中到难负例。事实上,取 (我们的默认设定)时,损失的绝大多数来自一小部分样本。可见 FL 能有效折扣易负例的影响,把全部注意力聚焦到难负例。
| backbone | AP | AP50 | AP75 | APS | APM | APL | |
|---|---|---|---|---|---|---|---|
| Two-stage methods | |||||||
| Faster R-CNN+++ [16] | ResNet-101-C4 | 34.9 | 55.7 | 37.4 | 15.6 | 38.7 | 50.9 |
| Faster R-CNN w FPN [20] | ResNet-101-FPN | 36.2 | 59.1 | 39.0 | 18.2 | 39.0 | 48.2 |
| Faster R-CNN by G-RMI [17] | Inception-ResNet-v2 [34] | 34.7 | 55.5 | 36.7 | 13.5 | 38.1 | 52.0 |
| Faster R-CNN w TDM [32] | Inception-ResNet-v2-TDM | 36.8 | 57.7 | 39.2 | 16.2 | 39.8 | 52.1 |
| One-stage methods | |||||||
| YOLOv2 [27] | DarkNet-19 [27] | 21.6 | 44.0 | 19.2 | 5.0 | 22.4 | 35.5 |
| SSD513 [22, 9] | ResNet-101-SSD | 31.2 | 50.4 | 33.3 | 10.2 | 34.5 | 49.8 |
| DSSD513 [9] | ResNet-101-DSSD | 33.2 | 53.3 | 35.2 | 13.0 | 35.4 | 51.1 |
| RetinaNet (ours) | ResNet-101-FPN | 39.1 | 59.1 | 42.3 | 21.8 | 42.7 | 50.2 |
| RetinaNet (ours) | ResNeXt-101-FPN | 40.8 | 61.1 | 44.1 | 24.1 | 44.2 | 51.2 |
Table 2: Object detection single-model results (bounding box AP), vs. state-of-the-art on COCO test-dev. We show results for our RetinaNet-101-800 model, trained with scale jitter and for 1.5 longer than the same model from Table 1e. Our model achieves top results, outperforming both one-stage and two-stage models. For a detailed breakdown of speed versus accuracy see Table 1e and Figure 2.
| backbone | AP | AP50 | AP75 | APS | APM | APL | |
|---|---|---|---|---|---|---|---|
| 两阶段方法 | |||||||
| Faster R-CNN+++ [16] | ResNet-101-C4 | 34.9 | 55.7 | 37.4 | 15.6 | 38.7 | 50.9 |
| Faster R-CNN w FPN [20] | ResNet-101-FPN | 36.2 | 59.1 | 39.0 | 18.2 | 39.0 | 48.2 |
| Faster R-CNN by G-RMI [17] | Inception-ResNet-v2 [34] | 34.7 | 55.5 | 36.7 | 13.5 | 38.1 | 52.0 |
| Faster R-CNN w TDM [32] | Inception-ResNet-v2-TDM | 36.8 | 57.7 | 39.2 | 16.2 | 39.8 | 52.1 |
| 单阶段方法 | |||||||
| YOLOv2 [27] | DarkNet-19 [27] | 21.6 | 44.0 | 19.2 | 5.0 | 22.4 | 35.5 |
| SSD513 [22, 9] | ResNet-101-SSD | 31.2 | 50.4 | 33.3 | 10.2 | 34.5 | 49.8 |
| DSSD513 [9] | ResNet-101-DSSD | 33.2 | 53.3 | 35.2 | 13.0 | 35.4 | 51.1 |
| RetinaNet (ours) | ResNet-101-FPN | 39.1 | 59.1 | 42.3 | 21.8 | 42.7 | 50.2 |
| RetinaNet (ours) | ResNeXt-101-FPN | 40.8 | 61.1 | 44.1 | 24.1 | 44.2 | 51.2 |
表 2:目标检测单模型结果(边界框 AP),相对 COCO test-dev 上的当时最优。给出经尺度抖动且训练时长为表 1e 同模型 1.5 倍的 RetinaNet-101-800。我们的模型取得顶尖结果,超过单阶段与两阶段模型。速度对准确率的详细分解见表 1e 与图 2。
Online Hard Example Mining (OHEM):
[31] proposed to improve training of two-stage detectors by constructing minibatches using high-loss examples. Specifically, in OHEM each example is scored by its loss, non-maximum suppression (nms) is then applied, and a minibatch is constructed with the highest-loss examples. The nms threshold and batch size are tunable parameters. Like the focal loss, OHEM puts more emphasis on misclassified examples, but unlike FL, OHEM completely discards easy examples. We also implement a variant of OHEM used in SSD [22]: after applying nms to all examples, the minibatch is constructed to enforce a 1:3 ratio between positives and negatives to help ensure each minibatch has enough positives.
在线难例挖掘(OHEM):
[31] 提出用高损失样本构造小批量以改进两阶段检测器训练。具体地,OHEM 按损失给每个样本打分,再施加非极大值抑制(nms),并用最高损失样本构造小批量。nms 阈值与批大小是可调参数。与 Focal Loss 类似,OHEM 更强调误分类样本;但与 FL 不同,OHEM 完全丢弃易例。我们还实现 SSD [22] 所用 OHEM 变体:对全部样本做 nms 后,构造小批量时强制正负比 1:3,以帮助确保每批有足够正例。
We test both OHEM variants in our setting of one-stage detection which has large class imbalance. Results for the original OHEM strategy and the ‘OHEM 1:3’ strategy for selected batch sizes and nms thresholds are shown in Table 1d. These results use ResNet-101, our baseline trained with FL achieves 36.0 AP for this setting. In contrast, the best setting for OHEM (no 1:3 ratio, batch size 128, nms of .5) achieves 32.8 AP. This is a gap of 3.2 AP, showing FL is more effective than OHEM for training dense detectors. We note that we tried other parameter setting and variants for OHEM but did not achieve better results.
我们在具有大类别不平衡的单阶段检测设定下测试两种 OHEM 变体。原 OHEM 策略与「OHEM 1:3」策略在选定批大小与 nms 阈值下的结果见表 1d。这些结果使用 ResNet-101;我们用 FL 训练的基线在此设定下达到 36.0 AP。相对之下,OHEM 最佳设定(无 1:3 比、批大小 128、nms 0.5)达到 32.8 AP。差距 3.2 AP,表明对训练密集检测器 FL 比 OHEM 更有效。我们尝试了其他参数设定与 OHEM 变体,但未获得更好结果。
Hinge Loss:
Finally, in early experiments, we attempted to train with the hinge loss [13] on , which sets loss to 0 above a certain value of . However, this was unstable and we did not manage to obtain meaningful results. Results exploring alternate loss functions are in the appendix.
Hinge 损失:
最后,早期实验中我们尝试在 上用 hinge 损失 [13] 训练——在 超过某值时把损失置 0。但这不稳定,我们未能得到有意义结果。探索替代损失的结果见附录。
5.2 Model Architecture Design
5.2 模型架构设计
Anchor Density:
One of the most important design factors in a one-stage detection system is how densely it covers the space of possible image boxes. Two-stage detectors can classify boxes at any position, scale, and aspect ratio using a region pooling operation [10]. In contrast, as one-stage detectors use a fixed sampling grid, a popular approach for achieving high coverage of boxes in these approaches is to use multiple ‘anchors’ [28] at each spatial position to cover boxes of various scales and aspect ratios.
锚密度:
单阶段检测系统中最重要的设计因素之一,是它如何密集地覆盖可能图像框的空间。两阶段检测器可用区域池化运算 [10] 在任意位置、尺度与宽高比上分类框。相对之下,单阶段检测器使用固定采样网格,常见做法是在每个空间位置使用多个「锚」[28],以覆盖多种尺度与宽高比的框。
We sweep over the number of scale and aspect ratio anchors used at each spatial position and each pyramid level in FPN. We consider cases from a single square anchor at each location to 12 anchors per location spanning 4 sub-octave scales (, for ) and 3 aspect ratios [0.5, 1, 2]. Results using ResNet-50 are shown in Table 1c. A surprisingly good AP (30.3) is achieved using just one square anchor. However, the AP can be improved by nearly 4 points (to 34.0) when using 3 scales and 3 aspect ratios per location. We used this setting for all other experiments in this work.
我们扫描 FPN 每个空间位置与每个金字塔层所用尺度与宽高比锚的数量。考虑从每位置单个正方形锚,到每位置 12 个锚(跨 4 个亚八度尺度 ,,与 3 种宽高比 [0.5, 1, 2])。使用 ResNet-50 的结果见表 1c。仅用一个正方形锚已得到出人意料的良好 AP(30.3);但每位置用 3 尺度与 3 宽高比时,AP 可提升近 4 点(到 34.0)。本文其余实验均用该设定。
Finally, we note that increasing beyond 6-9 anchors did not shown further gains. Thus while two-stage systems can classify arbitrary boxes in an image, the saturation of performance w.r.t. density implies the higher potential density of two-stage systems may not offer an advantage.
最后指出:超过 6–9 个锚未见进一步收益。因此,虽两阶段系统可分类图像中任意框,相对密度的性能饱和意味着两阶段系统更高的潜在密度未必提供优势。
Speed versus Accuracy:
Larger backbone networks yield higher accuracy, but also slower inference speeds. Likewise for input image scale (defined by the shorter image side). We show the impact of these two factors in Table 1e. In Figure 2 we plot the speed/accuracy trade-off curve for RetinaNet and compare it to recent methods using public numbers on COCO test-dev. The plot reveals that RetinaNet, enabled by our focal loss, forms an upper envelope over all existing methods, discounting the low-accuracy regime. RetinaNet with ResNet-101-FPN and a 600 pixel image scale (which we denote by RetinaNet-101-600 for simplicity) matches the accuracy of the recently published ResNet-101-FPN Faster R-CNN [20], while running in 122 ms per image compared to 172 ms (both measured on an Nvidia M40 GPU). Using larger scales allows RetinaNet to surpass the accuracy of all two-stage approaches, while still being faster. For faster runtimes, there is only one operating point (500 pixel input) at which using ResNet-50-FPN improves over ResNet-101-FPN. Addressing the high frame rate regime will likely require special network design, as in [27], and is beyond the scope of this work. We note that after publication, faster and more accurate results can now be obtained by a variant of Faster R-CNN from [12].
速度对准确率:
更大骨干网络带来更高准确率,但推理也更慢;输入图像尺度(由较短边定义)同理。表 1e 给出这两因素的影响。图 2 画出 RetinaNet 的速度/准确率权衡曲线,并与用 COCO test-dev 公开数字的近期方法对比。图表明:借助 Focal Loss,RetinaNet 构成既有方法的上包络(忽略低准确率区间)。带 ResNet-101-FPN 与 600 像素图像尺度的 RetinaNet(简记 RetinaNet-101-600)匹配新近发表的 ResNet-101-FPN Faster R-CNN [20] 准确率,同时每图运行 122 ms,对比 172 ms(均在 Nvidia M40 GPU 上测得)。使用更大尺度可使 RetinaNet 超越全部两阶段方法的准确率,同时仍更快。对更快运行时间,仅在一个工作点(500 像素输入)上 ResNet-50-FPN 优于 ResNet-101-FPN。应对高帧率区间很可能需要如 [27] 那样的特殊网络设计,超出本文范围。我们指出:发表后,[12] 的 Faster R-CNN 变体现可得到更快且更准的结果。
5.3 Comparison to State of the Art
5.3 与当时最优的比较
We evaluate RetinaNet on the challenging COCO dataset and compare test-dev results to recent state-of-the-art methods including both one-stage and two-stage models. Results are presented in Table 2 for our RetinaNet-101-800 model trained using scale jitter and for 1.5 longer than the models in Table 1e (giving a 1.3 AP gain). Compared to existing one-stage methods, our approach achieves a healthy 5.9 point AP gap (39.1 vs. 33.2) with the closest competitor, DSSD [9], while also being faster, see Figure 2. Compared to recent two-stage methods, RetinaNet achieves a 2.3 point gap above the top-performing Faster R-CNN model based on Inception-ResNet-v2-TDM [32]. Plugging in ResNeXt-32x8d-101-FPN [38] as the RetinaNet backbone further improves results another 1.7 AP, surpassing 40 AP on COCO.
我们在富有挑战的 COCO 数据集上评估 RetinaNet,并把 test-dev 结果与近期当时最优方法(含单阶段与两阶段模型)对比。表 2 给出经尺度抖动、训练时长为表 1e 模型 1.5 倍的 RetinaNet-101-800(带来 1.3 AP 收益)。相对既有单阶段方法,我们的方法相对最接近的竞争者 DSSD [9] 有健康的 5.9 点 AP 差距(39.1 对 33.2),同时更快,见图 2。相对近期两阶段方法,RetinaNet 相对基于 Inception-ResNet-v2-TDM [32] 的顶尖 Faster R-CNN 模型高出 2.3 点。把 ResNeXt-32x8d-101-FPN [38] 插入 RetinaNet 骨干再提升 1.7 AP,在 COCO 上突破 40 AP。
6 Conclusion
6 结论
In this work, we identify class imbalance as the primary obstacle preventing one-stage object detectors from surpassing top-performing, two-stage methods. To address this, we propose the focal loss which applies a modulating term to the cross entropy loss in order to focus learning on hard negative examples. Our approach is simple and highly effective. We demonstrate its efficacy by designing a fully convolutional one-stage detector and report extensive experimental analysis showing that it achieves state-of-the-art accuracy and speed. Source code is available at https://github.com/facebookresearch/Detectron [12].
本文把类别不平衡识别为阻碍单阶段目标检测器超越顶尖两阶段方法的主要障碍。为应对,我们提出 Focal Loss:在交叉熵损失上施加调制项,把学习聚焦到难负例。方法简单且高度有效。我们通过设计全卷积单阶段检测器展示其效力,并报告广泛实验分析,表明它达到当时最优准确率与速度。源代码见 https://github.com/facebookresearch/Detectron [12]。
Appendix A: Focal Loss*
附录 A:Focal Loss*
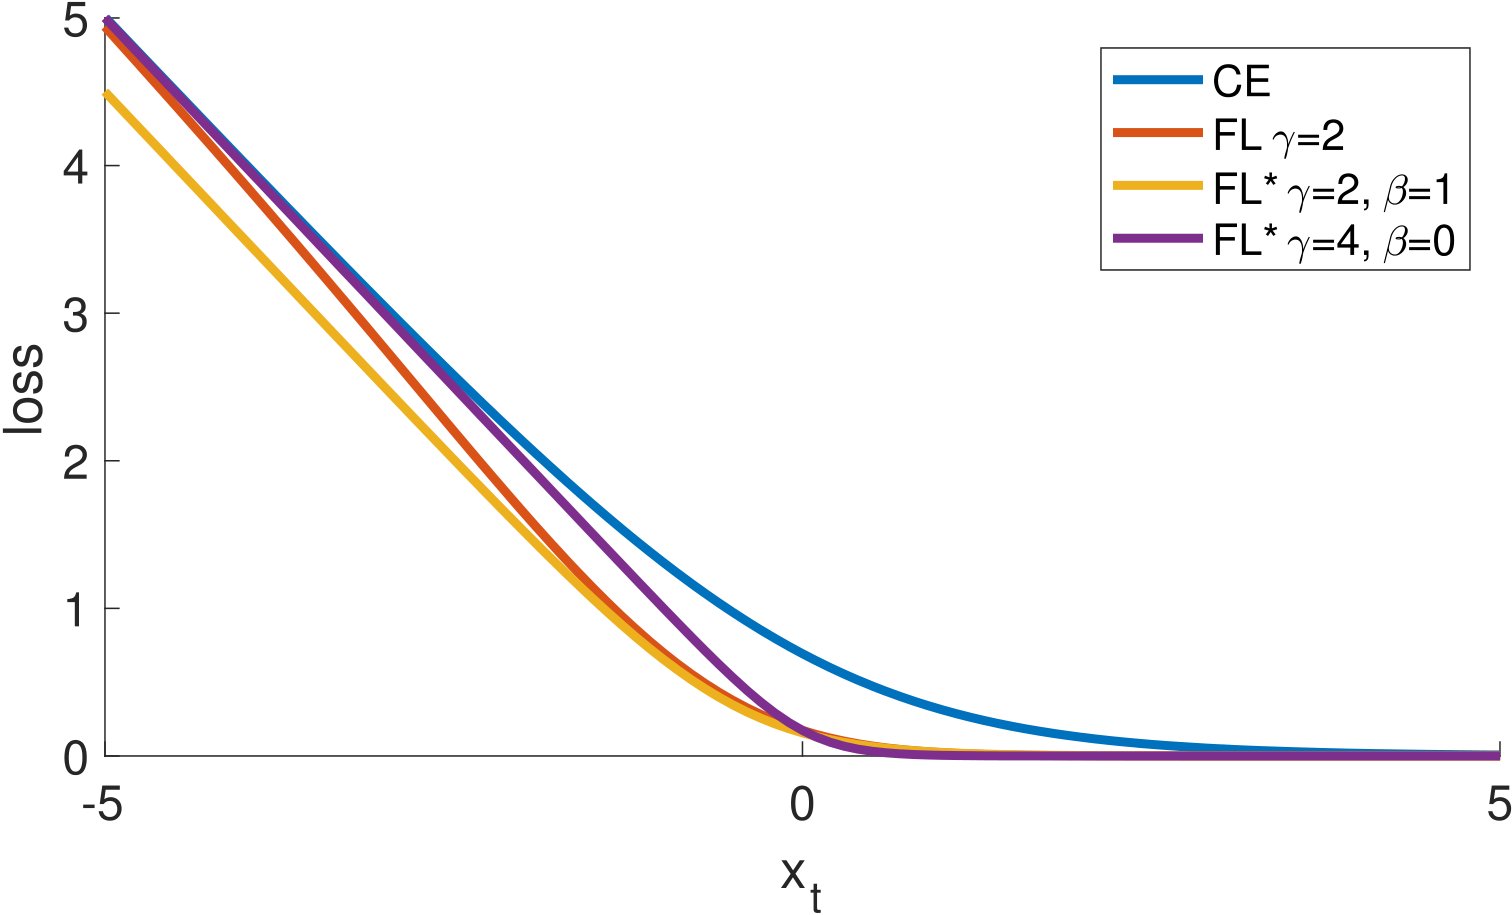
Figure 5: Focal loss variants compared to the cross entropy as a function of . Both the original FL and alternate variant reduce the relative loss for well-classified examples ().
图 5:Focal Loss 变体相对交叉熵,作为 的函数。原始 FL 与替代变体 都降低已正确分类样本()的相对损失。
| loss | AP | AP50 | AP75 | ||
|---|---|---|---|---|---|
| CE | – | – | 31.1 | 49.4 | 33.0 |
| FL | 2.0 | – | 34.0 | 52.5 | 36.5 |
| 2.0 | 1.0 | 33.8 | 52.7 | 36.3 | |
| 4.0 | 0.0 | 33.9 | 51.8 | 36.4 |
Table 3: Results of FL and versus CE for select settings.
| loss | AP | AP50 | AP75 | ||
|---|---|---|---|---|---|
| CE | – | – | 31.1 | 49.4 | 33.0 |
| FL | 2.0 | – | 34.0 | 52.5 | 36.5 |
| 2.0 | 1.0 | 33.8 | 52.7 | 36.3 | |
| 4.0 | 0.0 | 33.9 | 51.8 | 36.4 |
表 3:选定设定下 FL 与 相对 CE 的结果。
The exact form of the focal loss is not crucial. We now show an alternate instantiation of the focal loss that has similar properties and yields comparable results. The following also gives more insights into properties of the focal loss.
Focal Loss 的精确形式并非关键。我们现展示具有相似性质并产生可比结果的另一种 Focal Loss 实例化。下文也对 Focal Loss 的性质给出更多洞见。
We begin by considering both cross entropy (CE) and the focal loss (FL) in a slightly different form than in the main text. Specifically, we define a quantity as follows:
我们先以与正文略不同的形式考虑交叉熵(CE)与 Focal Loss(FL)。具体地,定义量 如下:
where specifies the ground-truth class as before. We can then write (this is compatible with the definition of in Equation 2). An example is correctly classified when , in which case .
其中 仍指定真值类。于是可写 (与式 2 中 定义兼容)。当 时样本被正确分类,此时 。
We can now define an alternate form of the focal loss in terms of . We define and as follows:
我们现可用 定义另一种 Focal Loss 形式。定义 与 如下:
has two parameters, and , that control the steepness and shift of the loss curve. We plot for two selected settings of and in Figure 5 alongside CE and FL. As can be seen, like FL, with the selected parameters diminishes the loss assigned to well-classified examples.
有两个参数 与 ,控制损失曲线的陡峭度与平移。图 5 给出两组选定 、 设定下的 ,并与 CE、FL 并列。可见,与 FL 类似,选定参数下的 会减弱赋给已正确分类样本的损失。
We trained RetinaNet-50-600 using identical settings as before but we swap out FL for with the selected parameters. These models achieve nearly the same AP as those trained with FL, see Table 3. In other words, is a reasonable alternative for the FL that works well in practice.
我们用与此前相同的设定训练 RetinaNet-50-600,但把 FL 换成选定参数的 。这些模型达到与用 FL 训练者几乎相同的 AP,见表 3。换言之, 是实践中表现良好的 FL 合理替代。
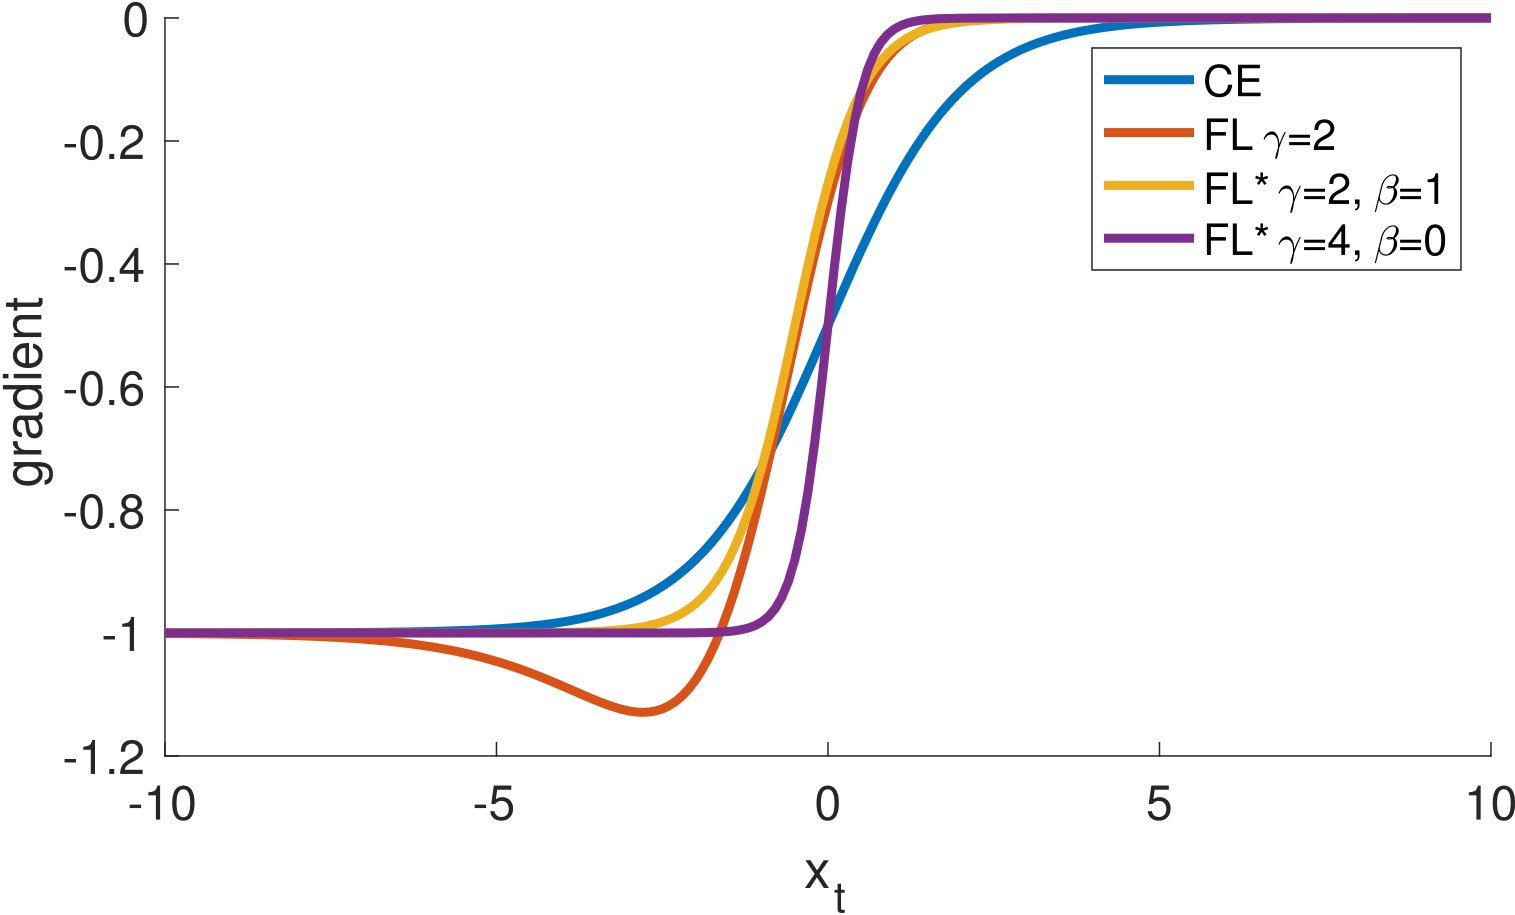
Figure 6: Derivates of the loss functions from Figure 5 w.r.t. .
图 6:图 5 中损失函数对 的导数。
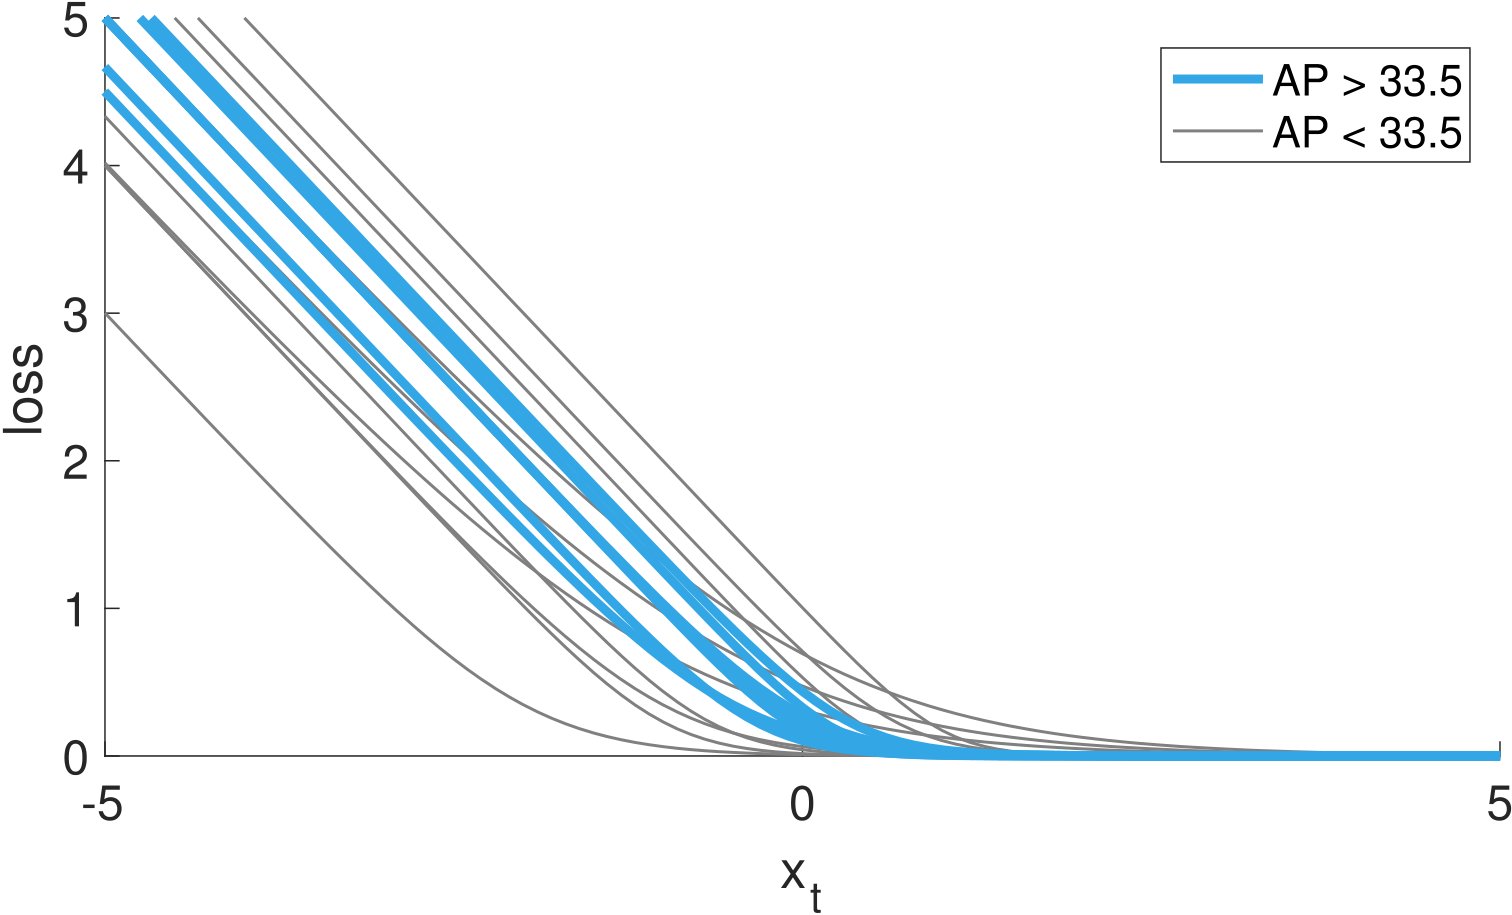
Figure 7: Effectiveness of with various settings and . The plots are color coded such that effective settings are shown in blue.
图 7:不同 与 设定下 的有效性。图按颜色编码,有效设定以蓝色显示。
We found that various and settings gave good results. In Figure 7 we show results for RetinaNet-50-600 with for a wide set of parameters. The loss plots are color coded such that effective settings (models converged and with AP over 33.5) are shown in blue. We used in all experiments for simplicity. As can be seen, losses that reduce weights of well-classified examples () are effective.
我们发现多种 与 设定都能给出良好结果。图 7 给出 RetinaNet-50-600 在广泛参数下使用 的结果。损失曲线按颜色编码,有效设定(模型收敛且 AP 超过 33.5)显示为蓝色。为简单起见全部实验用 。可见:降低已正确分类样本()权重的损失是有效的。
More generally, we expect any loss function with similar properties as FL or to be equally effective.
更一般地,我们预期任何具有与 FL 或 相似性质的损失函数都同样有效。
Appendix B: Derivatives
附录 B:导数
For reference, derivates for CE, FL, and w.r.t. are:
供参考,CE、FL 与 对 的导数为:
Plots for selected settings are shown in Figure 6. For all loss functions, the derivative tends to -1 or 0 for high-confidence predictions. However, unlike CE, for effective settings of both FL and , the derivative is small as soon as .
选定设定下的曲线见图 6。对全部损失函数,高置信预测时导数趋于 -1 或 0。但与 CE 不同,对 FL 与 的有效设定,一旦 导数就已较小。
References
参考文献
[1] S. Bell, C. L. Zitnick, K. Bala, and R. Girshick. Inside-outside net: Detecting objects in context with skip pooling and recurrent neural networks. In CVPR , 2016.
[2] S. R. Bulo, G. Neuhold, and P. Kontschieder. Loss max-pooling for semantic image segmentation. In CVPR , 2017.
[3] J. Dai, Y. Li, K. He, and J. Sun. R-FCN: Object detection via region-based fully convolutional networks. In NIPS , 2016.
[4] N. Dalal and B. Triggs. Histograms of oriented gradients for human detection. In CVPR , 2005.
[5] P. Dollár, Z. Tu, P. Perona, and S. Belongie. Integral channel features. In BMVC , 2009.
[6] D. Erhan, C. Szegedy, A. Toshev, and D. Anguelov. Scalable object detection using deep neural networks. In CVPR , 2014.
[7] M. Everingham, L. Van Gool, C. K. Williams, J. Winn, and A. Zisserman. The PASCAL Visual Object Classes (VOC) Challenge. IJCV , 2010.
[8] P. F. Felzenszwalb, R. B. Girshick, and D. McAllester. Cascade object detection with deformable part models. In CVPR , 2010.
[9] C.-Y. Fu, W. Liu, A. Ranga, A. Tyagi, and A. C. Berg. DSSD: Deconvolutional single shot detector. arXiv:1701.06659 , 2016.
[10] R. Girshick. Fast R-CNN. In ICCV , 2015.
[11] R. Girshick, J. Donahue, T. Darrell, and J. Malik. Rich feature hierarchies for accurate object detection and semantic segmentation. In CVPR , 2014.
[12] R. Girshick, I. Radosavovic, G. Gkioxari, P. Dollár, and K. He. Detectron. https://github.com/facebookresearch/detectron , 2018.
[13] T. Hastie, R. Tibshirani, and J. Friedman. The elements of statistical learning . Springer series in statistics Springer, Berlin, 2008.
[14] K. He, G. Gkioxari, P. Dollár, and R. Girshick. Mask R-CNN. In ICCV , 2017.
[15] K. He, X. Zhang, S. Ren, and J. Sun. Spatial pyramid pooling in deep convolutional networks for visual recognition. In ECCV . 2014.
[16] K. He, X. Zhang, S. Ren, and J. Sun. Deep residual learning for image recognition. In CVPR , 2016.
[17] J. Huang, V. Rathod, C. Sun, M. Zhu, A. Korattikara, A. Fathi, I. Fischer, Z. Wojna, Y. Song, S. Guadarrama, and K. Murphy. Speed/accuracy trade-offs for modern convolutional object detectors. In CVPR , 2017.
[18] A. Krizhevsky, I. Sutskever, and G. Hinton. ImageNet classification with deep convolutional neural networks. In NIPS , 2012.
[19] Y. LeCun, B. Boser, J. S. Denker, D. Henderson, R. E. Howard, W. Hubbard, and L. D. Jackel. Backpropagation applied to handwritten zip code recognition. Neural computation , 1989.
[20] T.-Y. Lin, P. Dollár, R. Girshick, K. He, B. Hariharan, and S. Belongie. Feature pyramid networks for object detection. In CVPR , 2017.
[21] T.-Y. Lin, M. Maire, S. Belongie, J. Hays, P. Perona, D. Ramanan, P. Dollár, and C. L. Zitnick. Microsoft COCO: Common objects in context. In ECCV , 2014.
[22] W. Liu, D. Anguelov, D. Erhan, C. Szegedy, and S. Reed. SSD: Single shot multibox detector. In ECCV , 2016.
[23] J. Long, E. Shelhamer, and T. Darrell. Fully convolutional networks for semantic segmentation. In CVPR , 2015.
[24] P. O. Pinheiro, R. Collobert, and P. Dollar. Learning to segment object candidates. In NIPS , 2015.
[25] P. O. Pinheiro, T.-Y. Lin, R. Collobert, and P. Dollár. Learning to refine object segments. In ECCV , 2016.
[26] J. Redmon, S. Divvala, R. Girshick, and A. Farhadi. You only look once: Unified, real-time object detection. In CVPR , 2016.
[27] J. Redmon and A. Farhadi. YOLO9000: Better, faster, stronger. In CVPR , 2017.
[28] S. Ren, K. He, R. Girshick, and J. Sun. Faster R-CNN: Towards real-time object detection with region proposal networks. In NIPS , 2015.
[29] H. Rowley, S. Baluja, and T. Kanade. Human face detection in visual scenes. Technical Report CMU-CS-95-158R, Carnegie Mellon University, 1995.
[30] P. Sermanet, D. Eigen, X. Zhang, M. Mathieu, R. Fergus, and Y. LeCun. Overfeat: Integrated recognition, localization and detection using convolutional networks. In ICLR , 2014.
[31] A. Shrivastava, A. Gupta, and R. Girshick. Training region-based object detectors with online hard example mining. In CVPR , 2016.
[32] A. Shrivastava, R. Sukthankar, J. Malik, and A. Gupta. Beyond skip connections: Top-down modulation for object detection. arXiv:1612.06851 , 2016.
[33] K.-K. Sung and T. Poggio. Learning and Example Selection for Object and Pattern Detection. In MIT A.I. Memo No. 1521 , 1994.
[34] C. Szegedy, S. Ioffe, V. Vanhoucke, and A. A. Alemi. Inception-v4, inception-resnet and the impact of residual connections on learning. In AAAI Conference on Artificial Intelligence , 2017.
[35] J. R. Uijlings, K. E. van de Sande, T. Gevers, and A. W. Smeulders. Selective search for object recognition. IJCV , 2013.
[36] R. Vaillant, C. Monrocq, and Y. LeCun. Original approach for the localisation of objects in images. IEE Proc. on Vision, Image, and Signal Processing , 1994.
[37] P. Viola and M. Jones. Rapid object detection using a boosted cascade of simple features. In CVPR , 2001.
[38] S. Xie, R. Girshick, P. Dollár, Z. Tu, and K. He. Aggregated residual transformations for deep neural networks. In CVPR , 2017.
[39] C. L. Zitnick and P. Dollár. Edge boxes: Locating object proposals from edges. In ECCV , 2014.