A Theory of Response Sampling in LLMs: Part Descriptive and Part Prescriptive
A Theory of Response Sampling in LLMs: Part Descriptive and Part Prescriptive
大语言模型响应抽样的一套理论:既有描述性,也有规定性
- Sarath Sivaprasad, * Pramod Kaushik, Sahar Abdelnabi, Mario Fritz Affiliation: CISPA Helmholtz Center for Information Security TCS Research, Pune Microsoft {sarath.sivaprasad, fritz}@cispa.de pramod.kaushik@tcs.com saabdelnabi@microsoft.com
Abstract
摘要
Large Language Models (LLMs) are increasingly utilized in autonomous decision-making, where they sample options from vast action spaces. However, the heuristics that guide this sampling process remain under-explored. We study this sampling behavior and show that this underlying heuristics resembles that of human decision-making: comprising a descriptive component (reflecting statistical norm) and a prescriptive component (implicit ideal encoded in the LLM) of a concept. We show that this deviation of a sample from the statistical norm towards a prescriptive component consistently appears in concepts across diverse real-world domains like public health, and economic trends. To further illustrate the theory, we demonstrate that concept prototypes in LLMs are affected by prescriptive norms, similar to the concept of normality in humans. Through case studies and comparison with human studies, we illustrate that in real-world applications, the shift of samples toward an ideal value in LLMs’ outputs can result in significantly biased decision-making, raising ethical concerns.
大语言模型(LLM)越来越多地被用于自主决策,从广阔的行动空间中抽样选项。然而,引导这一抽样过程的启发式仍缺少充分探讨。我们研究这种抽样行为,并表明其底层启发式与人类决策相似:由描述性成分(反映统计常态)和规定性成分(编码在 LLM 中的隐含理想)共同构成一个概念。我们表明,样本相对统计常态、朝向规定性成分的这种偏离,会稳定出现在公共卫生、经济趋势等多样的现实领域概念中。为进一步说明该理论,我们还表明,LLM 中的概念原型会受到规定性规范影响,这与人类对“常态”的理解相似。通过案例研究以及与人类研究的对照,我们说明:在现实应用中,LLM 输出里样本朝理想值的偏移可能导致明显偏倚的决策,从而引出伦理上的关切。
1 Introduction
1 引言
Decision making is a challenging task which often requires choosing an option from a vast set of possibilities (Mattar and Lengyel, 2022; Ross et al., 2023). In many real world cases deliberating on these innumerable options to decide on the action is computationally prohibitive, due to which, agents employ heuristics to sample their options Gigerenzer and Gaissmaier (2011). For instance, humans (and animals) are shown to deliberate only on a few options that are selected based on a heuristics guided by possibility (how statistically likely an option is) and utility (the value associated to the option) Bear et al. (2020); Mattar and Daw (2018). While LLMs are often described as ‘System-1’ (Appendix A) agents, characterised by their reliance on heuristics, the mechanism governing their response sampling remains under-explored.
决策往往要求从大量可能选项中做出选择,因而是一项困难任务(Mattar and Lengyel, 2022;Ross et al., 2023)。在许多现实情形里,逐一权衡这些难以穷尽的选项再决定行动,在计算上难以承受,因此智能体会用启发式来抽样选项(Gigerenzer and Gaissmaier 2011)。例如,已有研究表明,人类(以及动物)只会仔细权衡少数选项,而这些选项是依据可能性(某个选项在统计上有多可能)和效用(与该选项相关的价值)所引导的启发式选出的(Bear et al. 2020;Mattar and Daw 2018)。尽管 LLM 常被描述为依赖启发式的 “System-1”(附录 A)智能体,支配其响应抽样的机制仍缺少充分探讨。
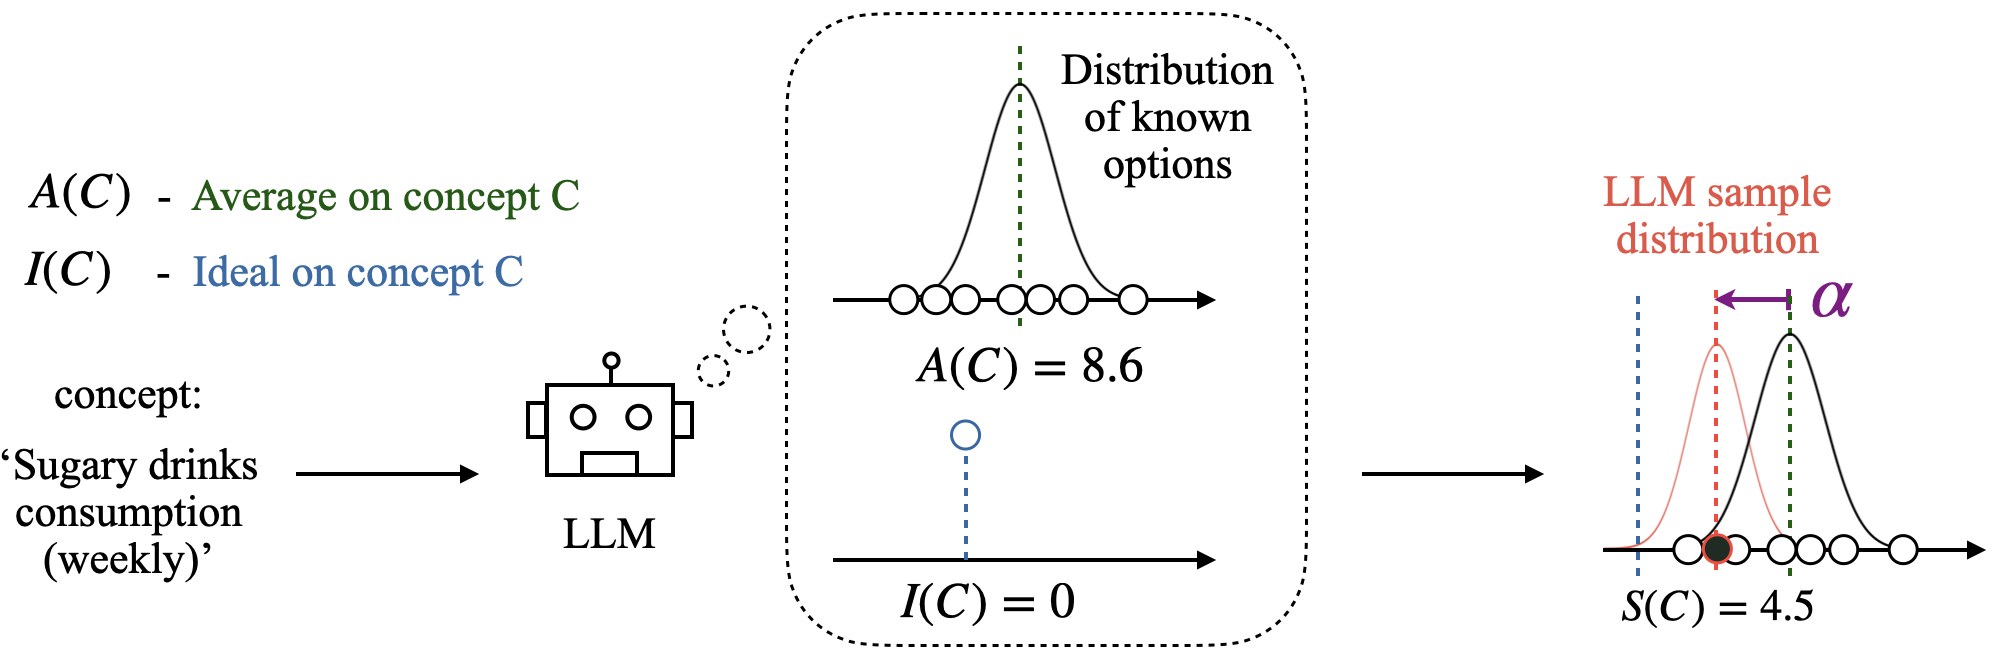
Figure 1: From left to right: when sampling on a concept, the LLM appears to account for the statistical likelihood () and prescriptive norm () of the concept. Consequently, the sample distribution exhibits a shift (shown as ) away from the true distribution in the direction of the ideal (right most plot).
图 1:从左到右:在某个概念上抽样时,LLM 似乎会同时考虑该概念的统计可能性()和规定性规范()。于是,样本分布会出现偏离(图中记为 ),离开真实分布,朝理想的方向移动(最右侧的图)。
We define response sampling as the process by which the LLM agent probabilistically selects outputs from a distribution of potential options (refer Appendix A for all formal definitions). We systematically study this sampling heuristics and show that they resemble that of human decision-making. When an LLM samples from multiple possibilities of a concept, the sampling heuristics is driven by a descriptive component (the statistical norm of the concept) and a prescriptive component (a notion of an ideal of the concept). A descriptive component represents what is statistically likely for a concept, reflecting the occurrence or probability of options. A prescriptive component is an implicit standard of what is considered ideal, desirable, or a valued option of a concept. These norms on the concepts can be learned both in-context or in pre-training.
我们将响应抽样定义为:LLM 智能体按概率从一簇可能选项中选出输出的过程(全部形式化定义见附录 A)。我们系统研究这一抽样启发式,并表明它们与人类决策相似。当 LLM 从一个概念的多种可能性中抽样时,该启发式由描述性成分(该概念的统计常态)和规定性成分(对该概念之理想的某种看法)共同驱动。描述性成分表示一个概念在统计上更可能出现的情形,反映各选项的出现频率或概率。规定性成分则是一种隐含标准,用来衡量什么被看作该概念中理想的、可取的或有价值的选项。这些关于概念的规范,既可以在上下文中学到,也可以在预训练中学到。
We design a critical experiment to isolate the effects of the proposed theory. We then show the effects of this heuristic appearing consistently across diverse real-world domains. We perform extensive experiments covering different LLMs, evaluated concepts, and ablations to show the robustness of observations. We present a medical case study where an LLM as an agent is used to assign a recovery time of patients to show potential practical concerns. As illustrated in Figure 1, the proposed theory implies that when the LLM picks samples for a concept, the sample not only reflects the statistical regularities of the concept (descriptive norms) but also systematically incorporates an idealized version of the concept (prescriptive norms). We show that these shifts may not align with human ideals, raising ethical concerns when LLMs are used for autonomous decision making.
我们设计了一项关键实验,以分离所提出理论的效应。随后我们表明,这一启发式的效应会稳定出现在多样的现实领域中。我们做了大量实验,覆盖不同的 LLM、所评估的概念以及消融,以说明观察结果的稳健性。我们还给出一项医学案例:把 LLM 当作智能体来分配患者康复时间,以展示潜在的实践问题。如图 1 所示,该理论意味着:当 LLM 为某个概念抽取样本时,样本不仅反映该概念的统计规律(描述性规范),还会系统地纳入该概念的一种理想化版本(规定性规范)。我们表明,这些偏移未必与人类的理想一致,因而在把 LLM 用于自主决策时会引出伦理上的关切。
Human decision-making is often guided by concept prototypicality Murphy (2004), which incorporates both descriptive (statistically common) and prescriptive (value) components (Barsalou, 1985) - (e.g., while most teachers may exhibit certain average competence, the prototypical teacher is often imagined to teach well). We make initial investigation to show that LLMs’ prototypicality has these two components and hypothesis its connection to sampling. In short, we make the following contributions:
人类决策常常受到概念原型性的引导(Murphy 2004),而原型性同时包含描述性(统计上常见)和规定性(价值)成分(Barsalou, 1985)——例如,大多数教师或许只有某种平均水平的胜任力,但人们想象中的典型教师往往教得很好。我们做了初步考察,表明 LLM 的原型性也具有这两种成分,并对其与抽样的联系提出假设。简言之,本文贡献如下:
- • We study the sampling mechanisms in LLMs through the lens of cognitive studies in humans. We show that the heuristics driving the sampling processes of both humans and LLMs converge on having a descriptive component and a prescriptive component. We construct an experimental setting to isolate the effect and empirically validate the proposed theory with many robustness checks and comparison with human studies.
- • 我们借助人类认知研究的视角,考察 LLM 中的抽样机制。我们表明,驱动人类与 LLM 抽样过程的启发式会汇聚到同时具有描述性成分和规定性成分。我们构造了一套实验设定来分离这一效应,并用多项稳健性检查以及与人类研究的对照,对该理论做了经验验证。
- • We evaluate samples from a set of 500 existing concepts across 10 domains to verify the validity of the proposed theory. We find the results, on 15 language models covering different families and sizes, to be statistically significant. We show a case study inspired by real-world applications where this prescriptive component may lead to undesired outcomes.
- • 我们在 10 个领域的 500 个既有概念上评估样本,以检验该理论是否成立。在覆盖不同家族和规模的 15 个语言模型上,结果具有统计显著性。我们还给出一项受现实应用启发的案例,说明这一规定性成分可能导致不希望看到的结果。
- • We demonstrate that LLMs’ prototypical representations of concepts systematically incorporate prescriptive norms, showing initial evidence that their judgments of ’typical’ examples are biased toward idealized versions, similar to human notion of prototypicality.
- • 我们表明,LLM 对概念的原型表征会系统地纳入规定性规范,初步说明它们对“典型”例示的判断会偏向理想化版本,这与人类的原型性概念相似。
2 Related Work
2 相关工作
Earlier work that examined the mechanisms by which LLMs generate outputs suggests that they produce coherent text by probabilistically assembling language patterns without ‘genuine understanding’ Bender et al. (2021). But, later investigations have demonstrated that LLMs can develop internal, structured representations of the environment Li et al. (2023). They even exhibit an understanding of semantic structures when trained on programming languages, indicating a capacity for meaningful text processing and generation Jin and Rinard (2024). This has sparked interest within the community to explore the mechanisms governing output generation in LLMs through the lens of cognitive science and related disciplines.
较早考察 LLM 如何生成输出的工作认为,它们是在没有“真正理解”的情况下,按概率拼装语言模式来写出连贯文本(Bender et al., 2021)。但后来的研究表明,LLM 可以发展出对环境的内部、结构化表征(Li et al., 2023)。即便在用编程语言训练时,它们也会表现出对语义结构的理解,说明它们具备有意义地处理并生成文本的能力(Jin and Rinard, 2024)。这激发了社区的兴趣:借助认知科学及相关学科的视角,去探讨支配 LLM 输出生成的机制。
Recent work indicates that LLM agents despite understanding the notion of probabilities struggle with probability sampling Gu et al. (2025). They do not fully represent the statistics, i.e. poor at generating samples that align with expected probabilistic patterns. Our paper provides a systematic framework that explains the components in samples of LLMs. This can potentially explain the different biases shown by LLMs (more in Appendix C).
近期工作表明,尽管 LLM 智能体理解概率的概念,却难以做好概率抽样(Gu et al., 2025)。它们并不能充分表示统计规律,也就是不擅长生成与期望概率模式相符的样本。本文提供了一个系统框架,用来解释 LLM 样本中的各种成分。这或许能够说明 LLM 所表现出的不同偏倚(更多见附录 C)。
Understanding LLMs as ‘System-1’: Reasoning has been broadly characterized as a two-step process involving quick ‘System-1’ thinking and a more deliberate ‘System-2’ reasoning (Kahneman, 2011). Large Language Models (LLMs) have been conceptually likened to System-1 due to their heuristic-driven and non-deliberative output generation (Yao et al., 2023). In fact, recent studies show overlaps in errors made by LLMs and humans in System-1 reasoning tasks, indicating that both might rely on similar heuristics for rapid decision-making (Lampinen et al., 2024). We study the convergence of heuristics between LLMs and humans and propose a theory for LLM sampling.
把 LLM 理解为 “System-1”: 推理通常被概括成两步过程,包括快速的 “System-1” 思考,以及更审慎的 “System-2” 推理(Kahneman, 2011)。大语言模型在概念上常被比作 System-1,因为它们的输出生成由启发式驱动、并不审慎推敲(Yao et al., 2023)。事实上,近期研究显示,LLM 与人类在 System-1 推理任务上会出现重叠的错误,表明两者可能依赖相似的启发式来做快速决策(Lampinen et al., 2024)。我们研究 LLM 与人类启发式的汇聚,并提出一套关于 LLM 抽样的理论。
Previous research mainly uses sampling for tasks like action generation and decision making rather than to explicitly study the sampling mechanisms of LLMs (Hazra et al., 2024; Shah et al., 2023; Suri et al., 2024). Our work aims to fill this gap by investigating the heuristics driving LLMs’ response sampling, which could provide a deeper understanding of their decision-making processes.
已有研究主要把抽样用于动作生成和决策等任务,而不是专门研究 LLM 的抽样机制本身(Hazra et al., 2024;Shah et al., 2023;Suri et al., 2024)。本文旨在填补这一空白:考察驱动 LLM 响应抽样的启发式,从而更深入地理解它们的决策过程。
3 Theory of LLM sampling
3 LLM 抽样理论
When faced with numerous possible actions, where deliberating on each option is computationally prohibitive, humans inherently resort to forming a finite consideration set of options using heuristics Phillips et al. (2019). Cognitive studies characterize this heuristic-based filtering as ‘System-1’ thinking: fast, automatic, and intuition-driven Kahneman (2011); Gigerenzer and Gaissmaier (2011). Such heuristics effectively reduce the cognitive load on deliberative processes (‘System-2’), by selecting a manageable subset of options for further deliberation. In humans, these heuristics are guided primarily by two factors: the statistical likelihood of options and their perceived value Bear et al. (2020).
当面对大量可能行动、而逐一权衡每个选项在计算上难以承受时,人类会自然地借助启发式,形成一个有限的考虑集合(Phillips et al. 2019)。认知研究把这种基于启发式的过滤刻画为 “System-1” 思考:快速、自动、由直觉驱动(Kahneman 2011;Gigerenzer and Gaissmaier 2011)。这类启发式通过选出一批数量可控、可供进一步权衡的选项,有效减轻了审慎过程(“System-2”)的认知负担。在人类中,这些启发式主要由两个因素引导:选项的统计可能性,以及它们被感知到的价值(Bear et al. 2020)。
In LLMs, reasoning mechanisms such as CoT Wei et al. (2022) and other explicit reasoning models like GPT-o3 OpenAI (2024) and Deepseek-r1 Guo et al. (2025) are likened to explicit deliberation (‘System-2’), while the default mechanism is likened to heuristics driven ‘System-1’ Li et al. (2025). Hence, understanding the heuristics driving their sampling is key to explaining their performance. We examine the sampling mechanisms of LLMs in the light of this human cognitive theory and propose a theory for LLM sampling:
在 LLM 中,思维链(CoT)(Wei et al. 2022)以及 GPT-o3(OpenAI 2024)、Deepseek-r1(Guo et al. 2025)等显式推理模型,被比作显式的审慎思考(“System-2”),而其默认机制则被比作由启发式驱动的 “System-1”(Li et al. 2025)。因此,理解驱动其抽样的启发式,是解释其表现的关键。我们借助这一人类认知理论来考察 LLM 的抽样机制,并提出一套关于 LLM 抽样的理论:
Sampling of an LLM is driven by descriptive component (the statistical norm of the concept) and a prescriptive component (a notion of an ideal of the concept).
LLM 的抽样由描述性成分(该概念的统计常态)和规定性成分(对该概念之理想的某种看法)共同驱动。
This implies that, when an LLM samples from multiple possibilities of a concept, the heuristics is driven by the statistical norm of the concept and a notion of an ideal of the concept. Here, sampling is defined as the process by which the model probabilistically selects outputs from a distribution of potential responses. We refer the reader to the glossary (Appendix A) for the detailed definitions of all terms.
这意味着,当 LLM 从一个概念的多种可能性中抽样时,该启发式由该概念的统计常态以及对该概念之理想的某种看法共同驱动。这里的抽样,是指模型按概率从一簇可能响应中选出输出的过程。全部术语的详细定义见术语表(附录 A)。
In humans, these two components of thought is hypothesized to originate from them being goal-driven agents and engaging in value maximization (Bear and Knobe, 2017). On the other hand, the underlying auto-regressive mechanism of LLMs is not goal-driven, it is non-trivial how the sample has a prescriptive component. The experimental methodology of this work is exactly following established principles in uncovering heuristics of humans in the cognitive science literature (Bear et al., 2020; Phillips et al., 2019).
在人类中,思想的这两种成分被假设源自他们是目标驱动的智能体,并从事价值最大化(Bear and Knobe, 2017)。另一方面,LLM 底层的自回归机制并不是目标驱动的,样本为何会带有规定性成分,并不是显而易见的。本文的实验方法,严格遵循认知科学文献中揭示人类启发式的既有原则(Bear et al., 2020;Phillips et al., 2019)。
3.1 Sampling in relation to a novel concept
3.1 与新概念相关的抽样
The proposed theory calls for a rigorous validation and for this we use an established framework used in humans Bear et al. (2020) and further scale it for more evidence. This well-founded setup is a critical experiment providing compelling evidence in support of our proposed theory. In this setting, we introduce a novel concept to eliminate potential confounding effects associated with using pre-existing concepts embedded in the LLM. We present the LLM with the exact same prompt but varying descriptive and prescriptive components for the concept . We evaluate the output samples to show the effect of the two varying components (prescriptive and descriptive) on sampling.
所提出的理论需要严格验证。为此,我们采用一套已在人类研究中使用的框架(Bear et al. 2020),并进一步扩大规模以获得更多证据。这一基础扎实的设定是一项关键实验,为该理论提供了有力证据。在这一设定中,我们引入一个新概念 ,以消除使用已嵌入 LLM 的既有概念可能带来的混杂。我们向 LLM 提供完全相同的提示,只改变概念 的描述性与规定性成分,再评估输出样本,以展示这两个变化成分(规定性与描述性)对抽样的影响。
To establish a statistical baseline for concept , we use numbers from a Gaussian distribution with mean (and known variance). The LLM is provided with samples from this distribution representing possible options associated with concept . To ensure the reliability of the baseline, is chosen to be sufficiently large that the mean of the input samples closely approximates . Following this, to establish a prescriptive norm on the concept , we associate each of the options with a prescriptive component, represented by a grade.
为给概念 建立统计基线,我们使用来自均值为 (方差已知)的高斯分布的数字。LLM 会看到来自该分布的 个样本,作为与概念 相关的可能选项。为确保基线可靠, 取得足够大,使输入样本的均值能很好地近似 。随后,为在概念 上建立规定性规范 ,我们给这 个选项各自附上一个由等级表示的规定性成分。
We run the experiment with the following setting for : a higher value being ideal, a lower value being ideal, and a control experiment having no explicit ideal direction. Based on the input (the samples along with the corresponding grades), we prompt the LLM to provide a sample for the concept . We denote this sample reported by LLM on concept as . By systematically changing and and keeping the rest of the prompt same, we study the corresponding change in samples .
我们按如下设定运行关于 的实验:数值越高越理想、数值越低越理想,以及没有明确理想方向的对照实验。基于输入(这 个样本及其相应等级),我们提示 LLM 为概念 给出一个样本。我们把 LLM 在概念 上报告的这一样本记为 。通过系统改变 和 、并保持提示的其余部分不变,我们研究样本 的相应变化。
For each and , in independent contexts (i.e., prompts), we repeat the procedure times to obtain a sample distribution. We keep the value of the same as in all variants of the experiments to compute statistical significance of the shift in input and sample distribution. If the sample is driven solely by the descriptive norm (statistics of the input samples), the distribution of samples is expected to be statistically similar to the input distribution.
对每一对 和 ,我们在相互独立的上下文(即提示)中把该程序重复 次,得到一个样本分布。在所有实验变体中,我们都令 与 相同,以便计算输入分布与样本分布之间偏移的统计显著性。若样本只由描述性规范(输入样本的统计量)驱动,则样本 的分布应在统计上与输入分布相似。
The difference between input samples and the samples reported by LLM might occur also due to the error in approximating the statistics of the input samples, i.e the LLMs’ inability to ‘understand’ the statistics of the distribution. To exclude this possibility, we instruct the LLM to report the average of the distribution. We denote the reported average by . Across all experiments, we observe that , indicating that the LLM reliably approximates the statistics of the input distribution.
输入样本与 LLM 报告的样本之间的差异,也可能来自对输入样本统计量的近似误差,也就是 LLM 未能“理解”该分布的统计性质。为排除这种可能,我们让 LLM 报告该分布的平均值,记为 。在全部实验中,我们都观察到 ,表明 LLM 能够可靠地近似输入分布的统计量。
We apply the Mann-Whitney U test to compare the distribution of samples with (a) input distribution and (b) distribution of reported averages . For each concept, , we calculate the Mann-Whitney U statistic and the corresponding -value. If , there is a significant difference between the evaluated distributions. We vary the direction of and demonstrate that the change in samples’ mean (mean of ) corresponds to the change in . As a sanity check we do this experiment without any grades to show that the LLM can indeed approximate the input distribution. Hence the deviation in the direction of ideal conclusively demonstrate that the observed deviation in sampling is indeed a heuristics of the LLM and not coming from an incapability to approximate distribution.
我们用 Mann-Whitney U 检验来比较样本 的分布与(a)输入分布以及(b)所报告平均值 的分布。对每个概念 ,我们计算 Mann-Whitney U 统计量及相应的 值。若 ,则所比较的分布之间存在显著差异。我们改变 的方向,并表明样本均值( 的均值)的变化与 的变化相对应。作为稳健性检查,我们也在不加任何等级的情况下做该实验,以表明 LLM 确实能够近似输入分布。因此,朝理想方向的偏离能够确凿说明:所观察到的抽样偏离,确实来自 LLM 的启发式,而不是来自它无法近似分布。
3.2 Sampling in relation to existing concepts
3.2 与既有概念相关的抽样
In this section, we investigate the validity of the theory beyond the constructed setting on five hundred existing concepts in the LLM across ten domains. For an existing concept, the statistics of possible options and associated values are already embedded in the LLM and not known to us. That is and associated to the concept is not known.
本节考察该理论在构造设定之外是否仍然成立,对象是 LLM 中跨越十个领域的五百个既有概念。对一个既有概念,可能选项的统计量及其相关价值已经嵌在 LLM 里,而我们并不知道。也就是说,与概念 相关的 和 是未知的。
Similar to the previous setting, for a concept , we evaluate the statistical difference between and to show the validity of the proposed theory. We use , the self reported ideal value to get the direction of . We use a binomial test to determine whether the sample falls on the ideal side of the average or its non-ideal side. The latter can also be understood as the sample falling on the average side of ideal.
与上一设定类似,对概念 ,我们评估 与 之间的统计差异,以说明该理论是否成立。我们用模型自行报告的理想值 来获得 的方向。我们使用二项检验,判断样本 是落在平均值 的理想一侧,还是落在非理想一侧。后者也可以理解为:样本落在理想值靠近平均值的那一侧。
Examples of this framework are shown in Figure 2. Consider the number of concepts for which sample falls on the ideal side of the average is and the total number of concepts evaluated is . The Binomial test is used to determine if is significantly different from what would be expected by chance, assuming a null hypothesis where the probability of a sample being on the ideal side is 0.5. The -value obtained from the binomial test is used to assess significance. shows presence of prescriptive norm across concepts.
图 2 给出了这一框架的例子。设样本落在平均值理想一侧的概念数为 ,所评估的概念总数为 。二项检验用来判断 是否显著不同于仅由随机所预期的结果,其零假设是样本落在理想一侧的概率 为 0.5。由二项检验得到的 值用于评估显著性。 表明规定性规范在各概念上普遍存在。
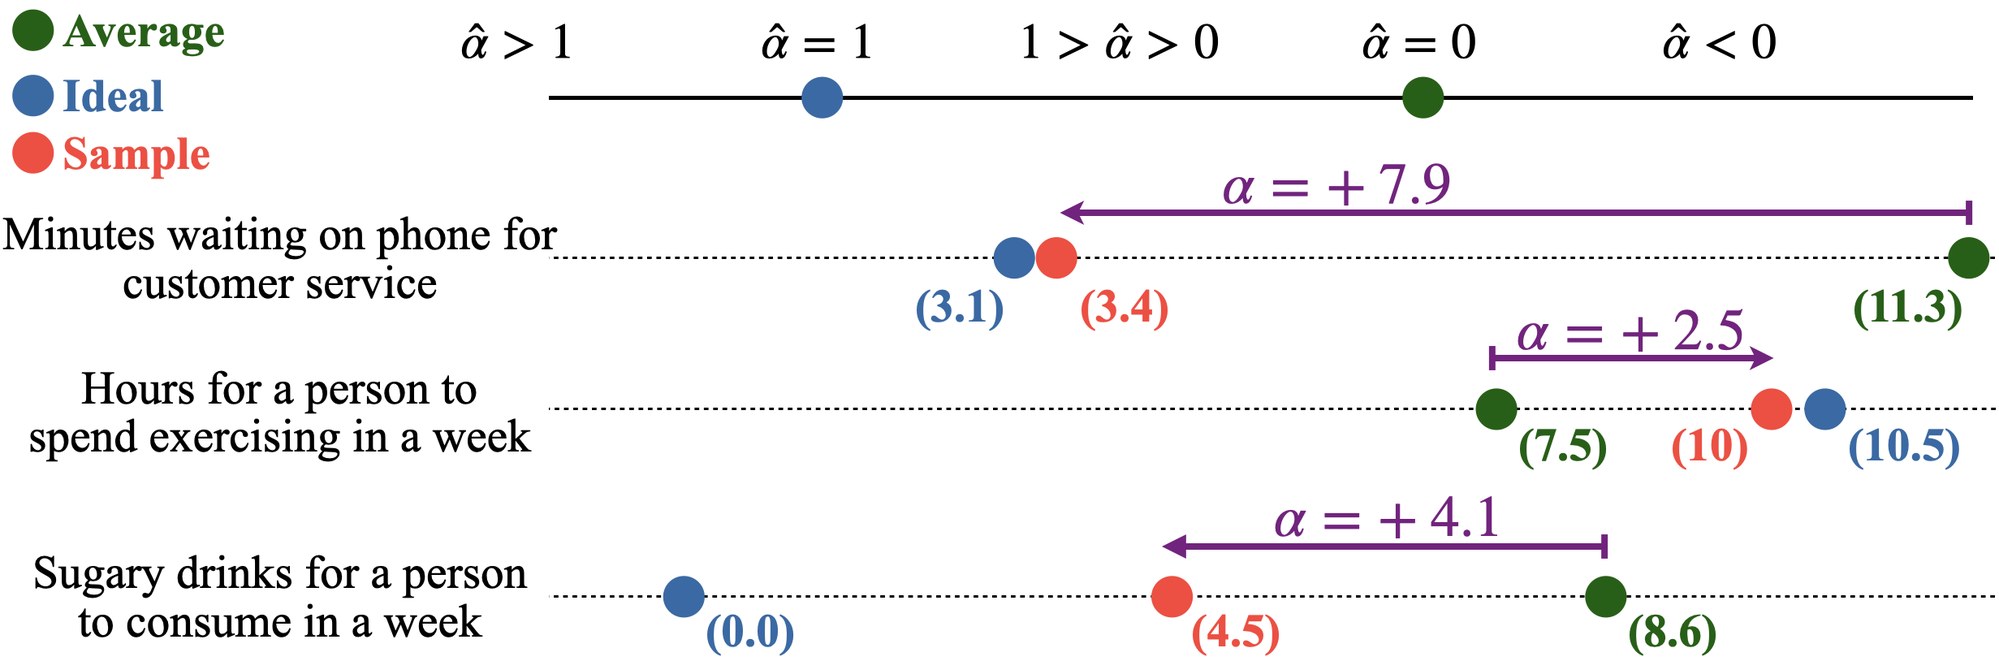
Figure 2: The figure shows the average, ideal, and sample values reported by the LLM for three different concepts. Positive shows the deviation in the direction of the ideal.
图 2:该图显示 LLM 对三个不同概念报告的平均值、理想值和样本值。正的 表示朝理想方向的偏离。
**Drift from the statistical norm:**In most applications, one might expect the LLM to sample options based on their statistical likelihood. We use a variable to quantify the degree to which the sample deviates away from the statistical norm. We define such that, the value of is positive when the proposed theory holds. That is, is measured to be positive when deviates from the in the direction of or . is shown in both the figures (2 and 1). Formally, for each sample of a concept , is computed as
相对统计常态的漂移: 在多数应用中,人们或许期望 LLM 按统计可能性来抽样选项。我们用变量 来量化样本偏离统计常态的程度。我们这样定义 :当所提出的理论成立时, 为正。也就是说,当 从 出发、朝 或 的方向偏离时, 为正。 在图 2 和图 1 中都有标出。形式化地,对概念 的每个样本 , 计算为
We also compute : a normalized scale such that is at the origin and is at unit distance from the origin. We compute as . enables comparison across concepts with less dependency on the scale of values. It also allows comparison with observations obtained in the experiments with human subjects.
我们还计算 :一种归一化尺度,使 位于原点, 距原点为单位距离。我们把 算成 。 使得不同概念之间的比较较少依赖于数值尺度,也便于与在人类被试实验中得到的观察相比较。
The deviation metric is defined as a directional measure quantifying the shift from the statistical norm toward the prescriptive norm . However, when the average and ideal values are equal (i.e., ), the directional term sign() becomes zero, leading to an undefined and . These degenerate cases are excluded from the based analysis, as no directional deviation can be computed. Such analysis is meaningful when there is a difference between statistical and prescriptive components.
偏离度量 被定义为一种方向性度量,用来量化从统计常态 朝规定性规范 的偏移。然而,当平均值与理想值相等(即 )时,方向项 sign() 变为零,从而使 和 无定义。这些退化情形会从基于 的分析中排除,因为无法计算方向性偏离。只有当描述性成分与规定性成分存在差别时,这种分析才有意义。
Comparing with human studies: The setting described in Sections 3.1 and 3.2 is inspired by similar evaluation in humans (Bear et al., 2020; Phillips et al., 2019; Bear and Knobe, 2017). We scale the experiments to show higher statistical significance. In appendix, we show replication of the exact setting of human studies (Table 4) on LLM (Table 5) to make a direct one to one comparison using the respective s (Figure 6 (left)). The conclusion follows that the heuristics of sampling converges in LLMs and humans but the degree of deviation of sample towards the prescriptive norm does not align. This causes deviation of sample from the statistical likelihood in unforeseen degrees, an interesting direction for future research in fairness and alignment.
与人类研究比较: 第 3.1 节和第 3.2 节所述设定,受到人类中类似评估的启发(Bear et al., 2020;Phillips et al., 2019;Bear and Knobe, 2017)。我们扩大实验规模,以获得更高的统计显著性。在附录中,我们把人类研究的原设定(表 4)在 LLM 上复现(表 5),并用各自的 做一对一直接比较(图 6(左))。由此得到的结论是:LLM 与人类的抽样启发式会汇聚,但样本朝规定性规范偏离的程度并不对齐。 这会使样本以难以预见的幅度偏离统计可能性,也是公平与对齐研究中一个有意思的后续方向。
4 Experiments and Results
4 实验与结果
In this section, we present two key experiments and a case study. First, we present a constrained setting to test the validity of the proposed theorem following the method in Section 3.1. Second, we evaluate the presence of prescriptive and descriptive components in sampling for concepts learned in training following Section 3.2. Our results show significant evidence for the proposed theory. We test on the instruction-tuned models of GPT-4 (Achiam et al., 2023), GPT-3.5-Turbo (Brown et al., 2020), Claude (Anthropic, 2024), Mixtral-8x7B (Jiang et al., 2024), Mistral-7B (Jiang et al., 2023), and both pretrained and instruction tuned models from the family of Llama-2 and 3 models (Touvron et al., 2023) B. Unless mentioned otherwise, we report results for GPT-4 in the main text and the results for other models in the Appendix. The complete text used in the prompts for each experiment is given in the Appendix I, M, R and P respectively.
本节给出两项关键实验和一项案例研究。首先,我们按照第 3.1 节的方法,在受约束的设定中检验所提出理论是否成立。其次,我们按照第 3.2 节,评估在训练中学到的概念上,抽样是否同时具有规定性与描述性成分。结果为该理论提供了显著证据。我们在 GPT-4(Achiam et al., 2023)、GPT-3.5-Turbo(Brown et al., 2020)、Claude(Anthropic, 2024)、Mixtral-8x7B(Jiang et al., 2024)、Mistral-7B(Jiang et al., 2023)的指令微调模型,以及 Llama-2 与 Llama-3 系列中的预训练模型和指令微调模型(Touvron et al., 2023)上测试,详见附录 B。除非另有说明,正文报告 GPT-4 的结果,其他模型的结果放在附录。各实验所用提示的全文分别见附录 I、M、R 和 P。
4.1 Sampling in relation to a novel concept
4.1 与新概念相关的抽样
Following Section 3.1, we empirically validate the proposed theory by constructing a constrained setting around a novel, fictional concept: “glubbing”. We also, consider multiple such random fictional concepts defined in different terms (Appendix H.3).
按照第 3.1 节,我们围绕一个新的虚构概念 “glubbing” 构造受约束的设定,对该理论做经验验证。我们也考虑了用不同表述定义的多种随机虚构概念(附录 H.3)。
We systematically vary and to study the effect on the distribution of samples . The rest of the prompt is kept similar to isolate the influence of descriptive and prescriptive components in the LLM’s sampling process so that there is no interference from prior knowledge and prompt artifacts. Importantly, the results are designed to reflect the heuristics of sampling of the LLM, independent of the prompt design or specific experimental conditions. The prompt contains (a) statistical norm defined by a hundred samples from a distribution corresponding to hours spent “glubbing” and (b) the ideality associated with each sample . is given by a grade on a scale of A+ to D-.
我们系统改变 和 ,以研究其对样本分布 的影响。提示的其余部分保持相近,以便分离描述性与规定性成分在 LLM 抽样过程中的作用,使先验知识和提示伪迹不发生干扰。重要的是,结果旨在反映 LLM 的抽样启发式,而不依赖于提示设计或具体实验条件。提示包含:(a)由一百个来自某分布的样本所定义的统计常态,对应该用于 “glubbing” 的小时数;(b)与每个样本 相关联的理想程度 。 用从 A+ 到 D- 的等级给出。
In this first run, “glubbing” hours of people is sampled from a Gaussian of mean 45 and a standard deviation of 15. We repeat the experiment with a bi-modal Gaussian distribution with modes at 35 and 65 and a standard deviation of 5. The implementation and analysis of the two experiments are the same.
在第一轮中,人们的 “glubbing” 时长从均值为 45、标准差为 15 的高斯分布中采样。我们还用众数位于 35 和 65、标准差为 5 的双峰高斯分布重复该实验。两项实验的实现与分析方式相同。
We evaluate the value system in three levels of valence: (a) positive, (b) negative, and (c) neutral (control experiment). For the positive , the grades are assigned such that the higher hours of “glubbing” get a better grade (best being A+), and for the negative value system, the grades are assigned such that the lower hours of “glubbing” get a better grade (on the same scale). A sample positive prompt is given below:
我们在三种效价水平上评估价值系统 :(a)正向,(b)负向,以及(c)中性(对照实验)。对正向的 ,等级的分配使 “glubbing” 时长越高,等级越好(最好为 A+);对负向的价值系统,等级的分配使 “glubbing” 时长越低,等级越好(同一量表)。下面给出一条正向提示的示例:
Prompt
There is a hobby called glubbing. Here are the glubbing hours of people and a grade associated, A+ being the highest grade and D- being the lowest grade: 43:C, 35:C-, 63:B+, …, 35:C-. .
提示词
存在一种名为 glubbing 的爱好。以下是人们的 glubbing 时长及相应等级,A+ 为最高等级,D- 为最低等级:43:C, 35:C-, 63:B+, …, 35:C-。<抽样提示词>。
The ‘…’ corresponds to the rest of the values and grades (the prompt has a hundred samples and corresponding grades). The full prompt set is given in Appendix I. The vanilla is: ‘Based on this, pick a sample number of glubbing hours’. Different sample prompts gives similar results as shown in H.3.
“…” 对应其余取值与等级(提示中有一百个样本及相应等级)。完整提示集见附录 I。默认的 <抽样提示词> 是:“Based on this, pick a sample number of glubbing hours”。如 H.3 所示,不同的抽样提示词会给出相似结果。
A shift between input distribution and sample distribution can be explained as the error of LLM in approximating the statistics of the input distribution. To exclude this alternative explanation, we compute the significance in the shift of generated samples () from the average reported by the LLM (). In the neutral control experiment, we assign the mean with the highest grade and lower grades for increasing distance from the mean. We run the experiment for positive, negative, and control settings a hundred times each.
输入分布与样本分布之间的偏移,也可以解释为 LLM 在近似输入分布统计量时的误差。为排除这一替代解释,我们计算生成样本()相对 LLM 所报告平均值()之偏移的显著性。在中性对照实验中,我们把最高等级赋给均值 ,并随着与均值距离的增大而降低等级。我们对正向、负向和对照三种设定各运行一百次。
Results: Table 1 shows the result for the mean of the hundred runs for the uni-modal and bi-modal input distributions, each with three different . Firstly, across the six settings, approximately coincide with the true distribution average (). For a neutral prescriptive norm (also for no prescriptive norm as shown later), and the input distribution and do not differ significantly, . Given the non-significant difference (), the result is consistent with the hypothesis that sampling reflects the input distribution’s statistical properties when no “ideal” is specified.
结果: 表 1 给出单峰与双峰输入分布、各自配合三种 时,一百次运行的均值。首先,在全部六种设定中, 都近似等于真实分布均值()。对中性的规定性规范(对后面所示的无规定性规范也一样),有 ,输入分布与 没有显著差异,。鉴于这一不显著的差异(),结果与如下假设相一致:在没有指定“理想”时,抽样反映的是输入分布的统计性质。
When is positive, the mean of samples is higher than the mean of the LLM-generated average. Also for negative , the mean of samples is lower than the mean of the LLM-generated average. For instance, in the uni-modal scenario, the mean for negative is 36.5, and positive is 46.7.
当 为正向时,样本均值高于 LLM 生成的平均值的均值。当 为负向时,样本均值则低于 LLM 生成的平均值的均值。例如,在单峰情形中,负向 下 的均值为 36.5,正向 下为 46.7。
When is positive, the distribution of and distribution of are significantly different, with p, and for a negative , p. This shows that the sample is not solely driven by the statistics of the input distribution, but also the prescriptive norm of the concept.
当 为正向时, 的分布与 的分布显著不同,p;当 为负向时,p。这表明,样本并非只由输入分布的统计量驱动,也被该概念的规定性规范所驱动。
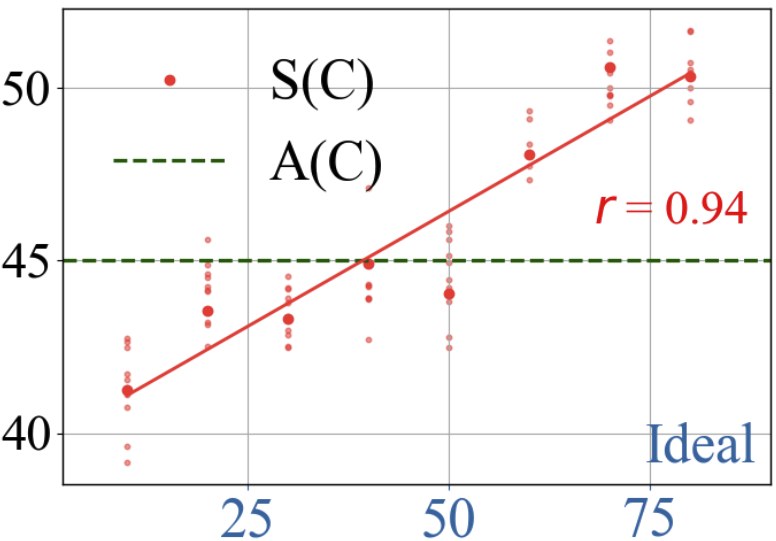
Figure 3: Variation of mean of with changing prescriptive value. X-axis shows the different prescriptive values and Y-axis shows the sample value. Sample is directly proportional to prescriptive value. Here approximately equal to .
图 3: 的均值随规定性取值变化。横轴是不同的规定性取值,纵轴是样本值。样本与规定性取值正相关。这里 ,约等于 。
Robustness of the experiment:
实验的稳健性:
We vary the mean of the input distribution to show the reliability of the conclusion in Appendix G. We show that for a range of , and for each of this , consistently shifts away from in the direction of . We also repeat this experiment with different newly introduced fictional scenarios (different tokens other than “glubbing” used to define the new concept) and also introduced them as different ideas (not just as a hobby, details in Appendix H.3). As an additional control, we repeat this experiment by assigning no grades and random grades to the input samples. We found no significant shift in the distribution of input samples and , p and p respectively.
我们改变输入分布的均值 ,以在附录 G 中说明结论的可靠性。我们表明,在一系列 上, ,并且对其中每一个 , 都持续地从 出发、朝 的方向偏移。我们还用新引入的不同虚构情景(用 “glubbing” 以外的词元来定义新概念)重复该实验,并把它们写成不同的想法(不只是一种爱好,细节见附录 H.3)。作为额外对照,我们还分别给输入样本不赋等级和随机赋等级,重复该实验。我们发现,输入样本分布与 之间没有显著偏移,p 和 p。
Note that, to ensure the observation is not merely an artifact of the prompt, we use the same prompt in all cases, varying only across the three runs. To further validate robustness of observation to the prompt, we use different in Appendix H.1. Results show that our conclusion holds for these variations. In Appendix H.1, H.2 we also show strong results that even explicit debasing prompt fails to undo the prescriptive component.
需要指出,为确保观察结果并非仅仅是提示带来的伪迹,我们在所有情形中使用相同提示,只在三次运行之间改变 。为进一步验证观察结果对提示的稳健性,我们在附录 H.1 中使用不同的 <抽样提示词>。结果表明,我们的结论在这些变体上仍然成立。在附录 H.1、H.2 中,我们还给出有力结果:即便使用显式的去偏提示,也无法消除规定性成分。
We scale this experiment by varying in the range of to in intervals of hundreds. For each we give eight different grading scheme: varying the number which gets the best grade in the intervals of ten. The grade reduces with distance on either side of the number with best grade (like a tent function). Each of the combination of and peak ideal is run hundred times and the mean deviation of sample is reported. An example plot of =45 and different peak ideal values is in Figure 3. Rest of the plots are in Figure 7. We see the pattern of sample consistently shifting from the descriptive component towards prescriptive component across the different runs.
我们通过把 在 到 之间按一百为间隔变化,来扩大该实验。对每个 ,我们给出八种不同的评分方案:把获得最高等级的数值按十为间隔变化。等级随与该最高分数值的距离在两侧递减(像一顶帐篷函数)。每一对 与理想高峰的组合都运行一百次,并报告样本的平均偏离。图 3 给出 =45 与 个不同理想高峰取值的示例图。其余图见图 7。我们看到,在不同运行中,样本都持续地从描述性成分朝规定性成分偏移。
| uni-modal | bi-modal | |||
|---|---|---|---|---|
| C_v: +ve | 44.94 | 46.72 | 44.97 | 47.43 |
| C_v: -ve | 44.99 | 36.50 | 45.03 | 41.26 |
| C_v: control | 45.01 | 44.95 | 44.94 | 44.95 |
Table 1: The table shows the change in mean of samples (mean of ) and the mean of reported average (mean of ). For these experiments , the result for other is given in Appendix G.
| 单峰 | 双峰 | |||
|---|---|---|---|---|
| :正向 | 44.94 | 46.72 | 44.97 | 47.43 |
| :负向 | 44.99 | 36.50 | 45.03 | 41.26 |
| :对照 | 45.01 | 44.95 | 44.94 | 44.95 |
表 1:该表显示样本均值( 的均值)与所报告平均值的均值( 的均值)如何变化。这些实验中 ,其他 的结果见附录 G。
We observe statistically significant results for most other evaluated LLMs. Results for GPT-4 (with temperature set to zero), GPT-3.5-Turbo, Claude, Mixtral-8x7B, Mistral-7B, and Llama models are in Appendix O. For example, Claude-Opus, with a negative and positive , is statistically significant from with p.
在多数其他被评估的 LLM 上,我们也观察到统计显著的结果。GPT-4(温度为零)、GPT-3.5-Turbo、Claude、Mixtral-8x7B、Mistral-7B 以及 Llama 模型的结果见附录 O。例如,对 Claude-Opus,在负向和正向 下, 相对 都具有统计显著性,p。
4.2 Sampling in relation to existing concepts
4.2 与既有概念相关的抽样
In this experiment, the statistics and value system for a concept are implicit in the LLM and unknown to us. We empirically evaluate the proposed theory on 500 different concepts () spanning 10 different domains. The full list of concepts are in the Appendix R. For each concept, we first ask the model to report its notion of (a) the average () and (b) the ideal () for a given concept . We then give a sample prompt for concept to get (c) sample (). These prompts are given in independent contexts. To get these values, we use a prompt similar to the questions used in human studies (Bear et al., 2020). For example, to get the average, ideal, and the sample on the concept of ‘TV watching hours of people’, we use the following prompts:
在本实验中,概念 的统计量 与价值系统 隐含在 LLM 内部,我们并不知道。我们在跨越 10 个不同领域的 500 个不同概念()上对该理论做经验评估。完整概念列表见附录 R。对每个概念,我们先让模型报告其对给定概念 的(a)平均值()和(b)理想值()的看法。然后我们给出关于概念 的抽样提示,得到(c)样本()。这些提示放在相互独立的上下文中。为得到这些值,我们使用与人类研究中问题相近的提示(Bear et al., 2020)。例如,为得到人们“看电视时长”这一概念上的平均值、理想值和样本,我们使用如下提示:
| Model Name | Significance | Fraction |
|---|---|---|
| Llama-2-7b | 6.837e-02 | 0.539 |
| Llama-2-7b instruct | 3.874e-06 | 0.607 |
| Llama-2-13b | 3.952e-06 | 0.613 |
| Llama-2-13b-chat | 3.023e-10 | 0.642 |
| Llama-2-70b | 4.496e-07 | 0.622 |
| Llama-2-70b-chat | 1.583e-16 | 0.688 |
| Llama-3-8b | 1.109e-05 | 0.608 |
| Llama-3-8b-Instruct | 9.277e-22 | 0.716 |
| Llama-3-70b | 3.041e-21 | 0.726 |
| Llama-3-70b-Instruct | 5.382e-35 | 0.777 |
| Claude | 1.582e-16 | 0.688 |
| Mixtral-8x7B | 9.289e-22 | 0.716 |
| Mistral-7B | 1.114e-05 | 0.608 |
| GPT-4 | 5.506e-15 | 0.680 |
Table 2: Model comparison across LLMs showing influence of the prescriptive component in existing concepts.The fraction indicates the proportion of concepts within each domain for which the LLM’s sampled value deviates from the average in the direction of the ideal. The table shows a larger influence of prescriptive norms for larger model sizes and higher for RLHF compared to pretrained-only models.
| 模型名称 | 显著性 | 比例 |
|---|---|---|
| Llama-2-7b | 6.837e-02 | 0.539 |
| Llama-2-7b instruct | 3.874e-06 | 0.607 |
| Llama-2-13b | 3.952e-06 | 0.613 |
| Llama-2-13b-chat | 3.023e-10 | 0.642 |
| Llama-2-70b | 4.496e-07 | 0.622 |
| Llama-2-70b-chat | 1.583e-16 | 0.688 |
| Llama-3-8b | 1.109e-05 | 0.608 |
| Llama-3-8b-Instruct | 9.277e-22 | 0.716 |
| Llama-3-70b | 3.041e-21 | 0.726 |
| Llama-3-70b-Instruct | 5.382e-35 | 0.777 |
| Claude | 1.582e-16 | 0.688 |
| Mixtral-8x7B | 9.289e-22 | 0.716 |
| Mistral-7B | 1.114e-05 | 0.608 |
| GPT-4 | 5.506e-15 | 0.680 |
表 2:各 LLM 的模型比较,显示规定性成分在既有概念上的影响。比例表示:在各领域中,LLM 的抽样值从平均值出发、朝理想方向偏离的概念所占份额。该表显示,规定性规范的影响在更大规模的模型上更大,并且经过 RLHF 的模型高于仅预训练的模型。
Results: In GPT-4, for each concept, we run the three prompts ten times with a temperature of 0.8 and report the average in Table 2. Prompts failed for 10 concepts and the value of and were the same for 46 concepts. For the rest of the concepts, we observe that 304/444 samples fall on the ideal side of average (positive ). This gives a statistical significance of , a very high statistical significance, reducing the likelihood of the result being due to chance. The result gives strong evidence to the proposed theory.
结果: 在 GPT-4 上,我们对每个概念把这三条提示各运行十次,温度为 0.8,并在表 2 中报告平均值。有 10 个概念的提示失败,另有 46 个概念的 与 相同。对其余概念,我们观察到 304/444 个样本落在平均值的理想一侧(正向 )。这给出 的统计显著性,显著性非常高,降低了该结果仅由偶然产生的可能性。这一结果为所提出的理论提供了有力证据。
Except for the Llama-2-7b base, all the other LLMs show a statistically significant deviation towards the prescriptive norm and even this model is only marginally insignificant. We also make the following observations:
除 Llama-2-7b 基座模型外,其余 LLM 都表现出朝规定性规范的统计显著偏离,即便该模型也只是略不显著。我们还有如下观察:
- • The influence of prescriptive norms seems to get larger as the model size increases.
- • 规定性规范的影响似乎随模型规模增大而变强。
- • Prescriptive norm seems to stem from pretraining rather than RLHF, though RLHF exacerbates it.
- • 规定性规范似乎源自闭预训练而非 RLHF,尽管 RLHF 会再放大它。
Our results suggest that the significance of the observation tends to increase with model size/capability. Such an ‘inverse scaling law’ (McKenzie et al., 2023) should be taken into account in scenarios like the case study given below.
我们的结果表明,该观察的显著性往往随模型规模/能力提高而增大。在如下案例所示的情形中,应当把这种“反向扩展定律”(McKenzie et al., 2023)考虑在内。
Case study for medical recovery time:
Deviation of a sample towards the prescriptive norm can help explain some biases of LLMs. To illustrate this, we present a case study based on a real-world scenario. The LLM agent is assigned the role of a doctor and asked to take a decision on the discharge time of a patient based on a list of symptoms. Here the action space is the positive rational numbers (number of weeks). Once the LLM gives a recovery time we also get self reported average and ideal recovery time from the LLM. The term self-reported average refers explicitly to the average values directly provided by the LLM itself when prompted to report average.
医疗康复时间案例:
样本朝规定性规范的偏离,有助于解释 LLM 的某些偏倚。为说明这一点,我们给出一项基于现实情景的案例研究。LLM 智能体被赋予医生角色,并被要求根据一份症状列表,决定患者的出院时间。这里的行动空间是正有理数(周数)。一旦 LLM 给出康复时间,我们还会从该 LLM 得到它自行报告的平均和理想康复时间。所谓自行报告的平均值,明确是指在被提示报告平均值时,由 LLM 本身直接给出的平均值。
The setup is similar to Experiment 4.2, but we prompt the LLM to be a doctor and give output (in weeks) based on a given list of four symptoms. We find that the LLM significantly deviates from statistical norm recovery time towards a notion of an ideal when one might assume and, in fact in this example, require that the LLM is using only the statistical norm. Out of the 35 symptom batches (each of four symptoms), the sample falls on the ideal side of average 26 times-a statistically significant shift (binomial = 0.003).
该设定与实验 4.2 类似,但我们提示 LLM 扮演医生,并根据给定的四项症状给出输出(以周计)。我们发现,LLM 会显著地从统计常态下的康复时间,朝某种理想观念偏离;而人们或许会假定——并且在本例中事实上要求——LLM 只使用统计常态。在 35 组症状(每组四项)中,样本有 26 次落在平均值的理想一侧,这是一次统计显著的偏移(二项检验 = 0.003)。
The ideal value given by the LLM, is lower than the average value in 30 of the 35 symptoms. This implies that the sample is often pulled below the average. This finding indicates that LLMs’ decision-making regarding patient recovery times is compromised by a prescriptive component, which has significant implications for clinical decision-making, resource allocation in hospitals, and potential risks to patient safety. The full list of the symptoms and the exact prompts used is given in the Appendix N.
在 35 组症状中,有 30 组 LLM 给出的理想值低于平均值。这意味着样本常常被拉到平均值以下。这一发现表明,LLM 关于患者康复时间的决策受到规定性成分的损害,这对临床决策、医院的资源配置以及患者安全的潜在风险都有重要含义。完整的症状列表及所用的确切提示见附录 N。
5 Prescriptive component in concept prototypes
5 概念原型中的规定性成分
One of the basic characteristics of System-1 is that it represents concepts with prototypical examples Kahneman (2011). In humans, though a prototype is often understood as the most typical/representative member of a concept (Murphy, 2004), they are found to embody both statistical regularities and goal-oriented ideals within a concept (Barsalou, 1985).
System-1 的一项基本特征是,它用原型性的例子来表示概念(Kahneman 2011)。在人类中,尽管原型常常被理解成一个概念最典型/最有代表性的成员(Murphy, 2004),但它们被发现既体现统计规律,也体现一个概念内部面向目标的理想(Barsalou, 1985)。
For instance, a ‘Robin’ might be considered a prototype of the concept ‘Bird’, as it shares many common features with most birds with high occurrence (statistics), and has the ability to fly (a value expected of birds), making it a prototypical example of the concept ‘bird’ (Smith and Medin, 1981). For this reason, penguin-a flightless bird, is less prototypical bird than ‘Robin’. Prototypicality defines normality of a concept that drive the sampling (Appendix F).
例如,“知更鸟” 可能被看成概念 “鸟” 的一个原型,因为它与大多数鸟共享许多常见特征、出现频率高(统计),并且能够飞翔(对鸟所期望的一种价值),从而成为概念 “鸟” 的原型例子(Smith and Medin, 1981)。也因为如此,企鹅这种不会飞的鸟,其作为鸟的原型性低于 “知更鸟”。原型性定义了一个概念的常态,并驱动抽样(附录 F)。
Unlike humans, it is not clear whether LLMs rely on concept prototypes for sampling. But since the sampling heuristics of LLMs converge with humans, it is interesting to investigate concept prototypicality in LLMs. We do not claim that LLMs output is prototype driven, but make an initial exploration in this direction using the exact setting as in Bear and Knobe (2017).
与人类不同,LLM 是否依赖概念原型来抽样,并不清楚。但由于 LLM 的抽样启发式与人类发生了汇聚,考察 LLM 中的概念原型性就变得有意思。我们并不主张 LLM 的输出是由原型驱动的,而只是用与 Bear and Knobe(2017)完全相同的设定,在这一方向上做初步探索。
We use eight concepts, and for each concept , six different exemplars. Exemplars are short descriptions of items of a concept. For instance, for the concept of ‘High-school teacher’, the first exemplar is as follows: ‘A 30-year-old woman who basically knows the material she is teaching but is relatively uninspiring, boring to listen to, and not particularly fond of her job’.
我们使用八个概念,对每个概念 给出六个不同的例示。例示是对某个概念之实例的简短描述。例如,对 “中学教师” 这一概念,第一个例示如下:“一位 30 岁的女性,基本上掌握所教内容,但相对缺乏感染力,听起来枯燥,而且并不特别喜欢自己的工作”。
Similar to experiment protocol in Bear and Knobe (2017), LLMs rate each exemplars on three dimensions: average, ideal, and the prototypicality of the exemplar. Prototypicality score is derived by averaging three entities, which measure the degree to which the given prototype is a “good example”, “paradigmatic example”, or “prototypical example” Bear and Knobe (2017). The LLM is asked to rate on a 7-point scale ranging from not at all average/ideal/‘good example’, which has a score of 0, to completely average/ideal/‘good example’, with a score 7. The full set of concepts and exemplars are in Appendix P.
与 Bear and Knobe(2017)中的实验规程类似,LLM 在三个维度上给每个例示打分:平均、理想,以及该例示的原型性。原型性分数由三项平均得到,这三项分别衡量给定原型在多大程度上是一个“好例子”、“典范例子”或“原型性例子”(Bear and Knobe 2017)。LLM 被要求在 7 点量表上打分,从完全不是平均/理想/“好例子”(分数为 0),到完全是平均/理想/“好例子”(分数为 7)。完整的概念与例示集合见附录 P。
As in the previous section 3.2, we check whether the prototypicality rating of the concepts falls on the ideal side of the average. To test significance, we do a binomial test across concepts to check if LLMs conception of prototypes has a perspective component. The evaluation is similar to the previous section.
与前面第 3.2 节一样,我们检查各概念的原型性评分是否落在平均值的理想一侧。为检验显著性,我们在各概念上做二项检验,检查 LLM 对原型的构想是否具有规定性成分。评估方式与上一节类似。
| Concept | Average | Ideal | Prototype |
|---|---|---|---|
| High-school teacher | 2.75 | 3.66 | 3.86 |
| Dog | 3.08 | 3.83 | 3.86 |
| Salad | 4.5 | 4.5 | 5.44 |
| Grandmother | 4.16 | 4.66 | 4.75 |
| Hospital | 2.91 | 3.5 | 3.55 |
| Stereo speakers | 2.92 | 4.16 | 3.61 |
| Vacation | 3.08 | 4.75 | 4.63 |
| Car | 2.58 | 4.083 | 4.11 |
Table 3: Concepts and scores averaged across exemplars showing how the prototypical score doesn’t coincide with just the average but also has an ideal component.
| 概念 | 平均 | 理想 | 原型 |
|---|---|---|---|
| 中学教师 | 2.75 | 3.66 | 3.86 |
| 狗 | 3.08 | 3.83 | 3.86 |
| 沙拉 | 4.5 | 4.5 | 5.44 |
| 祖母 | 4.16 | 4.66 | 4.75 |
| 医院 | 2.91 | 3.5 | 3.55 |
| 立体声音箱 | 2.92 | 4.16 | 3.61 |
| 度假 | 3.08 | 4.75 | 4.63 |
| 汽车 | 2.58 | 4.083 | 4.11 |
表 3:各概念上、跨例示平均后的分数,表明原型分数并不只与平均值重合,还带有理想成分。
We run this experiment ten times on GPT-4 with a temperature of 0.8 and report the average results. The average scores from the three prototypicality assessments (“good”, “paradigmatic”, and “prototypical” example) demonstrate satisfactory internal consistency, with a Cronbach’s alpha of 0.96. Consequently, these scores were combined to form a single, comprehensive prototypicality rating. The aggregate results for each concept, averaged across exemplars, are given in Table 3. The results show a significant effect of a prescriptive component with 39 out of 46 falling on the ideal side of the average (binomial 0.001).
我们在 GPT-4 上以温度 0.8 将该实验运行十次,并报告平均结果。来自三项原型性评估(“好的”“典范的”和“原型性的”例子)的平均分数表现出令人满意的内部一致性,Cronbach’s alpha 为 0.96。因此,这些分数被合并成一项综合的原型性评分。每个概念跨例示平均后的汇总结果见表 3。结果表明规定性成分具有显著效应:46 项中有 39 项落在平均值的理想一侧(二项检验 0.001)。
Evaluating across different LLMs, we obtain the following results: Llama-3-7b (binomial = 0.003), Mixtral-8x7B (binomial = 0.05), GPT3.5-turbo (binomial < 0.001), Claude (binomial < 0.001), Mistral (binomial = 0.0019), indicating the effect of prescriptive norms in prototypes of concepts. The complete set of results for every exemplar is given in Appendix Q. This experiment is an initial exploration, finding that LLMs’ concept of prototypes is influenced not only by statistical averages but also by an underlying prescriptive norm. These findings suggest that the LLM’s judgment of what constitutes a typical or prototypical example is systematically biased toward idealized representations calling for further investigations in this direction.
在不同 LLM 上评估,我们得到如下结果:Llama-3-7b(二项检验 = 0.003)、Mixtral-8x7B(二项检验 = 0.05)、GPT3.5-turbo(二项检验 < 0.001)、Claude(二项检验 < 0.001)、Mistral(二项检验 = 0.0019),表明规定性规范会进入概念的原型。每个例示的完整结果见附录 Q。本实验是一项初步探索,发现 LLM 对原型的概念不仅受统计平均值影响,还受一种底层规定性规范影响。这些发现表明,LLM 对何为典型或原型性例子的判断,会系统地偏向理想化表征,值得在这一方向上做进一步研究。
6 Comparison with human studies
6 与人类研究的比较
The critical experiment presented in Section 4.1 is inspired by prior work with humans Bear et al. (2020). In Appendix D, we present the results of the study conducted on human subjects. We replicate the exact setting using an LLM with a human-like prompts (Appendix J) and report the results in a similar visualization to facilitate a direct comparison. Our results show that, given a new fictional concept with prescriptive and descriptive statistics, humans and LLMs capture these norms and use them to sample options. Morever, we also note that LLMs, like humans seem to have an asymmetric treatment of gains and losses. The undersampling of negative value scenarios is observed to be more than oversampling of the positive value scenarios, potentially pointing to a shared optimism bias. This asymmetry, where both systems avoid negatives more strongly than they pursue positives, can be explored in future work.
第 4.1 节给出的关键实验,受到先前人类工作的启发(Bear et al. 2020)。在附录 D 中,我们给出在人类被试上开展的研究结果。我们用接近人类用语的提示(附录 J),在 LLM 上复现完全相同的设定,并用相似的可视化报告结果,以便直接比较。我们的结果表明,在给定一个带有规定性与描述性统计量的新虚构概念时,人类和 LLM 都会捕捉这些规范,并用它们来抽样选项。此外我们还注意到,LLM 似乎也像人类一样,对收益和损失有不对称的处理。对负向价值情景的抽样不足,看起来大于对正向价值情景的抽样过多,这或许指向一种共有的乐观偏倚。这种双方都更强烈地回避负面、而不是同等力度地追求正面的不对称,可以在后续工作中探讨。
Furthermore, we also create exact setting for experiment 3.2 and compare the LLM and human outputs in Appendix E for known concepts. Here we use the same forty concepts used in humans studies to compare the results of LLM and humans. The comparison shows consistency of prescriptive influences across both human cognitive processes and LLM sampling. While both systems exhibit prescriptive components in sampling, a key divergence emerges in their treatment of ideals. Humans consistently conceptualize ideal as modest improvements over statistics (e.g., ideal ‘number of sugary drinks per week’ is while the average is ), whereas LLMs frequently default to absolute and stricter ideals (e.g., for sugary drinks and other concepts) indicating moral absolutism which could be a topic of future investigation.
此外,我们也为实验 3.2 构造了完全相同的设定,并在附录 E 中对已知概念比较 LLM 与人类的输出。这里我们使用人类研究中用过的那四十个概念,比较 LLM 与人类的结果。比较显示,规定性影响在人类认知过程和 LLM 抽样中都持续存在。尽管两套系统在抽样中都表现出规定性成分,它们对理想的处理却出现关键分歧。人类一贯把理想构想成相对统计值的温和改进(例如,理想的“每周含糖饮料数量”是 ,而平均值是 ),而 LLM 则常常默认采用绝对且更严格的理想(例如含糖饮料为 ,另外还有 18 个概念也是如此),表现出道德绝对化,这可以成为后续研究的课题。
Finally, the investigation on prototypes presented in Section 5 follows the same prompt as human studies. Hence we do not need an explicit recreation of the human prompt for this experiment. This shows initial evidence that concept prototypicality scoring in LLMs are driven by the same components as in humans. Interestingly, scatter plot of for LLMs and humans for prototypicality 6 (right) show that, the amplitude of the influence of prescriptive component in sampling also correlate with that of humans ( Pearson correlation of 0.33).
最后,第 5 节中关于原型的考察沿用了与人类研究相同的提示。因此,对本实验我们不必再专门复现人类提示。这初步表明,LLM 中的概念原型性评分由与人类相同的成分驱动。有意思的是,LLM 与人类在原型性上的 散点图(图 6(右))显示,规定性成分对抽样之影响的幅度,也与人类相关( 的 Pearson 相关为 0.33)。
As a final note, our experiments probe systematic patterns in LLM outputs, revealing biases and decision tendencies analogous to human behavioral studies. We do not presuppose that these patterns emerge from human-like reasoning mechanisms.
作为最后一点说明,我们的实验考察的是 LLM 输出中的系统性模式,揭示出类似于人类行为研究的偏倚与决策倾向。我们并不预先假定这些模式来自类似人类的推理机制。
7 Conclusion
7 结论
In this paper, we set out to better understand the heuristics governing possibility sampling process of LLMs. Based on human cognitive studies, we propose a theory that explains the sampling heuristics to be part descriptive and part prescriptive. However, the exact prescriptive component might not be aligned with humans. As LLMs continue to be integrated into real-world applications, understanding their decision-making heuristics becomes increasingly important. Our results provide a foundational framework for evaluating how LLMs balance statistically probable outcomes with norms of ideality, raising interesting questions about their underlying representations. As a final remark, we would like to emphasize that we do not intend to contribute to “humanizing” AI/ML/LLMs in the way we use terminology or models. Instead, our contribution is intended to draw parallels in behaviour and perform evaluations, as our findings can have an impact on downstream tasks.
在本文中,我们试图更好地理解支配 LLM 可能性抽样过程的启发式。基于人类认知研究,我们提出一套理论,把抽样启发式解释为部分是描述性的、部分是规定性的。不过,确切的规定性成分未必与人类对齐。随着 LLM 继续被纳入现实应用,理解它们的决策启发式变得越来越重要。我们的结果提供了一个基础框架,用来评估 LLM 如何在统计上可能的结果与理想规范之间取得平衡,并对其底层表征提出了有意思的问题。作为最后一点,我们想强调:我们并不打算在术语或模型的使用上,为把人工智能/机器学习/大语言模型“人格化”作贡献。相反,我们的贡献旨在画出行为上的平行,并开展评估,因为我们的发现可能影响下游任务。
8 Acknowledgements
8 致谢
This work was partially funded by ELSA – European Lighthouse on Secure and Safe AI funded by the European Union under grant agreement No.101070617. Views and opinions expressed are, however, those of the authors only and do not necessarily reflect those of the European Union or European Commission. Neither the European Union nor the European Commission can be held responsible for them. The project on which this report is based was funded by the Federal Ministry of Education and Research under the funding code 16KIS2012. The responsibility for the content of this publication lies with the authors.
本工作部分由 ELSA——欧洲安全可靠人工智能灯塔资助,该项目由欧盟按资助协议第 101070617 号提供资金。所述观点仅代表作者,并不必然反映欧盟或欧盟委员会的立场。欧盟及欧盟委员会均不对其负责。本报告所依据的项目由德国联邦教育研究部按资助编号 16KIS2012 提供资金。本出版物内容的责任在作者。
9 Limitations
9 局限
Although we identify a prescriptive component influencing LLM outputs, the origin of these norms, whether they stem from the pre-training data, reinforcement learning from human feedback (RLHF), or some other aspect of model training remains under-explored. Further analysis is required to disentangle the contributions of training data versus fine-tuning techniques in shaping prescriptive tendencies in LLMs. Clarifying these origins could inform strategies to better control or mitigate unintended prescriptive biases in model outputs. The paper also does not explore the mechanism of how norms affect heuristics.
尽管我们识别出一种影响 LLM 输出的规定性成分,这些规范的来源——究竟来自闭预训练数据、来自人类反馈强化学习(RLHF),还是来自模型训练的其他方面——仍缺少充分探讨。还需要进一步分析,才能把训练数据与微调技术在塑造 LLM 规定性倾向中的贡献分开。澄清这些来源,可能有助于形成更好的策略,以控制或减轻模型输出中非预期的规定性偏倚。本文也没有探讨规范如何作用于启发式的机制。
Furthermore, this work evaluates prototypicality in LLM similar to evaluation in human subjects. But, prototypicality in neural networks can be studied more closely using their representations. Though the prototypical analysis is stated as an initial exploration in the manuscript, it calls for further research in mechanistic analysis of how prototypes contain prescriptive norms and the possibility of steering and controlling of these norms in concept representations.
此外,本工作对 LLM 中原型性的评估类似于对人类被试的评估。但神经网络中的原型性,可以更贴近地借助其表征来研究。尽管正文把原型分析表述为初步探索,它仍呼唤在机制分析上做进一步研究:原型如何包含规定性规范,以及是否有可能在概念表征中转向并控制这些规范。
10 Ethics and Risks
10 伦理与风险
This paper investigates the sampling heuristics of LLMs, revealing a prescriptive bias that may impact decision-making in real-world applications. While such biases could align outputs with certain normative expectations, they raise ethical concerns as there is no guarantee of such an alignment. This is particularly important in contexts like healthcare and policy-making, where fairness and transparency are critical. Understanding and mitigating these biases is essential to prevent unintended harm and ensure the responsible deployment of LLMs.
本文考察 LLM 的抽样启发式,揭示出一种可能影响现实应用中决策的规定性偏倚。尽管这类偏倚可能使输出与某些规范性期望对齐,但由于并不保证存在这种对齐,它们会引出伦理上的关切。这在医疗和政策制定等对公平和透明要求很高的情境中尤为重要。理解并减轻这些偏倚,对防止非预期伤害、确保负责任地部署 LLM 至关重要。
Furthermore, we hypothesise that this prescriptive norm acts as a foundational bias in other biases found in LLMs like gender, demography, etc which could be looked at through the lens of value. Since there are no guarantees on the ideals of LLMs, LLM sampled options can appear with different biases under different concepts/domains. This raises important ethical concerns, potentially leading to outputs that do not reflect (a) real-world norms or (b) diverse perspectives. Addressing influence of prescriptive norms is essential for developing transparent, reliable, and fair AI technologies, ensuring they contribute positively and ethically across various societal applications.
此外,我们猜想,这种规定性规范会作为基础性偏倚,进入 LLM 中已发现的其他偏倚,例如性别、人口统计等,这些都可以从价值的角度来看。由于对 LLM 的理想并没有保证,在不同概念/领域下,LLM 抽到的选项可能呈现出不同的偏倚。这会引出重要的伦理关切,可能导致输出既不反映(a)现实世界的规范,也不反映(b)多样的视角。处理规定性规范的影响,对发展透明、可靠且公平的人工智能技术至关重要,以确保它们在各种社会应用中带来正面且合乎伦理的贡献。
References
参考文献
Achiam et al. (2023) Josh Achiam, Steven Adler, Sandhini Agarwal, Lama Ahmad, Ilge Akkaya, Florencia Leoni Aleman, Diogo Almeida, Janko Altenschmidt, Sam Altman, Shyamal Anadkat, et al. 2023. Gpt-4 technical report. arXiv preprint arXiv:2303.08774 .
Anthropic (2024) AI Anthropic. 2024. The claude 3 model family: Opus, sonnet, haiku. Claude-3 Model Card .
Barsalou (1985) Lawrence W Barsalou. 1985. Ideals, central tendency, and frequency of instantiation as determinants of graded structure in categories. Journal of experimental psychology: learning, memory, and cognition , 11(4):629.
Bear et al. (2020) Adam Bear, Samantha Bensinger, Julian Jara-Ettinger, Joshua Knobe, and Fiery Cushman. 2020. What comes to mind? Cognition , 194:104057.
Bear and Knobe (2017) Adam Bear and Joshua Knobe. 2017. Normality: Part descriptive, part prescriptive. Cognition , 167:25–37.
Bender et al. (2021) Emily M Bender, Timnit Gebru, Angelina McMillan-Major, and Shmargaret Shmitchell. 2021. On the dangers of stochastic parrots: Can language models be too big? In Proceedings of the 2021 ACM conference on fairness, accountability, and transparency , pages 610–623.
Brown et al. (2020) Tom Brown, Benjamin Mann, Nick Ryder, Melanie Subbiah, Jared D Kaplan, Prafulla Dhariwal, Arvind Neelakantan, Pranav Shyam, Girish Sastry, Amanda Askell, et al. 2020. Language models are few-shot learners. Advances in neural information processing systems , 33:1877–1901.
Gallegos et al. (2024) Isabel O Gallegos, Ryan A Rossi, Joe Barrow, Md Mehrab Tanjim, Sungchul Kim, Franck Dernoncourt, Tong Yu, Ruiyi Zhang, and Nesreen K Ahmed. 2024. Bias and fairness in large language models: A survey. Computational Linguistics , 50(3):1097–1179.
Gigerenzer and Gaissmaier (2011) Gerd Gigerenzer and Wolfgang Gaissmaier. 2011. Heuristic decision making. Annual review of psychology , 62(1):451–482.
Gu et al. (2025) Jia Gu, Liang Pang, Huawei Shen, and Xueqi Cheng. 2025. Do LLMs play dice? exploring probability distribution sampling in large language models for behavioral simulation . In Proceedings of the 31st International Conference on Computational Linguistics , pages 5375–5390, Abu Dhabi, UAE. Association for Computational Linguistics.
Guo et al. (2025) Daya Guo, Dejian Yang, Haowei Zhang, Junxiao Song, Ruoyu Zhang, Runxin Xu, Qihao Zhu, Shirong Ma, Peiyi Wang, Xiao Bi, et al. 2025. Deepseek-r1: Incentivizing reasoning capability in llms via reinforcement learning. arXiv preprint arXiv:2501.12948 .
Hastings (2024) Janna Hastings. 2024. Preventing harm from non-conscious bias in medical generative ai. The Lancet Digital Health , 6(1):e2–e3.
Hazra et al. (2024) Rishi Hazra, Pedro Zuidberg Dos Martires, and Luc De Raedt. 2024. Saycanpay: Heuristic planning with large language models using learnable domain knowledge. In Proceedings of the AAAI Conference on Artificial Intelligence , volume 38, pages 20123–20133.
Jiang et al. (2023) Albert Q Jiang, Alexandre Sablayrolles, Arthur Mensch, Chris Bamford, Devendra Singh Chaplot, Diego de las Casas, Florian Bressand, Gianna Lengyel, Guillaume Lample, Lucile Saulnier, et al. 2023. Mistral 7b. arXiv preprint arXiv:2310.06825 .
Jiang et al. (2024) Albert Q Jiang, Alexandre Sablayrolles, Antoine Roux, Arthur Mensch, Blanche Savary, Chris Bamford, Devendra Singh Chaplot, Diego de las Casas, Emma Bou Hanna, Florian Bressand, et al. 2024. Mixtral of experts. arXiv preprint arXiv:2401.04088 .
Jin and Rinard (2024) Charles Jin and Martin Rinard. 2024. Emergent representations of program semantics in language models trained on programs. In Forty-first International Conference on Machine Learning .
Kahneman (2011) Daniel Kahneman. 2011. Fast and slow thinking. Allen Lane and Penguin Books, New York .
Lampinen et al. (2024) Andrew K Lampinen, Ishita Dasgupta, Stephanie CY Chan, Hannah R Sheahan, Antonia Creswell, Dharshan Kumaran, James L McClelland, and Felix Hill. 2024. Language models, like humans, show content effects on reasoning tasks. PNAS nexus , 3(7):pgae233.
Li et al. (2023) Kenneth Li, Aspen K Hopkins, David Bau, Fernanda Viégas, Hanspeter Pfister, and Martin Wattenberg. 2023. Emergent world representations: Exploring a sequence model trained on a synthetic task. ICLR .
Li et al. (2025) Zhong-Zhi Li, Duzhen Zhang, Ming-Liang Zhang, Jiaxin Zhang, Zengyan Liu, Yuxuan Yao, Haotian Xu, Junhao Zheng, Pei-Jie Wang, Xiuyi Chen, et al. 2025. From system 1 to system 2: A survey of reasoning large language models. arXiv preprint arXiv:2502.17419 .
Mattar and Daw (2018) Marcelo G Mattar and Nathaniel D Daw. 2018. Prioritized memory access explains planning and hippocampal replay. Nature neuroscience , 21(11):1609–1617.
Mattar and Lengyel (2022) Marcelo G Mattar and Máté Lengyel. 2022. Planning in the brain. Neuron , 110(6):914–934.
McKenzie et al. (2023) Ian R McKenzie, Alexander Lyzhov, Michael Pieler, Alicia Parrish, Aaron Mueller, Ameya Prabhu, Euan McLean, Aaron Kirtland, Alexis Ross, Alisa Liu, et al. 2023. Inverse scaling: When bigger isn’t better. arXiv preprint arXiv:2306.09479 .
Murphy (2004) Gregory Murphy. 2004. The big book of concepts . MIT press.
Omiye et al. (2023) Jesutofunmi A Omiye, Jenna C Lester, Simon Spichak, Veronica Rotemberg, and Roxana Daneshjou. 2023. Large language models propagate race-based medicine. NPJ Digital Medicine , 6(1):195.
OpenAI (2024) OpenAI. 2024. Learning to reason with llms . Accessed: 2025-05-30.
Phillips et al. (2019) Jonathan Phillips, Adam Morris, and Fiery Cushman. 2019. How we know what not to think. Trends in cognitive sciences , 23(12):1026–1040.
Ross et al. (2023) Wendy Ross, Vlad Glăveanu, and Roy F Baumeister. 2023. The new science of possibility. Possibility Studies Society , 1(4):399–403.
Shah et al. (2023) Dhruv Shah, Michael Robert Equi, Błażej Osiński, Fei Xia, Brian Ichter, and Sergey Levine. 2023. Navigation with large language models: Semantic guesswork as a heuristic for planning. In Conference on Robot Learning , pages 2683–2699. PMLR.
Silver et al. (2016) David Silver, Aja Huang, Chris J Maddison, Arthur Guez, Laurent Sifre, George Van Den Driessche, Julian Schrittwieser, Ioannis Antonoglou, Veda Panneershelvam, Marc Lanctot, et al. 2016. Mastering the game of go with deep neural networks and tree search. nature , 529(7587):484–489.
Smith and Medin (1981) Edward E Smith and Douglas L Medin. 1981. Categories and concepts . Harvard University Press.
Suri et al. (2024) Gaurav Suri, Lily R Slater, Ali Ziaee, and Morgan Nguyen. 2024. Do large language models show decision heuristics similar to humans? a case study using gpt-3.5. Journal of Experimental Psychology: General , 153(4):1066.
Thirunavukarasu et al. (2023) Arun James Thirunavukarasu, Darren Shu Jeng Ting, Kabilan Elangovan, Laura Gutierrez, Ting Fang Tan, and Daniel Shu Wei Ting. 2023. Large language models in medicine. Nature medicine , 29(8):1930–1940.
Touvron et al. (2023) Hugo Touvron, Thibaut Lavril, Gautier Izacard, Xavier Martinet, Marie-Anne Lachaux, Timothée Lacroix, Baptiste Rozière, Naman Goyal, Eric Hambro, Faisal Azhar, et al. 2023. Llama: Open and efficient foundation language models. arXiv preprint arXiv:2302.13971 .
Wan et al. (2023) Yixin Wan, George Pu, Jiao Sun, Aparna Garimella, Kai-Wei Chang, and Nanyun Peng. 2023. “kelly is a warm person, joseph is a role model”: Gender biases in llm-generated reference letters. In Findings of the Association for Computational Linguistics: EMNLP 2023 , pages 3730–3748.
Wei et al. (2022) Jason Wei, Xuezhi Wang, Dale Schuurmans, Maarten Bosma, Fei Xia, Ed Chi, Quoc V Le, Denny Zhou, et al. 2022. Chain-of-thought prompting elicits reasoning in large language models. Advances in Neural Information Processing Systems , 35:24824–24837.
Yao et al. (2023) Shunyu Yao, Dian Yu, Jeffrey Zhao, Izhak Shafran, Tom Griffiths, Yuan Cao, and Karthik Narasimhan. 2023. Tree of thoughts: Deliberate problem solving with large language models. Advances in neural information processing systems , 36:11809–11822.
Zack et al. (2024) Travis Zack, Eric Lehman, Mirac Suzgun, Jorge A Rodriguez, Leo Anthony Celi, Judy Gichoya, Dan Jurafsky, Peter Szolovits, David W Bates, Raja-Elie E Abdulnour, et al. 2024. Assessing the potential of gpt-4 to perpetuate racial and gender biases in health care: a model evaluation study. The Lancet Digital Health , 6(1):e12–e22.
Appendix
附录
Appendix A Glossary
附录 A 术语表
- • Sampling: The process of selecting one or more outcomes from a set of possible options based on some probability distribution. In the context of the manuscript sampling is defined the process by which the LLM probabilistically selects outputs from a distribution of potential options.
- • 抽样:依据某种概率分布,从一组可能选项中选出一个或多个结果的过程。在本文中,抽样被定义为 LLM 按概率从一簇可能选项中选出输出的过程。
- • Heuristics: Heuristics generally refer to mental shortcuts or rule-based approximations. In the context of the manuscript, it refer to empirically derived rules the LLM employ to streamline sample generation processes by approximating deliberate outcomes without incurring the cost of exhaustive search through decision branches.
- • 启发式:启发式一般指心理捷径或基于规则的近似。在本文中,它指 LLM 用来简化样本生成过程的经验性规则:在不必穷尽搜索各决策分支的代价下,近似得到经过权衡的结果。
- • Prescriptive component: The prescriptive component of a concept reflects an implicit ideal or normative standard of the concept encoded within the cognitive agent or the model. In human cognition, it reflects the value of the concept and can manifest as moral, cultural, or goal-oriented biases in decision-making. In LLMs, the prescriptive component seems to emerge from patterns in training data and RLHF, influencing outputs to align with an implicit notion of "ideal" rather than just statistical norms. The notion of an "ideal" in the LLM need not align with human values.
- • 规定性成分:一个概念的规定性成分,反映编码在认知智能体或模型内部的、对该概念的隐含理想或规范性标准。在人类认知中,它反映该概念的价值,并可能在决策中表现为道德、文化或面向目标的偏倚。在 LLM 中,规定性成分似乎来自训练数据中的模式以及 RLHF,使输出与一种隐含的“理想”看法对齐,而不仅仅与统计常态对齐。LLM 中的“理想”不必与人类价值对齐。
- • Descriptive component: The descriptive component refers to observed patterns that define what is typical or statistically frequent in a given concept. In LLMs, it corresponds to the underlying statistical probability distribution learned from pretraining data for each concept, reflecting common word sequences and structures.
- • 描述性成分:描述性成分指那些定义一个给定概念中何为典型或在统计上频繁出现的观察模式。在 LLM 中,它对应于从预训练数据中为每个概念学到的底层统计概率分布,反映常见的词序列与结构。
- • Prototpye: A prototype is the most representative example of a concept. In humans, prototype is the cognitive “average” of a category—a mental representation that encapsulates the most typical features shared by its members. It serves as a benchmark against which new instances are compared to decide if they belong to that category. Prototypes has been shown to useful in ML for understanding how well a concept generalize across scenarios.
- • 原型:原型是一个概念最有代表性的例子。在人类中,原型是一个类别的认知“平均值”——一种把其成员所共享的最典型特征概括起来的心理表征。它被用作基准,用来把新实例与之比较,以判断它们是否属于该类别。在机器学习中,原型也被表明有助于理解一个概念在不同情景中的泛化程度。
- • System-1: System-1 refers to a mode of decision-making characterized by fast, automatic, and intuitive processing that relies on heuristics rather than explicit reasoning. This enables rapid decision-making often at the cost of accuracy and depth. In human cognition, System-1 is responsible for routine tasks, immediate responses, and heuristic-driven judgments, often without conscious deliberation. In LLMs, System-1-like behavior corresponds to the probabilistic selection of tokens based on learned statistical patterns, without explicit multi-step reasoning or deliberation. This results in fluent but potentially biased or heuristic-driven outputs, similar to human cognitive shortcuts.
- • System-1:System-1 指一种以快速、自动、直觉式加工为特征的决策方式,依赖启发式而非显式推理。这使快速决策成为可能,代价往往是准确性与深度。在人类认知中,System-1 负责日常任务、即时反应以及由启发式驱动的判断,常常无需有意识的权衡。在 LLM 中,类似 System-1 的行为对应于依据已学习的统计模式按概率选择词元,而不做显式的多步推理或权衡。这会带来流畅、但可能带有偏倚或由启发式驱动的输出,类似于人类的认知捷径。
- • System-2: System-2 is a slow, deliberate, and analytical mode of thinking that requires cognitive effort and logical reasoning. In human cognition, it is responsible for problem-solving and long-term planning. In LLMs, System-2-like behavior is induced through structured prompting techniques, such as chain-of-thought reasoning, where intermediate steps are explicitly modeled.
- • System-2:System-2 是一种缓慢、审慎、分析性的思考方式,需要认知努力和逻辑推理。在人类认知中,它负责问题解决和长期规划。在 LLM 中,类似 System-2 的行为通过结构化提示技术被诱发,例如思维链推理,其中间步骤被显式建模。
- • Value-system: A value system is a structured hierarchical framework of beliefs, morals/principles, and standards that guide how individuals or groups determine what is important, good, or desirable. It influences decisions, behavior, and priorities by providing a set of criteria against which actions and outcomes are judged. In LLMs, a value-system is not explicitly encoded but emerges through training data biases, reinforcement learning objectives, and alignment mechanisms that shape the model’s preferences for certain types of sampling outputs over others.
- • 价值系统:价值系统是一套结构化的、分层的信念、道德/原则与标准框架,用来引导个人或群体判断什么是重要的、好的或可取的。它通过提供一套用以评判行动与结果的准则,影响决策、行为和优先级。在 LLM 中,价值系统并非被显式编码,而是通过训练数据中的偏倚、强化学习目标以及对齐机制浮现出来,这些机制会塑造模型对某些类型抽样输出相对其他类型的偏好。
- • Normality: Normality of the concept in simple words is what is considered normal of that concept. It is defined by the set of observed behaviors or patterns of elements of a concept that align with established or typical standards of the concept. Normality in humans is found to be a cognitive representation that integrates descriptive norms (statistical regularities—what is common or average) and prescriptive norms (idealized expectations—what is good, desirable, or appropriate). We find that LLMs concept of normality and what is normal also incorporates both these dimensions indicating that prototypical representations are biased by value potentially raising ethical issues in downstream tasks.
- • 常态:一个概念的常态,简单地说,就是该概念被认为“正常”的情形。它由该概念中那些与既有或典型标准相符的元素所表现出的行为或模式来定义。人类中的常态被发现是一种整合了描述性规范(统计规律——何为常见或平均)和规定性规范(理想化期望——何为好的、可取的或恰当的)的认知表征。我们发现,LLM 对常态以及何为正常的概念也纳入了这两个维度,表明原型表征会受到价值的偏置,从而可能在下游任务中引出伦理问题。
- • Concept: For LLM a concept refers to an abstract representation formed through statistical associations in training data, capturing relationships between words, phrases, and ideas in high-dimensional latent space. Unlike human-defined categories, LLM concepts emerge from probabilistic patterns of usage rather than explicit rule-based definitions, allowing generalization across contexts.
- • 概念:对 LLM 而言,概念指通过训练数据中的统计关联形成的抽象表征,在高维潜在空间中捕捉词、短语与想法之间的关系。与人类定义的类别不同,LLM 的概念来自使用上的概率模式,而不是显式的基于规则的定义,因而能够跨情境泛化。
- • Exemplar : An exemplar is defined as a specific instance or example of a concept that people use to represent that concept in their minds. Unlike prototypes, which can be abstracted averages of category members, exemplars are concrete instances stored in memory. In the context of the paper, an exemplar serves as a specific, descriptive representation of an example of a concept that an LLM evaluates based on statistical norms (descriptive components) and idealized values (prescriptive components). In this work we find how LLMs, like humans, assess exemplars by considering not just their statistical frequency within a category but also the implicit values associated with them.
- • 例示:例示被定义为人们用来在头脑中表示某个概念的一个具体实例或例子。与可以作为类别成员之抽象平均值的原型不同,例示是存储在记忆中的具体实例。在本文语境中,例示是对某个概念之例子的具体、描述性表征,LLM 会依据统计规范(描述性成分)和理想化价值(规定性成分)对它进行评估。在本工作中,我们考察 LLM 如何像人类一样评估例示:不仅考虑它们在一个类别中的统计频率,也考虑与之相关的隐含价值。
Appendix B Compute Resources and Licenses
附录 B 计算资源与许可证
We use API to access the LLMs. We do not load the models locally. For GPT we use the Open-AI API. The API used for open source models shall be revealed once the double-blind is no longer valid. When utilizing large language models such as GPT (OpenAI), Claude (Anthropic), LLaMA (Meta), and Mistral in scientific research, we cite the respective models. Each model’s terms dictate its permissible uses, including conditions for research, publication, and potential downstream applications. To ensure compliance, we have reviewed and adhered to these licenses in the preparation of this work.
我们通过 API 访问这些 LLM,并不在本地加载模型。对 GPT,我们使用 OpenAI API。用于开源模型的 API 将在双盲评审不再有效后披露。在科学研究中使用 GPT(OpenAI)、Claude(Anthropic)、LLaMA(Meta)和 Mistral 等大语言模型时,我们引用了相应模型。每个模型的条款规定了其允许的用途,包括研究、发表以及潜在下游应用的条件。为确保合规,我们在准备本工作的过程中审阅并遵守了这些许可证。
LLaMA (Meta) is provided under a research license, allowing its application in academic work. Its deployment in this study aligns with these conditions, with clear citing of model. Similarly, Mistral models, released under permissive licenses, offer significant flexibility for research. Attribution requirements outlined in these licenses have been met, ensuring compliance with their terms. More details on services that host open sourced models will be revealed after the effect of double blind policy stops applying. In summary, this work complies with all licensing and usage policies of the cited models. Attribution is provided as required, and the use of these tools is disclosed to maintain transparency and reproducibility in line with the standards of the research community.
LLaMA(Meta)在研究许可证下提供,允许用于学术工作。本研究中的使用符合这些条件,并对模型做了清楚引用。类似地,Mistral 模型在较为宽松的许可证下发布,为研究提供了较大灵活性。这些许可证中列出的署名要求已经满足,从而符合其条款。关于托管开源模型之服务的更多细节,将在双盲政策停止适用后披露。总之,本工作遵守所引模型的全部许可与使用政策。按要求提供了署名,并对这些工具的使用予以披露,以保持符合研究社区标准的透明与可复现性。
Appendix C Understanding biases of LLMs
附录 C 理解 LLM 的偏倚
Previous work on LLM predominantly evaluates biases with respect to social concepts like gender, race and popularity. There has also been investigation of biases in aspects like language style and lexical content Wan et al. (2023). Gallegos et al. gives a comprehensive survey of these works and presents a taxonomy of biases Gallegos et al. (2024). This taxonomy aligns with how humans attribute meanings to these biases and their impact on society. The biases of LLM have also been studied in the context of specific fields and applications like health care Omiye et al. (2023); Zack et al. (2024); Thirunavukarasu et al. (2023); Hastings (2024). These studies do not go beyond the human taxonomy of biases to explore fundamental biases that, in turn, manifest in real-world applications.
以往关于 LLM 的工作,主要相对性别、种族和受欢迎程度等社会概念来评估偏倚。也有研究考察语言风格和词汇内容等方面的偏倚(Wan et al. 2023)。Gallegos 等人给出了这些工作的全面综述,并提出一套偏倚分类法(Gallegos et al. 2024)。这一分类法与人类如何赋予这些偏倚以意义、以及它们对社会的影响相一致。LLM 的偏倚也在医疗等具体领域和应用中得到研究(Omiye et al. 2023;Zack et al. 2024;Thirunavukarasu et al. 2023;Hastings 2024)。这些研究并未超越人类的偏倚分类法,去探索那些会进而在现实应用中表现出来的更根本的偏倚。
Biases in System-1 outputs significantly influence System-2 processes because the latter often depend on the former as a prior in decision-making. For instance, in AlphaGo (Silver et al., 2016), the Monte Carlo Tree Search (MCTS) algorithm (a System-2 process) relies on estimates from a neural network (System-1) to limit the search space. Similarly, in frameworks like Tree of Thoughts (ToT) (Yao et al., 2023), LLMs generate initial samples that a symbolic solver refines, assuming that the LLM provides a useful prior for the problem solver. Understanding and explaining system-1 biases are pivotal to making system-2 based real world systems.
System-1 输出中的偏倚会显著影响 System-2 过程,因为后者在决策中常常把前者当作先验。例如,在 AlphaGo(Silver et al., 2016)中,蒙特卡洛树搜索(MCTS)算法(一种 System-2 过程)依赖神经网络(System-1)的估计来限制搜索空间。类似地,在思维树(ToT)(Yao et al., 2023)一类框架中,LLM 生成初始样本,再由符号求解器加以精炼,其假定是 LLM 为问题求解器提供了有用的先验。理解并解释 System-1 的偏倚,对打造基于 System-2 的现实系统至关重要。
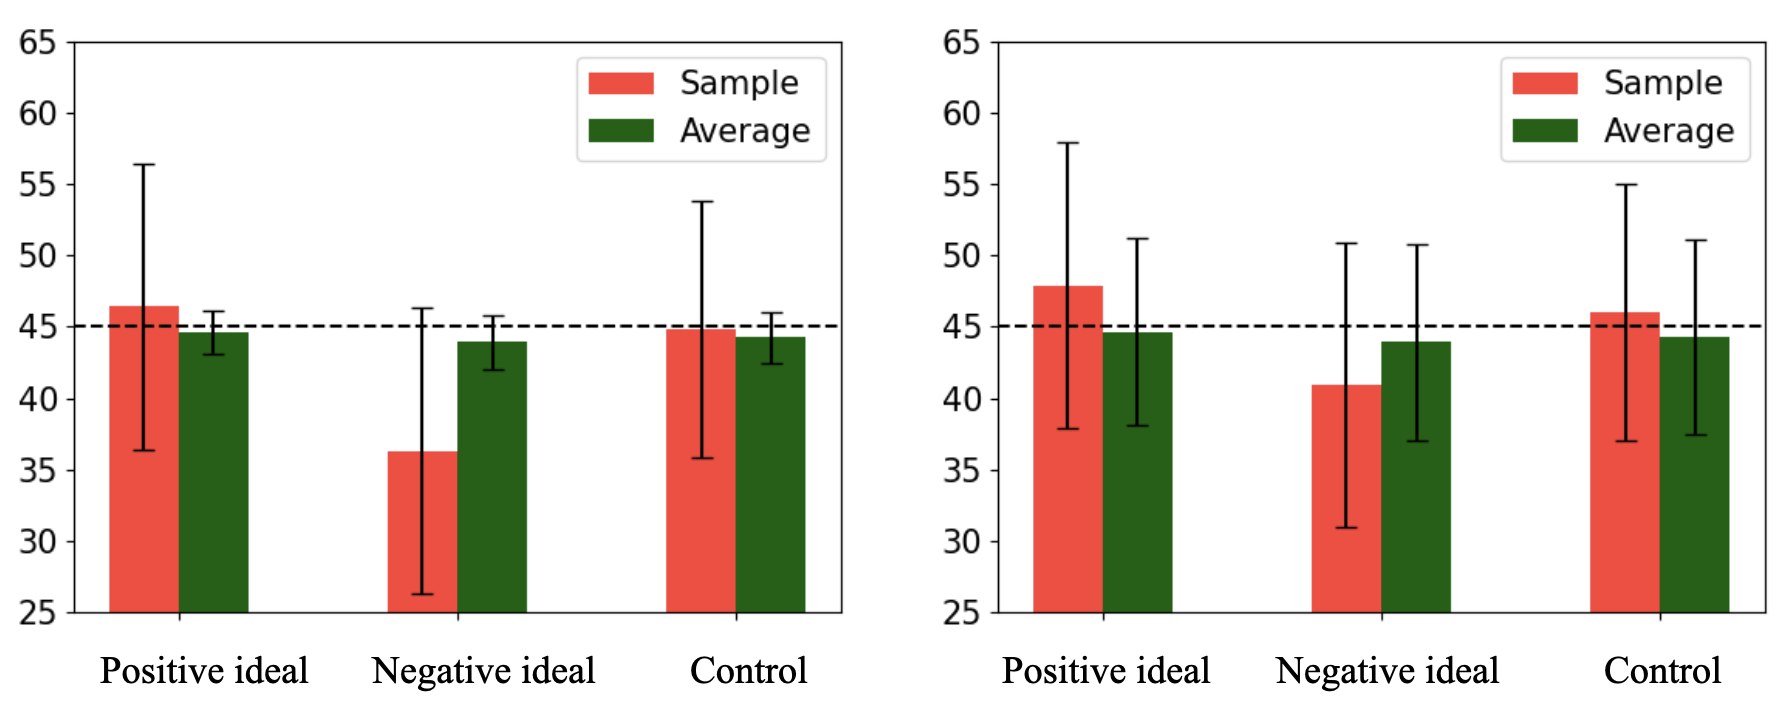
Figure 4: Estimates of the average amount of glubbing (green) and mean of samples (red) for the unimodal (left) and bimodal (right) conditions from the experiment 4.1. The true average (mean of input distribution) is presented is also shown in dashed black lines.
图 4:实验 4.1 中,单峰(左)与双峰(右)条件下对平均 glubbing 量的估计(绿色)以及样本均值(红色)。真实平均值(输入分布的均值)也用黑色虚线标出。
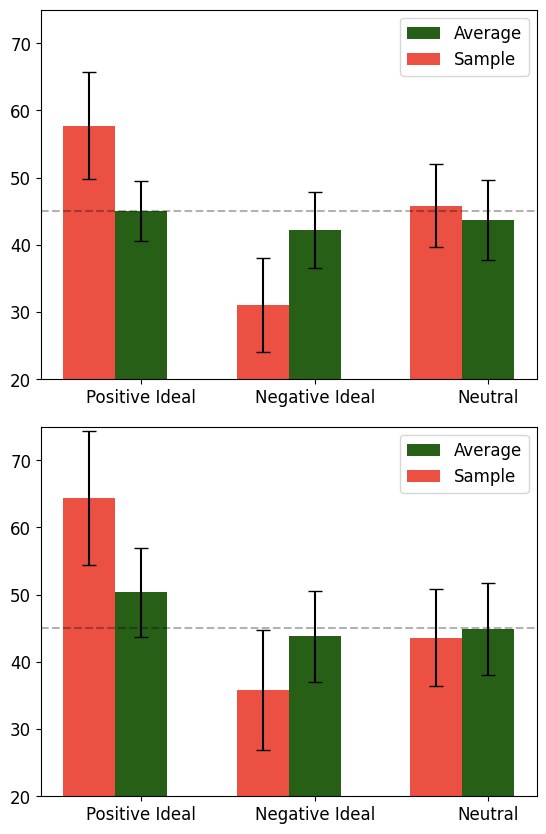
Figure 5: Estimates of the average amount of flubbing (green) and the mean of samples (red) for the unimodal (left) and bimodal (right) conditions from the human experiment (Bear et al., 2020). The true average (mean of the input distribution) is shown with dashed black lines.
图 5:人类实验(Bear et al., 2020)中,单峰(左)与双峰(右)条件下对平均 flubbing 量的估计(绿色)以及样本均值(红色)。真实平均值(输入分布的均值)用黑色虚线标出。
Appendix D Sampling on novel concept: human experiment
附录 D 在新概念上的抽样:人类实验
A total of 1,200 participants were assigned across six conditions in a pre-registered design. The experiment manipulated the statistical distribution of new concept flubbing amounts (unimodal vs. bimodal) and prescriptive value (high, low, or neutral ideal). Specifically, the flubbing amounts were drawn from:
共有 1,200 名参与者被分配到 预注册设计中的六种条件。实验操纵了新概念 flubbing 数量的统计分布(单峰与双峰)以及规定性价值(高、低或中性理想)。具体而言,flubbing 数量抽自:
- • Unimodal distribution: ,
- • 单峰分布: ,
- • Bimodal distribution: , ,
- • 双峰分布: ,,
For the prescriptive value conditions:
对规定性价值条件:
- • High ideal: Flubbing amounts greater than 80 minutes were ideal (A+), while amounts less than 20 minutes received the lowest grade (D-).
- • 高理想: 超过 80 分钟的 flubbing 量为理想(A+),少于 20 分钟的则得到最低等级(D-)。
- • Low ideal: Amounts less than 20 minutes were ideal (A+), and those above 80 were discouraged (D-).
- • 低理想: 少于 20 分钟的量为理想(A+),超过 80 分钟的则被劝阻(D-)。
- • Intermediate ideal: The ideal amount of flubbing was set to 50 minutes, and grades were linearly scaled based on deviation from 50.
- • 中间理想: 理想的 flubbing 量被设为 50 分钟,等级按与 50 的偏离线性缩放。
After viewing 100 amounts of flubbing paired with health grades, participants were asked to report the first number of minutes of flubbing that came to mind. The results showed:
在看过 100 个配有健康等级的 flubbing 数量后,参与者被要求报告脑海中首先出现的 flubbing 分钟数。结果显示:
- • Participants’ sample judgments significantly differed from their estimates of the average flubbing amount. For the low ideal condition, the paired t-test yielded . For the high ideal condition, the paired t-test was .
- • 参与者的样本判断与他们对平均 flubbing 量的估计显著不同。对低理想条件,配对 t 检验给出 。对高理想条件,配对 t 检验为 。
- • In the intermediate ideal condition, sample judgments and estimates of average flubbing did not significantly diverge, .
- • 在中间理想条件下,样本判断与对平均 flubbing 的估计没有显著分开,。
In analyzing the computational models, the softmax model provided the best fit across conditions when compared to other models, such as the additive and multiplicative models. The softmax model predicted participants’ sample judgments as a combination of statistical probability (distribution average) and prescriptive value . The product of these factors explained the distribution of flubbing amounts that came to mind.
在分析计算模型时,与加性模型和乘性模型等其他模型相比,softmax 模型在各条件下拟合最好。softmax 模型把参与者的样本判断预测为统计概率 (分布平均值)与规定性价值 的组合。这些因子的乘积解释了脑海中出现的 flubbing 数量分布。
The mean sample judgments is significantly influenced by the prescriptive values , with deviations from the true average . The differences between sample judgments and participants’ estimates of average flubbing were highly significant in both the low ideal condition () and the high ideal condition (). No significant difference was found in the intermediate ideal condition (). These results suggest that participants were strongly influenced by prescriptive values in their judgments. The results are shown in Figure 5.
样本判断的均值显著受到规定性价值 的影响,并相对真实平均值 发生偏离。样本判断与参与者对平均 flubbing 之估计之间的差异,在低理想条件()和高理想条件()下都高度显著。中间理想条件下未发现显著差异()。这些结果表明,参与者的判断受到规定性价值的强烈影响。结果见图 5。
This experiment was replicated in this paper and we return similar results where the LLM also shows strong influence of prescriptive values as shown in Figure 4. The similarity of the two figures strongly validate the proposed theory-the sampling heuristics of LLM and humans allign.
本实验在本文中得到复现,我们得到了相似结果:如图 4 所示,LLM 同样表现出规定性价值的强烈影响。两幅图的相似性有力地验证了所提出的理论——LLM 与人类的抽样启发式是对齐的。
Appendix E Sampling in relation to existing concepts in humans
附录 E 人类在既有概念上的抽样
In this section, we present the experiment 4.2 on the same concepts and using the same prompt as in prior work in humans by Bear et al. (2020). The results for LLM are shown in Table 5 and the results for humans in the same concepts are shown in Table 4. Comparing this result with the human studies, as shown in Appendix E, we observe that the LLM often gives a ‘strictly ideal’ value when queried for . That is, when a similar question is asked to human test subjects, the number of concepts for which the ideal value is zero is only one. On the other hand, the LLM gives zero for for 19 concepts (nearly half the time). For instance, the human gives the ideal percentage of ‘high school students underage drinking’ as 13.71%, while the LLM gives as zero for this concept, showing LLMs, for a lot of concepts, have a notion of stricter ideality compared to the more noisy ideal ratings we seem to observe across humans.
本节在与 Bear et al.(2020)先前人类工作相同的概念上、使用相同提示,给出实验 4.2。LLM 的结果见表 5,人类在相同概念上的结果见表 4。把这一结果与人类研究相比较(如附录 E 所示),我们观察到,当被询问 时,LLM 常常给出“严格理想”的值。也就是说,当向人类被试提出类似问题时,理想值为零的概念只有一个。另一方面,LLM 对 19 个概念给出 为零(接近一半的时候)。例如,人类把“高中学生未成年饮酒”的理想百分比给成 13.71%,而 LLM 对该概念给出的 为零,表明对许多概念,LLM 持有比我们在人类中看到的、更为嘈杂的理想评分更严格的理想观念。
We also repeat this experiment for temperature zero as shown in Table in Section L, and observe similar results. We get the following results with other LLMs with default temperatures: Llama-3-7b (binomial = 0.003), Mixtral-8x7B (binomial = 0.05), GPT3.5-turbo (binomial < 0.001), Claude (binomial < 0.001), Mistral (binomial = 0.0019).
我们还在温度为零时重复该实验,如表(第 L 节)所示,并观察到相似结果。在默认温度下,其他 LLM 得到如下结果:Llama-3-7b(二项检验 = 0.003)、Mixtral-8x7B(二项检验 = 0.05)、GPT3.5-turbo(二项检验 < 0.001)、Claude(二项检验 < 0.001)、Mistral(二项检验 = 0.0019)。
We present a scatter plot of values for LLMs and humans in Figure 6. We see that although the LLM has a strong prescriptive component based on its implicit value associated with each concept, its amplitude of shift towards prescriptive norm does not correlate with that of humans (Pearson correlation of -0.02). This makes the study of prescriptive norms in LLMs more significant as they might not manifest in samples like it does in humans. Comparing of humans and the LLM for experiment 5 shows a higher alignment in the shift (Figure 6). Here the Pearson correlation of and is 0.33.
我们在图 6 中给出 LLM 与人类 值的散点图。可以看到,尽管 LLM 依据其与每个概念相关的隐含价值而具有很强的规定性成分,它朝规定性规范偏移的幅度却与人类不相关(Pearson 相关为 -0.02)。这使得对 LLM 中规定性规范的研究更加重要,因为它们未必会像在人类中那样表现在样本里。 比较人类与 LLM 在实验 5 上的 ,则显示出更高的偏移对齐(图 6)。这里 与 的 Pearson 相关为 0.33。
| Domain | Average | Ideal | Sample | Domain | Average | Ideal | Sample |
|---|---|---|---|---|---|---|---|
| Hours TV/day | 3.38 | 1.63 | 2.87 | Drinks frat bro consume/wknd | 11.12 | 6.63 | 15.64 |
| Sugary drinks/wk | 9.17 | 2.41 | 5.91 | Times honk at drivers/wk | 2.67 | 0.72 | 2.53 |
| Hours Exercise/wk | 4.00 | 5.58 | 6.33 | Mins on social media/day | 60.57 | 35.40 | 59.10 |
| Cals consumed/day | 2225.91 | 1900.00 | 1859.24 | Times parent punishes child/month | 6.58 | 2.28 | 3.25 |
| Servings Fruits & veggies/month | 40.00 | 94.96 | 39.16 | Miles walked/wk | 9.79 | 12.96 | 9.96 |
| Lies told/wk | 9.57 | 1.17 | 8.44 | % people drive drunk | 11.30 | 1.23 | 9.45 |
| Mins late for appointment | 14.22 | 3.04 | 13.6 | Times cheat on partner in life | 1.52 | 0.00 | 1.73 |
| Books read/yr | 7.22 | 17.40 | 8.45 | Times snooze alarm/day | 2.13 | 0.76 | 1.98 |
| Romantic partners in life | 6.09 | 5.77 | 8.06 | Parking tickets/yr | 1.67 | 0.04 | 1.37 |
| Country’s international conflicts/decade | 11.67 | 1.36 | 4.15 | Times car wash/yr | 10.77 | 12.85 | 11.31 |
| Dollars cheated on taxes | 437.45 | 82.0 | 350.32 | Cups coffee/day | 2.21 | 1.84 | 2.72 |
| % students cheat on HS exam | 33.00 | 2.17 | 19.50 | Desserts/wk | 3.85 | 2.92 | 4.04 |
| Times checking phone/day | 28.57 | 7.68 | 16.57 | Loads of laundry/wk | 3.42 | 2.70 | 3.75 |
| Mins waiting on phone for customer service | 20.21 | 3.88 | 13.29 | % HS students underage drink | 35.81 | 13.71 | 32.96 |
| Times called parents/month | 5.00 | 5.50 | 7.04 | % students lying website | 50.56 | 13.40 | 47.20 |
| Times clean home/month | 5.78 | 4.35 | 6.24 | Servings carbs/day | 62.43 | 16.13 | 33.23 |
| Times computer crashes/wk | 3.07 | 0.12 | 1.14 | Txt msgs sent/day | 27.18 | 12.88 | 18.10 |
| % HS dropouts | 10.67 | 1.29 | 11.49 | Times lose temper/wk | 2.60 | 0.56 | 2.20 |
| % middle schoolers bullied | 17.59 | 0.81 | 19.46 | Times swearing/day | 8.69 | 5.88 | 11.26 |
| Hrs sleep/night | 6.69 | 7.84 | 7.32 |
Table 4: Comparison of Average, Ideal, and Sample Data in various Domains (Bear et al., 2020). The table shows human response sampling having a prescriptive norm component across concepts.
| 领域 | 平均 | 理想 | 样本 | 领域 | 平均 | 理想 | 样本 |
|---|---|---|---|---|---|---|---|
| Hours TV/day | 3.38 | 1.63 | 2.87 | Drinks frat bro consume/wknd | 11.12 | 6.63 | 15.64 |
| Sugary drinks/wk | 9.17 | 2.41 | 5.91 | Times honk at drivers/wk | 2.67 | 0.72 | 2.53 |
| Hours Exercise/wk | 4.00 | 5.58 | 6.33 | Mins on social media/day | 60.57 | 35.40 | 59.10 |
| Cals consumed/day | 2225.91 | 1900.00 | 1859.24 | Times parent punishes child/month | 6.58 | 2.28 | 3.25 |
| Servings Fruits & veggies/month | 40.00 | 94.96 | 39.16 | Miles walked/wk | 9.79 | 12.96 | 9.96 |
| Lies told/wk | 9.57 | 1.17 | 8.44 | % people drive drunk | 11.30 | 1.23 | 9.45 |
| Mins late for appointment | 14.22 | 3.04 | 13.6 | Times cheat on partner in life | 1.52 | 0.00 | 1.73 |
| Books read/yr | 7.22 | 17.40 | 8.45 | Times snooze alarm/day | 2.13 | 0.76 | 1.98 |
| Romantic partners in life | 6.09 | 5.77 | 8.06 | Parking tickets/yr | 1.67 | 0.04 | 1.37 |
| Country’s international conflicts/decade | 11.67 | 1.36 | 4.15 | Times car wash/yr | 10.77 | 12.85 | 11.31 |
| Dollars cheated on taxes | 437.45 | 82.0 | 350.32 | Cups coffee/day | 2.21 | 1.84 | 2.72 |
| % students cheat on HS exam | 33.00 | 2.17 | 19.50 | Desserts/wk | 3.85 | 2.92 | 4.04 |
| Times checking phone/day | 28.57 | 7.68 | 16.57 | Loads of laundry/wk | 3.42 | 2.70 | 3.75 |
| Mins waiting on phone for customer service | 20.21 | 3.88 | 13.29 | % HS students underage drink | 35.81 | 13.71 | 32.96 |
| Times called parents/month | 5.00 | 5.50 | 7.04 | % students lying website | 50.56 | 13.40 | 47.20 |
| Times clean home/month | 5.78 | 4.35 | 6.24 | Servings carbs/day | 62.43 | 16.13 | 33.23 |
| Times computer crashes/wk | 3.07 | 0.12 | 1.14 | Txt msgs sent/day | 27.18 | 12.88 | 18.10 |
| % HS dropouts | 10.67 | 1.29 | 11.49 | Times lose temper/wk | 2.60 | 0.56 | 2.20 |
| % middle schoolers bullied | 17.59 | 0.81 | 19.46 | Times swearing/day | 8.69 | 5.88 | 11.26 |
| Hrs sleep/night | 6.69 | 7.84 | 7.32 |
表 4:各领域中平均值、理想值与样本数据的比较(Bear et al., 2020)。该表显示,人类的响应抽样在各概念上都具有规定性规范成分。
| concept | Average | Ideal | Sample | concept | Average | Ideal | Sample |
|---|---|---|---|---|---|---|---|
| Hours of TV in a day | 3.36 | 1.85 | 3.25 | Drinks in a frat weekend | 12.87 | 7.87 | 2.65 |
| Sugary drinks in a week | 6.53 | 0.00 | 5.70 | % people in a city driving drunk | 1.38 | 0.00 | 2.60 |
| Hours exercising in a week | 7.45 | 8.40 | 4.55 | Times to cheat on a partner in life | 1.28 | 0.00 | 15.29 |
| Lies in a week | 8.46 | 0.00 | 3.50 | Times to hit snooze on an alarm/day | 1.60 | 0.10 | 3.25 |
| Calories in a day | 2400.00 | 2000.00 | 3.70 | Parking tickets in a year | 2.05 | 0.00 | 5.50 |
| Servings of fruits and vegetables in a month | 69.93 | 108.00 | 18.00 | Times to get car washed in a year | 12.02 | 12.00 | 3.34 |
| Number of minutes late for an appointment | 14.36 | 0.00 | 3.10 | Cups of coffee to drink in a day | 1.85 | 2.80 | 2.52 |
| Romantic partners in a lifetime | 7.20 | 3.87 | 3.55 | Loads of laundry to do in a week | 2.06 | 3.15 | 4.10 |
| International conflicts in a decade | 1.07 | 0.00 | 3.55 | % of adults in a city smoking | 20.38 | 0.00 | 4.50 |
| Dollars to cheat on taxes | 508.00 | 0.00 | 2.88 | % of students drinking underage | 32.55 | 0.00 | 5.15 |
| % of students cheating on an exam | 67.30 | 0.00 | 3.35 | % of people lying on a dating site | 55.06 | 0.00 | 3.27 |
| Times to check a phone in a day | 79.35 | 22.24 | 3.60 | Servings of carbohydrates in a day | 4.57 | 139.50 | 3.45 |
| Min waiting on phone for customer service | 11.30 | 3.10 | 3.35 | Text messages to send in a day | 94.00 | 34.50 | 10.90 |
| Times for a computer to crash in a week | 0.55 | 0.00 | 3.80 | Times to lose temper in a week | 3.50 | 0.00 | 5.95 |
| % of students dropping out of school | 8.31 | 0.00 | 2.80 | Times to swear in a day | 80.00 | 0.00 | 2.97 |
| % of students being bullied in middle school | 27.57 | 0.00 | 3.35 | Times honk at drivers in a week | 3.73 | 0.00 | 2.45 |
| Hours of sleep in a night | 7.40 | 7.70 | 3.20 | Mins on social media in a day | 144.10 | 30.00 | 3.05 |
| Times parent punishes child in a month | 4.99 | 0.00 | 3.30 | Miles walked in a week | 21.00 | 20.65 | 44.50 |
Table 5: Comparison of average, ideal, and sample data in various concepts, the concepts exhibiting prescriptive norm is in bold which makes up a significant number.
| 概念 | 平均 | 理想 | 样本 | 概念 | 平均 | 理想 | 样本 |
|---|---|---|---|---|---|---|---|
| Hours of TV in a day | 3.36 | 1.85 | 3.25 | Drinks in a frat weekend | 12.87 | 7.87 | 2.65 |
| Sugary drinks in a week | 6.53 | 0.00 | 5.70 | % people in a city driving drunk | 1.38 | 0.00 | 2.60 |
| Hours exercising in a week | 7.45 | 8.40 | 4.55 | Times to cheat on a partner in life | 1.28 | 0.00 | 15.29 |
| Lies in a week | 8.46 | 0.00 | 3.50 | Times to hit snooze on an alarm/day | 1.60 | 0.10 | 3.25 |
| Calories in a day | 2400.00 | 2000.00 | 3.70 | Parking tickets in a year | 2.05 | 0.00 | 5.50 |
| Servings of fruits and vegetables in a month | 69.93 | 108.00 | 18.00 | Times to get car washed in a year | 12.02 | 12.00 | 3.34 |
| Number of minutes late for an appointment | 14.36 | 0.00 | 3.10 | Cups of coffee to drink in a day | 1.85 | 2.80 | 2.52 |
| Romantic partners in a lifetime | 7.20 | 3.87 | 3.55 | Loads of laundry to do in a week | 2.06 | 3.15 | 4.10 |
| International conflicts in a decade | 1.07 | 0.00 | 3.55 | % of adults in a city smoking | 20.38 | 0.00 | 4.50 |
| Dollars to cheat on taxes | 508.00 | 0.00 | 2.88 | % of students drinking underage | 32.55 | 0.00 | 5.15 |
| % of students cheating on an exam | 67.30 | 0.00 | 3.35 | % of people lying on a dating site | 55.06 | 0.00 | 3.27 |
| Times to check a phone in a day | 79.35 | 22.24 | 3.60 | Servings of carbohydrates in a day | 4.57 | 139.50 | 3.45 |
| Min waiting on phone for customer service | 11.30 | 3.10 | 3.35 | Text messages to send in a day | 94.00 | 34.50 | 10.90 |
| Times for a computer to crash in a week | 0.55 | 0.00 | 3.80 | Times to lose temper in a week | 3.50 | 0.00 | 5.95 |
| % of students dropping out of school | 8.31 | 0.00 | 2.80 | Times to swear in a day | 80.00 | 0.00 | 2.97 |
| % of students being bullied in middle school | 27.57 | 0.00 | 3.35 | Times honk at drivers in a week | 3.73 | 0.00 | 2.45 |
| Hours of sleep in a night | 7.40 | 7.70 | 3.20 | Mins on social media in a day | 144.10 | 30.00 | 3.05 |
| Times parent punishes child in a month | 4.99 | 0.00 | 3.30 | Miles walked in a week | 21.00 | 20.65 | 44.50 |
表 5:各概念上平均值、理想值与样本数据的比较,表现出规定性规范的概念以粗体标出,占相当大的数量。
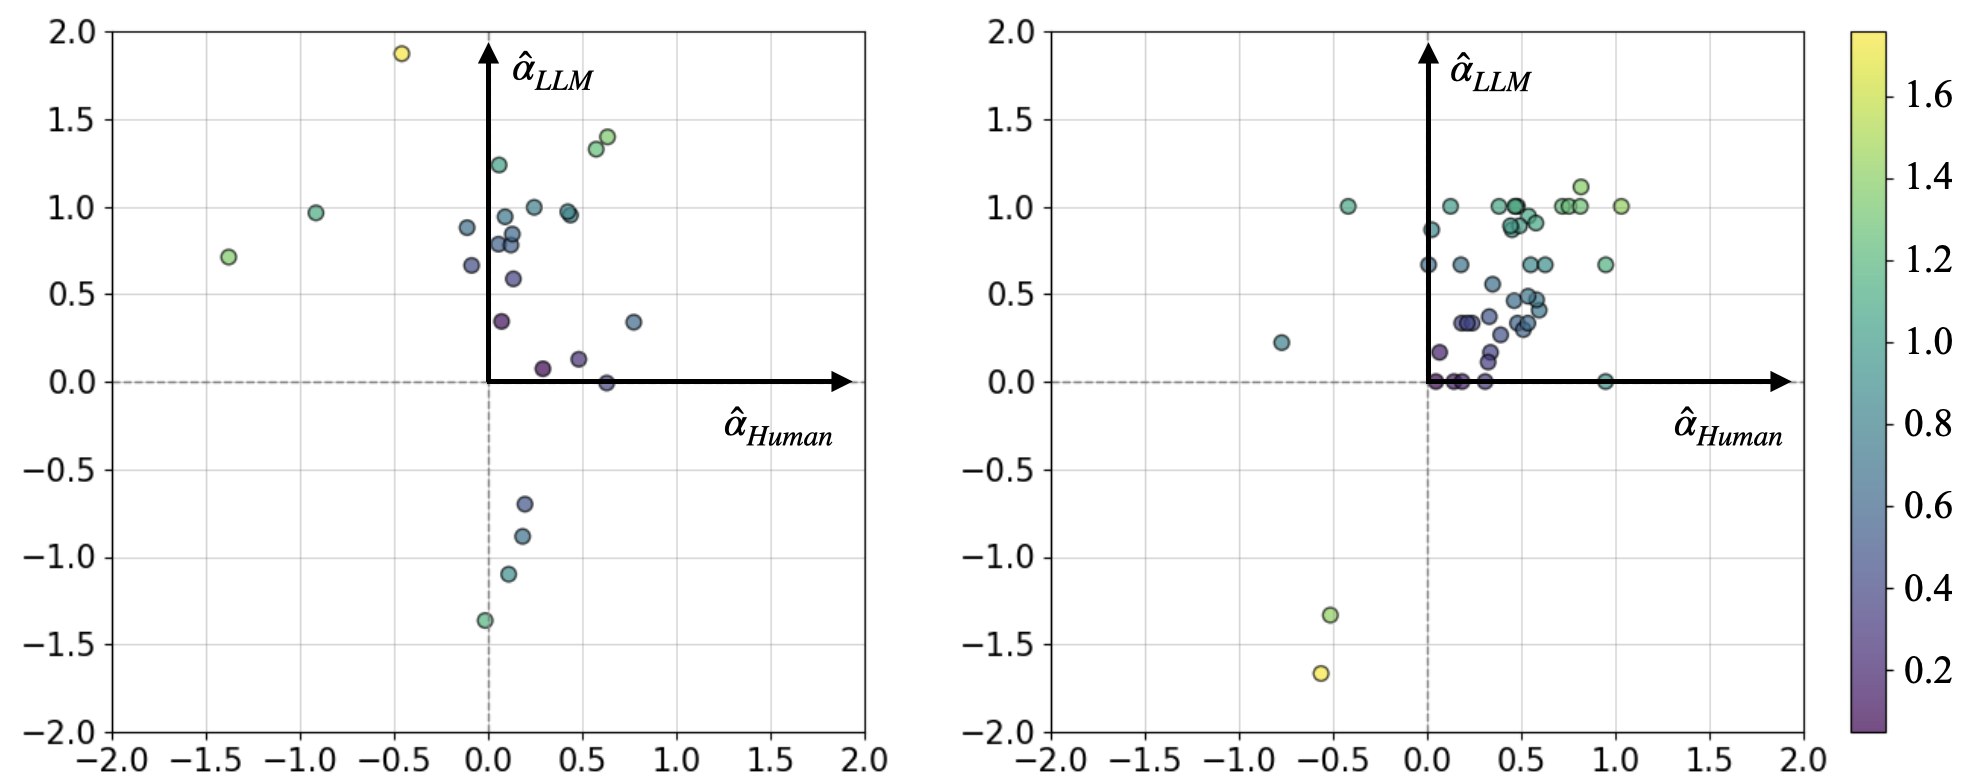
Figure 6: Comparing human and LLM on the prototype experiment and sampling on existing concepts. Figure on the left compares from results in Experiment 2 showing some misalignment between LLM and human results due to differences arising in the prescriptive component. Figure on the right compares LLM and human results from Experiment 3 showing more correlation in prototypical concept ratings.
图 6:在原型实验以及既有概念上的抽样中比较人类与 LLM。左图比较实验 2 的结果,显示由于规定性成分上的差异,LLM 与人类结果存在一定不对齐。右图比较实验 3 中 LLM 与人类的结果,显示在原型性概念评分上有更高的相关。
Appendix F Motivation for evaluating prototypes
附录 F 评估原型的动机
Barselou et al (Barsalou, 1985) state that ideals may determine a concept’s graded structure in one context, while central tendency may determine a different graded structure in another. In other words, when sampling, humans wouldn’t use both prescriptive and descriptive prototypical ratings in the same context. But, Bear et al (Bear and Knobe, 2017) show that human concepts have both components in the same context in a unified representation, providing an insight into how humans think about concepts, and our notion of normality is in fact both prescriptive and descriptive. When we try to rate a normal teacher, we include both prescriptive and descriptive components in the same context.
Barsalou 等人(Barsalou, 1985)指出,理想可能在一种情境中决定一个概念的等级结构,而中心趋势可能在另一种情境中决定另一种不同的等级结构。换句话说,在抽样时,人类不会在同一情境中同时使用规定性与描述性的原型评分。但是,Bear 等人(Bear and Knobe, 2017)表明,人类概念在同一情境、同一套统一表征中同时具有这两种成分,从而揭示了人类如何思考概念,以及我们对常态的看法事实上既是规定性的也是描述性的。当我们试图给一位“正常的教师”打分时,会在同一情境中同时纳入规定性与描述性成分。
Given the two different theories, we test this in LLMs. Previous experiments in this paper show that LLMs, when sampling from innumerable options, use both prescriptive and descriptive norms as a heuristic in the same context akin to a unified representation. We show similar results of how prototypicality rating also has the same unified representation of both prescriptive and descriptive norms in the same context. We consider this experiment as an initial foray into how representations of prototypes drive cognitive biases. More work needs to be done to understand where these representative prototypes which have prescriptive norms exhibit unfavorably biased decision making.
面对这两种不同理论,我们在 LLM 中加以检验。本文前面的实验表明,当 LLM 从难以穷尽的选项中抽样时,会在同一情境中同时把规定性与描述性规范当作启发式来使用,类似于一种统一表征。我们还给出相似结果:原型性评分在同一情境中同样具有规定性与描述性规范的统一表征。我们把本实验看作对原型表征如何驱动认知偏倚的初步探索。还需要更多工作,才能理解那些带有规定性规范的代表性原型会在何时表现出不利的偏倚决策。
Consider category 4 Exemplar 6 of Grandmother “A 55-year-old woman who likes to party a lot and go out with her friends to casinos and rock concerts. Enjoys playing sports with her grandchildren" (Appendix Q). This example of a grandmother has a lower ideal rating of 5.50 compared to other examples of the category. This is also reflected in the relative lower value of composite example rating (4.5), illustrating that non traditional prototypes are seen less ideally. Similar examples can been be seen in the table in Appendix P.
考虑类别 4、祖母的例示 6:“一位 55 岁的女性,喜欢经常聚会,和朋友去赌场和摇滚音乐会。喜欢和孙辈一起做运动”(附录 Q)。这一祖母例子的理想评分为 5.50,低于该类别中的其他例子。这也反映在相对较低的综合例子评分(4.5)上,说明非传统的原型会被看成不那么理想。类似例子也可见于附录 P 中的表。
This implicit bias and punishing of non traditional prototypes has severe implications on tasks where LLM is asked to pick candidates whether it be for academic admissions or hiring processes. Another aspect this bias plays out is between the Exemplar 1 and Exemplar 2 of the Grandmother category. Even though Exemplar 2 has lesser average rating compared to Exemplar 1, having a more ideal rating makes it a better example of a grandmother compared to Exemplar 2 illustrating LLMs notion of concepts has a prescriptive norm component.
这种对非传统原型的隐含偏倚与惩罚,对 LLM 被要求挑选候选人的任务——无论是学业录取还是招聘流程——都有严重含义。这一偏倚的另一方面,表现在祖母类别的例示 1 与例示 2 之间。尽管例示 2 的平均评分低于例示 1,但更高的理想评分使它成为比另一个更好的祖母例子,说明 LLM 对概念的看法具有规定性规范成分。
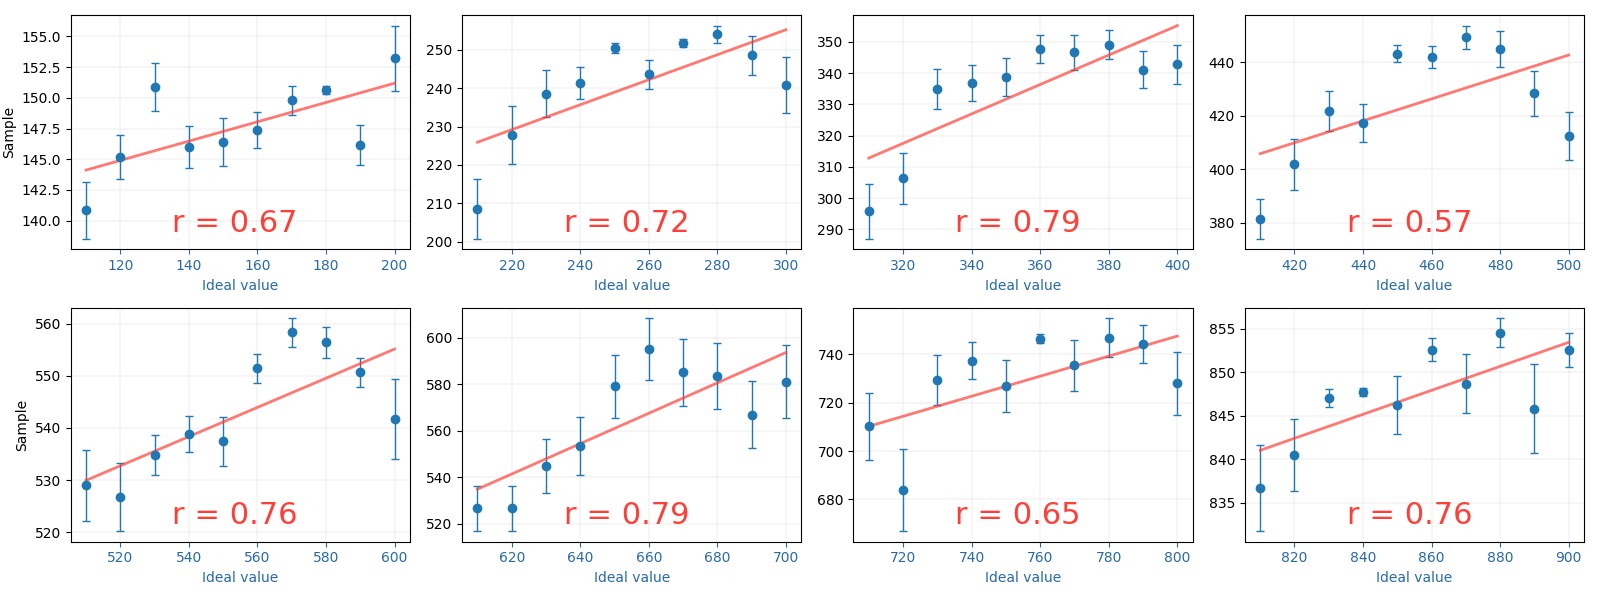
Figure 7: The figure shows the influence of the two components, showing strong evidence for the proposed theory. For each of the , changing clearly gives a shift in . This show prescriptive norm has a stong influence on sampling across statistics. The vice versa is also true, given the clearly changes with change of . The slope value across plots shows that effect of prescriptive norm is remarkably consistent.
图 7:该图显示两种成分的影响,为所提出的理论提供了有力证据。对每一个 ,改变 都会使 发生明显偏移。这表明规定性规范在不同统计量上都对抽样有很强影响。反之亦然:给定 会随 的改变而明显变化。各图中的斜率表明,规定性规范的效应相当稳定。
Appendix G Variation with different means
附录 G 随不同均值的变化
In this section, we investigate how the sampling behavior of Large Language Models (LLMs) varies with changes in the mean of the input distribution. Specifically, we examine whether the mean of the sample distribution generated by the LLM shifts in accordance with the mean of the input distribution, which represents the statistical norm of the concept being evaluated. Such a shift is also intuitive.
本节考察大语言模型(LLM)的抽样行为如何随输入分布均值的变化而变化。具体而言,我们考察 LLM 生成的样本分布均值,是否会依照作为所评估概念之统计常态的输入分布均值而移动。这种移动也是直观的。
The proposed theory states that the mean of the sample distribution generated by the LLM should vary in accordance with the mean of the input distribution. This would indicate that the LLM’s sampling process is influenced by the statistical norm of the concept, as represented by the input distribution.
所提出的理论指出,LLM 生成的样本分布均值应当依照输入分布的均值而变化。这将表明,LLM 的抽样过程受到该概念统计常态(由输入分布表示)的影响。
| Range | Pos Ideal | Neg Ideal | |
|---|---|---|---|
| 1-100 | 45 | 46 | 31 |
| 100-200 | 145 | 152 | 143 |
| 200-300 | 245 | 261 | 241 |
| 300-400 | 345 | 361 | 344 |
| 400-500 | 445 | 489 | 442 |
| 500-600 | 545 | 549 | 514 |
Table 6: The table shows the change in the sample in different values of . This implies the input op[tion belongs to different ranges with different distribution means. The sample of the LLM deviates with the change in . Furthermore, in each of the scenarios, the creates a shift in the sample value.
| 范围 | 正向理想 | 负向理想 | |
|---|---|---|---|
| 1-100 | 45 | 46 | 31 |
| 100-200 | 145 | 152 | 143 |
| 200-300 | 245 | 261 | 241 |
| 300-400 | 345 | 361 | 344 |
| 400-500 | 445 | 489 | 442 |
| 500-600 | 545 | 549 | 514 |
表 6:该表显示样本在不同 取值下如何变化。这意味着输入选项属于具有不同分布均值的不同范围。LLM 的样本会随 的变化而偏离。此外,在每一种情景中, 都会使样本值发生偏移。
To test this hypothesis, we use the setup as in experiment 4.1 where we systematically vary the mean of the input distribution while keeping other parameters constant. We used the same fictional concept, ‘glubbing’, as in experiment 4.1, and we defined the input distribution for ‘glubbing’ with different means.
为检验这一假设,我们使用与实验 4.1 相同的设定,系统改变输入分布的均值,并保持其他参数不变。我们使用与实验 4.1 相同的虚构概念 “glubbing”,并为 “glubbing” 定义具有不同均值的输入分布。
We conduct the experiment for both positive and negative ideal conditions, where the ideal value was either higher or lower than the mean of the input distribution. For each condition, we run the experiment 100 times and recorded the mean of the samples generated by the LLM for the concept as and the mean of the input distribution .
我们在正向与负向理想条件下开展实验,理想值分别高于或低于输入分布的均值。对每种条件,我们运行实验 100 次,并记录 LLM 为概念 生成的样本均值,记为 ,以及输入分布均值 。
The results of the experiment are summarized in Table 6. The table shows the change in the sample mean () as the mean of the input distribution () varies across different ranges. The results indicate that the mean of the sample distribution generated by the LLM does indeed vary in accordance with the mean of the input distribution. For example, when the mean of the input distribution () is 45, the mean of the sample distribution () is 46 for the positive ideal condition and 31 for the negative ideal condition. As the mean of the input distribution increases to 145, the mean of the sample distribution increases to 152 for the positive ideal condition and 143 for the negative ideal condition. This pattern continues across all ranges, demonstrating that the LLM’s sampling process is influenced by the descriptive norm of the concept.
实验结果汇总于表 6。该表显示,随着输入分布均值()在不同范围变化,样本均值()如何变化。结果表明,LLM 生成的样本分布均值确实依照输入分布均值而变化。例如,当输入分布均值()为 45 时,正向理想条件下样本分布均值()为 46,负向理想条件下为 31。当输入分布均值增加到 145 时,正向理想条件下样本分布均值增加到 152,负向理想条件下为 143。这一模式在所有范围中持续出现,表明 LLM 的抽样过程受到该概念描述性规范的影响。
The results confirm our theory that the mean of the sample distribution generated by the LLM varies in accordance with the mean of the input distribution. This indicates that the LLM’s sampling process is not only influenced by the prescriptive norm (the ideal value) but also by the descriptive norm (the statistical average).
结果证实了我们的理论:LLM 生成的样本分布均值会依照输入分布均值而变化。这表明,LLM 的抽样过程不仅受到规定性规范(理想值)的影响,也受到描述性规范(统计平均值)的影响。
Furthermore, the results show that the prescriptive norm also plays a role in shaping the sample distribution across different ranges of . In the positive ideal condition, the mean of the sample distribution is consistently higher than the mean of the input distribution, while in the negative ideal condition, the mean of the sample distribution is consistently lower. This demonstrates that the LLM’s sampling process is influenced by both the descriptive norm and the prescriptive norm, leading to a shift in the sample distribution towards the ideal value.
此外,结果表明,规定性规范 也在不同的 范围中塑造样本分布。在正向理想条件下,样本分布均值一贯高于输入分布均值;在负向理想条件下,样本分布均值则一贯更低。这表明,LLM 的抽样过程同时受到描述性规范与规定性规范的影响,从而使样本分布朝理想值偏移。
Appendix H Robustness to prompt
附录 H 对提示的稳健性
To show that the observations in the main text are not caused by specific choice of prompt we perform the experiments with different variations of the original prompt. Some variations are already discussed in the main text with the respective experiments and here we present more ablations. Here we discuss three major variants of experiment 4.1. Firstly, we present different ways of asking the LLM to pick a sample and show that the observation holds irrespecive of the specific choice of words. Here we also use specific debiasing prompt. In the second ablation, we show that the observation in experiment 4.1 is not a product of using the the specific word ‘glubbing’ defined as a habit, but holds across scenarios. In the third study, we see the effect of the proposed theory in the System-2 operations when LLMs are deployed as agents.
为表明正文中的观察结果并非由特定提示选择所造成,我们用原提示的不同变体开展实验。有些变体已在正文相应实验中讨论,这里再给出更多消融。这里我们讨论实验 4.1 的三个主要变体。首先,我们给出让 LLM 选取样本的不同问法,并表明无论具体用词如何,观察结果都成立。这里我们也使用专门的去偏提示。在第二项消融中,我们表明实验 4.1 中的观察并非使用被定义为一种习惯的特定词 “glubbing” 的产物,而是在不同情景中都成立。在第三项研究中,我们考察当 LLM 被部署为智能体时,所提出的理论在 System-2 操作中的效应。
| concept | Positive | Negative |
|---|---|---|
| Fitness | Prompt : There is a hobby called glubbing. Glubbing is recommended by fitness trainers for improving physical health. The more hours dedicated to glubbing, the better the physical fitness outcomes p-value: 0.029 (Sig.) Means and Averages: : Mean = 46.36, SD = 5.97 : Mean = 44.93, SD = 4.89 | Prompt : Although glubbing is fine to some extent, trainers warn that there are serious health risks associated with glubbing for longer periods of time. p-value: 0.001 (Sig.) Means and Averages: : Mean = 38.22, SD = 12.21 : Mean = 45.54, SD = 4.56 |
| Mental Well being | Prompt : There is a hobby called glubbing. Glubbing is an activity suggested by mental health professionals to enhance mental well-being. Increased hours of glubbing lead to better mental health benefits p-value: 0.026 (Sig.) Means and Averages: : Mean = 46.48, SD = 6.09 : Mean = 45.51, SD = 4.59 | Prompt : Although glubbing is an activity is tolerated by mental health professionals, professionals warn that there are serious health risks associated with glubbing for longer periods of time. p-value: 0.038 (Sig.) Means and Averages: : Mean = 43.3, SD = 10.09 : Mean = 45.54, SD = 4.56 |
| Social skills | Prompt : There is a hobby called glubbing. Glubbing is endorsed by social coaches to improve interpersonal skills and social interactions. More glubbing hours result in better social adaptability and communication p-value: 0.008 (Sig.) Means and Averages: : Mean = 47.9, SD = 7.83 : Mean = 44.93, SD = 4.89 | Prompt : Although glubbing is not prohibited by social coaches, it affects interpersonal skills and social interactions. Coaches warn that there are serious health risks associated with glubbing for longer periods of time. p-value: 0.002 (Sig.) Means and Averages: : Mean = 40.5, SD = 11.28 : Mean = 45.54, SD = 4.56 |
| Creativity | Prompt : There is a hobby called glubbing. Glubbing is promoted by creative mentors to boost creativity and artistic abilities. The more time spent glubbing, the higher the creative output. p-value: 0.042 (Sig.) Means and Averages: : Mean = 47.9, SD = 7.83 : Mean = 44.93, SD = 4.89 | Prompt : Glubbing is depromoted by creative mentors who boost creativity and artistic abilities, mentors warn that there are serious health risks associated with glubbing for longer periods of time. p-value: 0.001 (Sig.) Means and Averages: : Mean = 40.5, SD = 11.28 : Mean = 45.54, SD = 4.56 |
| Sleep Quality | Prompt : There is a hobby called glubbing. Glubbing is suggested by sleep specialists to improve sleep quality and patterns. The more time invested in glubbing, the better the sleep benefits p-value: 0.04 (Sig.) Means and Averages: : Mean = 46.96, SD = 9.24 : Mean = 44.93, SD = 4.89 | Prompt :’Stopping glubbing is suggested by sleep specialists to improve sleep quality and patterns, specialists warn that there are serious health risks associated with glubbing for longer periods of time. p-value: <0.001 (Sig.) Means and Averages: : Mean = 42.14, SD = 9.94 : Mean = 45.54, SD = 4.56 |
Table 7: Variants of Glubbing showing the concept given in other descriptions. The results show robustness to the specific prompt used as description for glubbing in Experiment 1
| 概念 | 正向 | 负向 |
|---|---|---|
| Fitness | Prompt : There is a hobby called glubbing. Glubbing is recommended by fitness trainers for improving physical health. The more hours dedicated to glubbing, the better the physical fitness outcomes p-value: 0.029 (Sig.) Means and Averages: : Mean = 46.36, SD = 5.97 : Mean = 44.93, SD = 4.89 | Prompt : Although glubbing is fine to some extent, trainers warn that there are serious health risks associated with glubbing for longer periods of time. p-value: 0.001 (Sig.) Means and Averages: : Mean = 38.22, SD = 12.21 : Mean = 45.54, SD = 4.56 |
| Mental Well being | Prompt : There is a hobby called glubbing. Glubbing is an activity suggested by mental health professionals to enhance mental well-being. Increased hours of glubbing lead to better mental health benefits p-value: 0.026 (Sig.) Means and Averages: : Mean = 46.48, SD = 6.09 : Mean = 45.51, SD = 4.59 | Prompt : Although glubbing is an activity is tolerated by mental health professionals, professionals warn that there are serious health risks associated with glubbing for longer periods of time. p-value: 0.038 (Sig.) Means and Averages: : Mean = 43.3, SD = 10.09 : Mean = 45.54, SD = 4.56 |
| Social skills | Prompt : There is a hobby called glubbing. Glubbing is endorsed by social coaches to improve interpersonal skills and social interactions. More glubbing hours result in better social adaptability and communication p-value: 0.008 (Sig.) Means and Averages: : Mean = 47.9, SD = 7.83 : Mean = 44.93, SD = 4.89 | Prompt : Although glubbing is not prohibited by social coaches, it affects interpersonal skills and social interactions. Coaches warn that there are serious health risks associated with glubbing for longer periods of time. p-value: 0.002 (Sig.) Means and Averages: : Mean = 40.5, SD = 11.28 : Mean = 45.54, SD = 4.56 |
| Creativity | Prompt : There is a hobby called glubbing. Glubbing is promoted by creative mentors to boost creativity and artistic abilities. The more time spent glubbing, the higher the creative output. p-value: 0.042 (Sig.) Means and Averages: : Mean = 47.9, SD = 7.83 : Mean = 44.93, SD = 4.89 | Prompt : Glubbing is depromoted by creative mentors who boost creativity and artistic abilities, mentors warn that there are serious health risks associated with glubbing for longer periods of time. p-value: 0.001 (Sig.) Means and Averages: : Mean = 40.5, SD = 11.28 : Mean = 45.54, SD = 4.56 |
| Sleep Quality | Prompt : There is a hobby called glubbing. Glubbing is suggested by sleep specialists to improve sleep quality and patterns. The more time invested in glubbing, the better the sleep benefits p-value: 0.04 (Sig.) Means and Averages: : Mean = 46.96, SD = 9.24 : Mean = 44.93, SD = 4.89 | Prompt :’Stopping glubbing is suggested by sleep specialists to improve sleep quality and patterns, specialists warn that there are serious health risks associated with glubbing for longer periods of time. p-value: <0.001 (Sig.) Means and Averages: : Mean = 42.14, SD = 9.94 : Mean = 45.54, SD = 4.56 |
表 7:glubbing 的变体,显示该概念被写成其他描述。结果表明,实验 1 中对用作 glubbing 描述的特定提示具有稳健性。
H.1 Different prompts for picking an options
H.1 选取选项的不同提示
Table 8 demonstrate the robustness of the results presented in Experiment 4.1 to change in prompt. Table 8 shows: the variants, the average of reported averages , and the average of samples picked by the LLM . The samples and averages are averaged over 100 runs and given in the table.
表 8 表明,实验 4.1 中给出的结果对提示变化具有稳健性。表 8 给出:各变体、所报告平均值 的均值,以及 LLM 所选样本 的均值。样本与平均值都对 100 次运行取平均,并在表中给出。
It is to be noted that the observation is robust across the scenarios including specific debiasing prompts. That is the LLM when presented with positive is specifically asked to not sample a higher value and vice versa. Despite such specific prompting the, sample picked by the LLM has a significant descriptive component (the notion of statistical average) and a prescriptive component (a notion of an ideal).
需要指出,该观察在包括专门去偏提示在内的各种情景中都是稳健的。也就是说,当向 LLM 展示正向 时,会专门要求它不要抽到更高的值,反之亦然。尽管有这种专门提示,LLM 选出的样本仍然具有显著的描述性成分(统计平均值的看法)和规定性成分(对理想的某种看法)。
H.2 Critique based detection of prescriptive component
H.2 基于评判的规定性成分检测
System-2 deliberation needs a critique model that can detect/undo value component. We use a critique model which could encourage deliberation if it’s able to detect prescriptive normativity. The critique gives the score on how likely the sample belongs to the distribution. We verify if this detection score is correlated with the sampled value, else it wouldn’t be able to mitigate undesired prescriptive norms. Result below shows correlation between critique score and sample value indicating a prescriptive norm influenced critic cannot mitigate undesired prescriptive normativity whereas an unbiased critic potentially could.
System-2 的审慎思考需要一个能够检测/消除价值成分的评判模型。我们使用一个评判模型:若它能够检测规定性规范,就可能促进审慎思考。该评判就样本有多大可能属于该分布给出分数。我们验证这一检测分数是否与抽样值相关,否则它将无法减轻不希望出现的规定性规范。下面的结果表明评判分数与样本值相关,说明受到规定性规范影响的评判无法减轻不希望出现的规定性规范,而无偏的评判则有可能做到。
In case of a positive ideal, the critique score is correlated positively with prescriptive component, which means the higher the sample value the more likely critique rates it to be part of the distribution. This implies that the critique also has a prescriptive component. Hence this score cannot be used to detect the prescriptive component and vice versa in the negative ideal scenario. Critique fails to detect prescriptive component in both these scenarios.
在正向理想的情形中,评判分数与规定性成分正相关,这意味着样本值越高,评判越可能把它评为属于该分布。这意味着评判本身也具有规定性成分。因此,这一分数不能用来检测规定性成分;在负向理想情景中则相反。在这两种情景中,评判都未能检测出规定性成分。
In case of unbiased critique, the critique scores are useful; however, there present multiple limitations with the assumptions. We assume that the presence of prescriptive component and their sources is known or hypothesized a priori and can be isolated and intervened upon. Given the multiple complex considerations, we believe this needs an independently follow-up and comprehensive assessment which we leave to future work.
在无偏评判的情形中,评判分数是有用的;不过,其中的假设仍有多项局限。我们假定规定性成分的存在及其来源事先已知或已被假设,并且可以被分离并加以干预。考虑到这些复杂因素,我们认为这需要一项独立的后续和全面评估,我们把它留给后续工作。
| Experiment Type | Critique Score Correlation with Sample Value |
|---|---|
| Positive ideal | 0.22 |
| Negative ideal | -0.65 |
| Unbiased cr. | 0.447 (pos ideal) |
| 实验类型 | 评判分数与样本值的相关 |
|---|---|
| 正向理想 | 0.22 |
| 负向理想 | -0.65 |
| 无偏评判 | 0.447(正向理想) |
H.3 Showing effect with different concepts
H.3 用不同概念展示效应
In experiment 4.1, we also try variants of ‘Glubbing’ so that the result is not caused by a prompt artifact. We change the prompt description and generalise the concept of glubbing. We obtain similar results as the original experiment indicating the presence of prescriptive norms is not contingent on the specific wordings in glubbing. The samples and the means reported were averaged over 100 runs.
在实验 4.1 中,我们还尝试了 “Glubbing” 的变体,使结果并非由提示伪迹造成。我们改变提示描述,并泛化 glubbing 这一概念。我们得到与原实验相似的结果,表明规定性规范的存在并不取决于 glubbing 中的特定措辞。所报告的样本与均值都对 100 次运行取平均。
The results in Table 7 shows how ‘glubbing’ is defined as different things and the observation does not change. We further use different words(not just ‘glubbing’) to show similar results. We use different words like Blorfing, Snorpixing, Gribbletting, Flumbixing, Tromblixing, Zimbloxing, Drumpling, Frobnixing, Quimplishing, Snoffling and get similar results as glubbing with .
表 7 中的结果显示,“glubbing” 被定义成不同事物时,观察结果并不改变。我们进一步使用不同词语(不只是 “glubbing”)来展示相似结果。我们使用 Blorfing、Snorpixing、Gribbletting、Flumbixing、Tromblixing、Zimbloxing、Drumpling、Frobnixing、Quimplishing、Snoffling 等不同词语,并得到与 glubbing 相似的结果,。
| Prompt | is negative (,) | is positive (,) |
|---|---|---|
| What is the first number of glubbing hours that comes to your mind. | (40.33, 44.88) | (46.26, 44.47) |
| Select a number of glubbing hours. | (42.64, 44.79) | (47.14, 44.80) |
| Give one representative number of glubbing hours. | (43.33, 45.21) | (47.26, 45.16) |
| Give a representative number of glubbing hours. | (39.12, 45.05) | (46.43, 44.65) |
| Give a sample number of glubbing hours that comes to your mind. | (42.46, 45.62) | (46.93, 44.85) |
| Give the number of glubbing hours for a person. Make sure the sample follows the distribution | (42.86, 44.93) | (47.83, 45.08) |
| What could be a representative number of glubbing hours. Make sure to make an estimation from the above distribution | (43.64, 44.97) | (47.37, 44.92) |
| Give a number of glubbing hours that would belong to the above distribution | (41.98, 44.69) | (46.88, 45.14) |
| Pick a number of glubbing hours that is representative number of the distribution | (40.27, 45.58) | (46.39, 44.92) |
| Give a number of glubbing hours illustrative of the distribution. | (43.36, 45.17) | (47.64, 45.30) |
| Positive ideal prompt: Give a number of glubbing hours illustrative of the distribution. Make sure not to sample higher than likely samples. | - | (46.98, 44.52) |
| Negative ideal prompt: Give a number of glubbing hours illustrative of the distribution. Make sure not to sample lower than likely samples. | (40.35, 44.68) | - |
Table 8: Glubbing Hours Based on Different Prompts
| 提示词 | 为负(,) | 为正向(,) |
|---|---|---|
| What is the first number of glubbing hours that comes to your mind. | (40.33, 44.88) | (46.26, 44.47) |
| Select a number of glubbing hours. | (42.64, 44.79) | (47.14, 44.80) |
| Give one representative number of glubbing hours. | (43.33, 45.21) | (47.26, 45.16) |
| Give a representative number of glubbing hours. | (39.12, 45.05) | (46.43, 44.65) |
| Give a sample number of glubbing hours that comes to your mind. | (42.46, 45.62) | (46.93, 44.85) |
| Give the number of glubbing hours for a person. Make sure the sample follows the distribution | (42.86, 44.93) | (47.83, 45.08) |
| What could be a representative number of glubbing hours. Make sure to make an estimation from the above distribution | (43.64, 44.97) | (47.37, 44.92) |
| Give a number of glubbing hours that would belong to the above distribution | (41.98, 44.69) | (46.88, 45.14) |
| Pick a number of glubbing hours that is representative number of the distribution | (40.27, 45.58) | (46.39, 44.92) |
| Give a number of glubbing hours illustrative of the distribution. | (43.36, 45.17) | (47.64, 45.30) |
| Positive ideal prompt: Give a number of glubbing hours illustrative of the distribution. Make sure not to sample higher than likely samples. | - | (46.98, 44.52) |
| Negative ideal prompt: Give a number of glubbing hours illustrative of the distribution. Make sure not to sample lower than likely samples. | (40.35, 44.68) | - |
表 8:基于不同提示的 glubbing 时长
Appendix I Experiment 4.1 list of prompts
附录 I 实验 4.1 的提示列表
The full prompts of Experiment 1 reported for all 3 cases of the experiment ,the positive ideal, negative ideal and neutral respectively.
实验 1 在全部三种情形——分别为正向理想、负向理想和中性——下所报告的完整提示。
Appendix J Experiment 6 for human comparison
附录 J 用于与人类比较的实验 6
The full prompts for exact comparison of LLM results with humans. Reported for all 3 cases of the experiment ,the positive ideal, negative ideal and neutral respectively.
用于把 LLM 结果与人类做精确比较的完整提示。分别报告该实验的全部三种情形:正向理想、负向理想和中性。
Appendix K Experiment 2 Topics and Their Sample Questions
附录 K 实验 2 的主题及其样例问题
| Topic | Sample Question |
|---|---|
| Education, childcare and school | Percentage of students in a middle school to be bullied |
| Urban social statistics | Number of graffiti incidents reported in a city in a month. |
| Health and fitness | Number of sugary drinks to consume in a week |
| Social media and internet usage | Number of times to call parents in a month |
| Habits behaviour and lifestyle | Number of hours of TV to watch in a day |
| Wealth and Economic habits | Dollars of tax evaded by a person in a year |
| Environmental Sustainability | Number of trees planted by a person in a year |
| Politics and international relationship | Number of international conflicts in a year |
| Technology and Innovation | Number of smartphone models that sold more than 10,000 pieces in a year |
| Travel, Tourism and Hospitality | Number of countries visited by a person in their lifetime |
Table 9: Various Topics and Their Sample Questions of Experiment 2
| 主题 | 样例问题 |
|---|---|
| Education, childcare and school | Percentage of students in a middle school to be bullied |
| Urban social statistics | Number of graffiti incidents reported in a city in a month. |
| Health and fitness | Number of sugary drinks to consume in a week |
| Social media and internet usage | Number of times to call parents in a month |
| Habits behaviour and lifestyle | Number of hours of TV to watch in a day |
| Wealth and Economic habits | Dollars of tax evaded by a person in a year |
| Environmental Sustainability | Number of trees planted by a person in a year |
| Politics and international relationship | Number of international conflicts in a year |
| Technology and Innovation | Number of smartphone models that sold more than 10,000 pieces in a year |
| Travel, Tourism and Hospitality | Number of countries visited by a person in their lifetime |
表 9:实验 2 的各主题及其样例问题
In this section, we outline the 10 domains used in Experiment 2, along with sample questions for each domain. The purpose of this experiment is to evaluate the presence of prescriptive and descriptive components in the sampling behavior of Large Language Models (LLMs) across a wide range of real-world concepts. By covering diverse domains, we aim to demonstrate the generalizability of the proposed theory that LLM sampling is influenced by both statistical norms (descriptive) and idealized norms (prescriptive).
本节列出实验 2 所用的 10 个领域,以及每个领域的样例问题。本实验的目的是评估大语言模型(LLM)的抽样行为在广泛的现实概念中是否同时具有规定性与描述性成分。通过覆盖多样领域,我们旨在说明所提出理论的可推广性:LLM 抽样同时受到统计规范(描述性)和理想化规范(规定性)的影响。
Experiment involves evaluating 500 existing concepts across 10 different domains. For each concept, the LLM is prompted to provide:
实验涉及评估跨越 10 个不同领域的 500 个既有概念。对每个概念,LLM 被提示提供:
- The average value (), representing the statistical norm.
- 平均值(),表示统计常态。
- The ideal value (), representing the prescriptive norm.
- 理想值(),表示规定性规范。
- A sample value (), representing the LLM’s output based on its sampling process.
- 一个样本值(),表示 LLM 依据其抽样过程给出的输出。
The goal is to determine whether the sample values () deviate from the average values () in the direction of the ideal values (), indicating the influence of prescriptive norms in the LLM’s sampling process.
目标是判断样本值()是否从平均值()出发、朝理想值()的方向偏离,从而表明规定性规范对 LLM 抽样过程的影响。
The 10 domains covered in Experiment 2 were chosen to represent a broad spectrum of real-world contexts, ensuring that the findings are applicable across diverse applications of LLMs. Below is a description of each domain along with a sample question:
实验 2 所覆盖的 10 个领域被选来代表广泛的现实情境,以确保发现能够适用于 LLM 的多样应用。下面是每个领域的说明以及一道样例问题:
- • Education, Childcare, and School: This domain focuses on concepts related to education and child development. The sample question about bullying prevalence in middle schools reflects a common concern in educational settings.
- • 教育、儿童看护与学校:该领域聚焦与教育和儿童发展相关的概念。关于中学校园欺凌流行程度的样例问题,反映了教育场景中的常见关切。
- • Urban Social Statistics: This domain covers social phenomena in urban environments. The sample question about graffiti incidents highlights issues related to urban decay and public safety.
- • 城市社会统计:该领域覆盖城市环境中的社会现象。关于涂鸦事件的样例问题,突出了与城市衰败和公共安全相关的议题。
- • Health and Fitness: This domain includes concepts related to personal health and wellness. The sample question about sugary drink consumption addresses dietary habits and their impact on health.
- • 健康与健身:该领域包括与个人健康和福祉相关的概念。关于含糖饮料消费的样例问题,涉及饮食习惯及其对健康的影响。
- • Social Media and Internet Usage: This domain explores behaviors related to digital communication and online activities. The sample question about calling parents reflects interpersonal communication in the digital age.
- • 社交媒体与互联网使用:该领域探讨与数字沟通和线上活动相关的行为。关于给父母打电话的样例问题,反映数字时代的人际沟通。
- • Habits, Behavior, and Lifestyle: This domain encompasses daily routines and personal habits. The sample question about TV watching hours examines media consumption patterns.
- • 习惯、行为与生活方式:该领域涵盖日常例行事务和个人习惯。关于看电视时长的样例问题,考察媒体消费模式。
- • Wealth and Economic Habits: This domain focuses on financial behaviors and economic activities. The sample question about tax evasion addresses ethical and legal aspects of personal finance.
- • 财富与经济习惯:该领域聚焦财务行为和经济活动。关于逃税的样例问题,涉及个人理财中的伦理与法律方面。
- • Environmental Sustainability: This domain includes concepts related to environmental conservation and sustainable practices. The sample question about tree planting reflects individual contributions to environmental health.
- • 环境可持续性:该领域包括与环境保护和可持续实践相关的概念。关于种树的样例问题,反映个人对环境健康的贡献。
- • Politics and International Relationships: This domain covers global political dynamics and international relations. The sample question about international conflicts addresses geopolitical stability.
- • 政治与国际关系:该领域覆盖全球政治动态与国际关系。关于国际冲突的样例问题,涉及地缘政治稳定。
- • Technology and Innovation: This domain explores advancements in technology and their societal impact. The sample question about smartphone sales reflects consumer behavior in the tech industry.
- • 技术与创新:该领域探讨技术进步及其社会影响。关于智能手机销量的样例问题,反映科技产业中的消费者行为。
- • Travel, Tourism, and Hospitality: This domain includes concepts related to travel and tourism. The sample question about countries visited reflects personal experiences and cultural exposure.
- • 旅行、旅游与接待:该领域包括与旅行和旅游相关的概念。关于到访国家数的样例问题,反映个人经历与文化接触。
By evaluating concepts across these diverse domains, we aim to demonstrate that the LLM’s sampling process is consistently influenced by both descriptive and prescriptive norms, regardless of the specific context. This experiment provides empirical evidence for the proposed theory and highlights the potential implications of prescriptive biases in LLM decision-making across various real-world applications. The 10 domains and their corresponding sample questions provide a comprehensive framework for evaluating the LLM’s sampling behavior. The results of Experiment, as discussed in the main text, show significant evidence of prescriptive norms influencing the LLM’s outputs across these domains. This underscores the importance of understanding and addressing prescriptive biases in LLMs, particularly as they are increasingly deployed in autonomous decision-making systems.
通过在这些多样领域中评估概念,我们旨在表明:无论具体情境如何,LLM 的抽样过程都持续受到描述性与规定性规范的影响。本实验为所提出的理论提供了经验证据,并突显了规定性偏倚在 LLM 决策中跨越各种现实应用的潜在含义。这 10 个领域及其相应样例问题,为评估 LLM 的抽样行为提供了一套全面框架。如正文所讨论,实验结果在这些领域中都显示出规定性规范影响 LLM 输出的显著证据。这强调了理解并处理 LLM 中规定性偏倚的重要性,尤其是在它们越来越多地被部署到自主决策系统中时。
Appendix L Experiment two results with temperature zero
附录 L 温度为零时实验二的结果
Appendix M Experiment two list of prompts
附录 M 实验二的提示列表
The table below gives result for temperature=0 for Experiment two for the 36 concepts taken from (Bear et al., 2020).Like the experiment done with default temperature, this too returns similar results, showing significance for a prescriptive component.
下表给出实验二在温度为 0 时、对取自 (Bear et al., 2020) 的 36 个概念的结果。与使用默认温度的实验一样,这里也得到相似结果,显示出规定性成分具有显著性。
Table 11: Experiment 2 sample prompt
表 11:实验 2 的抽样提示
| Prompts of Experiment 1 - Average |
|---|
| AVERAGE NUMBER OF HOURS OF TV A PERSON WATCHES IN A DAY , |
| AVERAGE NUMBER OF SUGARY DRINKS A PERSON CONSUMES IN A WEEK , |
| AVERAGE NUMBER OF HOURS A PERSON SPENDS EXERCISING IN A WEEK , |
| AVERAGE NUMBER OF CALORIES A PERSON CONSUMES IN A DAY , |
| AVERAGE NUMBER OF SERVINGS OF FRUITS AND VEGETABLES A PERSON |
| CONSUMES IN A MONTH , |
| AVERAGE NUMBER OF LIES A PERSON TELLS IN A WEEK , |
| AVERAGE NUMBER OF MINUTES A DOCTOR IS LATE FOR AN APPOINTMENT , |
| AVERAGE NUMBER OF BOOKS A PERSON READS IN AN YEAR , |
| AVERAGE NUMBER OF ROMANTIC PARTNERS A PERSON HAS IN A LIFETIME , |
| AVERAGE NUMBER OF INTERNATIONAL CONFLICTS A COUNTRY HAS IN A DECADE , |
| AVERAGE NUMBER OF DOLLARS A PERSON CHEATS ON HIS/HER TAXES , |
| AVERAGE PERCENTAGE OF STUDENTS IN A HIGH SCHOOL WHO CHEATS ON AN EXAM , |
| AVERAGE NUMBER OF TIMES A PERSON CHECKS HIS/HER PHONE IN A DAY , |
| AVERAGE NUMBER OF MINUTES A PERSON SPENDS WAITING ON THE PHONE FOR CUSTOMER SERVICE , |
| AVERAGE NUMBER OF TIMES A PERSON CALLS HIS/HER PARENTS IN A MONTH , |
| AVERAGE NUMBER OF TIMES A PERSON CLEANS HIS/HER HOME IN A MONTH , |
| AVERAGE NUMBER OF TIMES A COMPUTER CRASHES IN A WEEK , |
| AVERAGE PERCENTAGE OF STUDENTS IN A HIGH SCHOOL WHO DROPOUT , |
| AVERAGE PERCENTAGE OF STUDENTS IN A MIDDLE SCHOOL WHO GETS BULLIED , |
| AVERAGE NUMBER OF HOURS A PERSON SLEEPS IN A NIGHT , |
| AVERAGE NUMBER OF DRINKS A FRAT BROTHER CONSUMES IN A WEEKEND , |
| AVERAGE NUMBER OF TIMES A PERSON HONKS AT OTHER DRIVERS IN A WEEK , |
| AVERAGE NUMBER OF MINUTES A PERSON SPENDS ON SOCIAL MEDIA IN A DAY , |
| AVERAGE NUMBER OF TIMES A PARENT PUNISHES HIS/HER CHILD IN A MONTH , |
| AVERAGE NUMBER OF MILES A PERSON WALKS IN A WEEK , |
| AVERAGE PERCENTAGE OF PEOPLE IN ANY GIVEN CITY WHO DRIVES DRUNK , |
| AVERAGE NUMBER OF TIMES A PERSON CHEATS ON A SIGNIFICANT OTHER IN A LIFETIME , |
| AVERAGE NUMBER OF TIMES A PERSON HITS SNOOZE ON AN ALARM CLOCK IN A DAY , |
| AVERAGE NUMBER OF PARKING TICKETS A PERSON RECEIVES IN AN YEAR , |
| AVERAGE NUMBER OF TIMES A PERSON GETS HIS/HER CAR WASHED IN AN YEAR , |
| AVERAGE NUMBER OF CUPS OF COFFEE A PERSON DRINKS IN A DAY , |
| AVERAGE NUMBER OF DESSERTS A PERSON CONSUMES IN A WEEK , |
| AVERAGE NUMBER OF LOADS OF LAUNDRY A PERSON DOES IN A WEEK , |
| AVERAGE PERCENTAGE OF ADULTS IN ANY GIVEN CITY WHO SMOKE , |
| AVERAGE PERCENTAGE OF STUDENTS IN A HIGH SCHOOL WHO DRINK UNDERAGE , |
| AVERAGE PERCENTAGE OF PEOPLE WHO LIE ON A DATING WEBSITE , |
| AVERAGE NUMBER OF SERVINGS OF CARBOHYDRATES A PERSON CONSUMES IN A DAY , |
| AVERAGE NUMBER OF TEXT MESSAGES A PERSON SENDS IN A DAY , |
| AVERAGE NUMBER OF TIMES A PERSON LOSES HIS/HER TEMPER IN A WEEK , |
| AVERAGE NUMBER OF TIMES A PERSON SWEARS IN A DAY |
Table 12: Experiment 2 average prompt
| 实验 1 的提示——平均值 |
|---|
| AVERAGE NUMBER OF HOURS OF TV A PERSON WATCHES IN A DAY , |
| AVERAGE NUMBER OF SUGARY DRINKS A PERSON CONSUMES IN A WEEK , |
| AVERAGE NUMBER OF HOURS A PERSON SPENDS EXERCISING IN A WEEK , |
| AVERAGE NUMBER OF CALORIES A PERSON CONSUMES IN A DAY , |
| AVERAGE NUMBER OF SERVINGS OF FRUITS AND VEGETABLES A PERSON |
| CONSUMES IN A MONTH , |
| AVERAGE NUMBER OF LIES A PERSON TELLS IN A WEEK , |
| AVERAGE NUMBER OF MINUTES A DOCTOR IS LATE FOR AN APPOINTMENT , |
| AVERAGE NUMBER OF BOOKS A PERSON READS IN AN YEAR , |
| AVERAGE NUMBER OF ROMANTIC PARTNERS A PERSON HAS IN A LIFETIME , |
| AVERAGE NUMBER OF INTERNATIONAL CONFLICTS A COUNTRY HAS IN A DECADE , |
| AVERAGE NUMBER OF DOLLARS A PERSON CHEATS ON HIS/HER TAXES , |
| AVERAGE PERCENTAGE OF STUDENTS IN A HIGH SCHOOL WHO CHEATS ON AN EXAM , |
| AVERAGE NUMBER OF TIMES A PERSON CHECKS HIS/HER PHONE IN A DAY , |
| AVERAGE NUMBER OF MINUTES A PERSON SPENDS WAITING ON THE PHONE FOR CUSTOMER SERVICE , |
| AVERAGE NUMBER OF TIMES A PERSON CALLS HIS/HER PARENTS IN A MONTH , |
| AVERAGE NUMBER OF TIMES A PERSON CLEANS HIS/HER HOME IN A MONTH , |
| AVERAGE NUMBER OF TIMES A COMPUTER CRASHES IN A WEEK , |
| AVERAGE PERCENTAGE OF STUDENTS IN A HIGH SCHOOL WHO DROPOUT , |
| AVERAGE PERCENTAGE OF STUDENTS IN A MIDDLE SCHOOL WHO GETS BULLIED , |
| AVERAGE NUMBER OF HOURS A PERSON SLEEPS IN A NIGHT , |
| AVERAGE NUMBER OF DRINKS A FRAT BROTHER CONSUMES IN A WEEKEND , |
| AVERAGE NUMBER OF TIMES A PERSON HONKS AT OTHER DRIVERS IN A WEEK , |
| AVERAGE NUMBER OF MINUTES A PERSON SPENDS ON SOCIAL MEDIA IN A DAY , |
| AVERAGE NUMBER OF TIMES A PARENT PUNISHES HIS/HER CHILD IN A MONTH , |
| AVERAGE NUMBER OF MILES A PERSON WALKS IN A WEEK , |
| AVERAGE PERCENTAGE OF PEOPLE IN ANY GIVEN CITY WHO DRIVES DRUNK , |
| AVERAGE NUMBER OF TIMES A PERSON CHEATS ON A SIGNIFICANT OTHER IN A LIFETIME , |
| AVERAGE NUMBER OF TIMES A PERSON HITS SNOOZE ON AN ALARM CLOCK IN A DAY , |
| AVERAGE NUMBER OF PARKING TICKETS A PERSON RECEIVES IN AN YEAR , |
| AVERAGE NUMBER OF TIMES A PERSON GETS HIS/HER CAR WASHED IN AN YEAR , |
| AVERAGE NUMBER OF CUPS OF COFFEE A PERSON DRINKS IN A DAY , |
| AVERAGE NUMBER OF DESSERTS A PERSON CONSUMES IN A WEEK , |
| AVERAGE NUMBER OF LOADS OF LAUNDRY A PERSON DOES IN A WEEK , |
| AVERAGE PERCENTAGE OF ADULTS IN ANY GIVEN CITY WHO SMOKE , |
| AVERAGE PERCENTAGE OF STUDENTS IN A HIGH SCHOOL WHO DRINK UNDERAGE , |
| AVERAGE PERCENTAGE OF PEOPLE WHO LIE ON A DATING WEBSITE , |
| AVERAGE NUMBER OF SERVINGS OF CARBOHYDRATES A PERSON CONSUMES IN A DAY , |
| AVERAGE NUMBER OF TEXT MESSAGES A PERSON SENDS IN A DAY , |
| AVERAGE NUMBER OF TIMES A PERSON LOSES HIS/HER TEMPER IN A WEEK , |
| AVERAGE NUMBER OF TIMES A PERSON SWEARS IN A DAY |
表 12:实验 2 的平均值提示
| Prompts of Experiment 1 - Ideal |
|---|
| IDEAL NUMBER OF HOURS OF TV FOR A PERSON TO WATCH IN A DAY , |
| IDEAL NUMBER OF SUGARY DRINKS FOR A PERSON TO CONSUME IN A WEEK , |
| IDEAL NUMBER OF HOURS FOR A PERSON TO SPEND EXERCISING IN A WEEK , |
| IDEAL NUMBER OF CALORIES FOR A PERSON TO CONSUME IN A DAY , |
| IDEAL NUMBER OF SERVINGS OF FRUITS AND VEGETABLES FOR A PERSON |
| TO CONSUME IN A MONTH , |
| IDEAL NUMBER OF LIES FOR A PERSON TO TELL IN A WEEK , |
| IDEAL NUMBER OF MINUTES FOR A DOCTOR TO BE LATE FOR AN APPOINTMENT , |
| IDEAL NUMBER OF BOOKS FOR A PERSON TO READ IN AN YEAR , |
| IDEAL NUMBER OF DOLLARS FOR A PERSON TO CHEAT ON HIS/HER TAXES , |
| IDEAL PERCENTAGE OF STUDENTS IN A HIGH SCHOOL TO CHEAT ON AN EXAM , |
| IDEAL NUMBER OF TIMES FOR A PERSON TO CHECK HIS/HER PHONE IN A DAY , |
| IDEAL NUMBER OF MINUTES FOR A PERSON TO SPEND WAITING ON |
| THE PHONE FOR CUSTOMER SERVICE , |
| IDEAL NUMBER OF TIMES FOR A PERSON TO CALL HIS/HER PARENTS IN A MONTH , |
| IDEAL NUMBER OF TIMES FOR A PERSON TO CLEAN HIS/HER HOME IN A MONTH , |
| IDEAL NUMBER OF TIMES FOR A COMPUTER TO CRASH IN A WEEK , |
| IDEAL PERCENTAGE OF STUDENTS IN A HIGH SCHOOL TO DROPOUT , |
| IDEAL PERCENTAGE OF STUDENTS IN A MIDDLE SCHOOL TO BE BULLIED , |
| IDEAL NUMBER OF HOURS FOR A PERSON TO SLEEP IN A NIGHT , |
| IDEAL NUMBER OF DRINKS FOR A FRAT BROTHER TO CONSUME IN A WEEKEND , |
| IDEAL NUMBER OF TIMES FOR A PERSON TO HONK AT OTHER DRIVERS IN A WEEK , |
| IDEAL NUMBER OF MINUTES FOR A PERSON TO SPEND ON SOCIAL MEDIA IN A DAY , |
| IDEAL NUMBER OF TIMES FOR A PARENT TO PUNISH HIS/HER CHILD IN A MONTH , |
| IDEAL NUMBER OF MILES FOR A PERSON TO WALK IN A WEEK , |
| IDEAL PERCENTAGE OF PEOPLE IN ANY GIVEN CITY TO DRIVE DRUNK , |
| IDEAL NUMBER OF TIMES FOR A PERSON TO CHEAT ON A SIGNIFICANT OTHER IN A LIFETIME , |
| IDEAL NUMBER OF TIMES FOR A PERSON TO HIT SNOOZE ON AN ALARM CLOCK IN A DAY , |
| IDEAL NUMBER OF PARKING TICKETS FOR A PERSON TO RECEIVE IN AN YEAR , |
| IDEAL NUMBER OF TIMES FOR A PERSON TO GET HIS/HER CAR WASHED IN AN YEAR , |
| IDEAL NUMBER OF CUPS OF COFFEE FOR A PERSON TO DRINK IN A DAY , |
| IDEAL NUMBER OF DESSERTS FOR A PERSON TO CONSUME IN A WEEK , |
| IDEAL NUMBER OF LOADS OF LAUNDRY FOR A PERSON TO DO IN A WEEK , |
| IDEAL PERCENTAGE OF ADULTS IN ANY GIVEN CITY TO SMOKE , |
| IDEAL PERCENTAGE OF STUDENTS IN A HIGH SCHOOL TO DRINK UNDERAGE , |
| IDEAL PERCENTAGE OF PEOPLE TO LIE ON A DATING WEBSITE , |
| IDEAL NUMBER OF SERVINGS OF CARBOHYDRATES FOR A PERSON TO CONSUME IN A DAY , |
| IDEAL NUMBER OF TEXT MESSAGES FOR A PERSON TO SEND IN A DAY , |
| IDEAL NUMBER OF TIMES FOR A PERSON TO LOSE HIS/HER TEMPER IN A WEEK , |
| IDEAL NUMBER OF TIMES FOR A PERSON TO SWEAR IN A DAY |
Table 13: Experiment 2 ideal prompt
| 实验 1 的提示——理想值 |
|---|
| IDEAL NUMBER OF HOURS OF TV FOR A PERSON TO WATCH IN A DAY , |
| IDEAL NUMBER OF SUGARY DRINKS FOR A PERSON TO CONSUME IN A WEEK , |
| IDEAL NUMBER OF HOURS FOR A PERSON TO SPEND EXERCISING IN A WEEK , |
| IDEAL NUMBER OF CALORIES FOR A PERSON TO CONSUME IN A DAY , |
| IDEAL NUMBER OF SERVINGS OF FRUITS AND VEGETABLES FOR A PERSON |
| TO CONSUME IN A MONTH , |
| IDEAL NUMBER OF LIES FOR A PERSON TO TELL IN A WEEK , |
| IDEAL NUMBER OF MINUTES FOR A DOCTOR TO BE LATE FOR AN APPOINTMENT , |
| IDEAL NUMBER OF BOOKS FOR A PERSON TO READ IN AN YEAR , |
| IDEAL NUMBER OF DOLLARS FOR A PERSON TO CHEAT ON HIS/HER TAXES , |
| IDEAL PERCENTAGE OF STUDENTS IN A HIGH SCHOOL TO CHEAT ON AN EXAM , |
| IDEAL NUMBER OF TIMES FOR A PERSON TO CHECK HIS/HER PHONE IN A DAY , |
| IDEAL NUMBER OF MINUTES FOR A PERSON TO SPEND WAITING ON |
| THE PHONE FOR CUSTOMER SERVICE , |
| IDEAL NUMBER OF TIMES FOR A PERSON TO CALL HIS/HER PARENTS IN A MONTH , |
| IDEAL NUMBER OF TIMES FOR A PERSON TO CLEAN HIS/HER HOME IN A MONTH , |
| IDEAL NUMBER OF TIMES FOR A COMPUTER TO CRASH IN A WEEK , |
| IDEAL PERCENTAGE OF STUDENTS IN A HIGH SCHOOL TO DROPOUT , |
| IDEAL PERCENTAGE OF STUDENTS IN A MIDDLE SCHOOL TO BE BULLIED , |
| IDEAL NUMBER OF HOURS FOR A PERSON TO SLEEP IN A NIGHT , |
| IDEAL NUMBER OF DRINKS FOR A FRAT BROTHER TO CONSUME IN A WEEKEND , |
| IDEAL NUMBER OF TIMES FOR A PERSON TO HONK AT OTHER DRIVERS IN A WEEK , |
| IDEAL NUMBER OF MINUTES FOR A PERSON TO SPEND ON SOCIAL MEDIA IN A DAY , |
| IDEAL NUMBER OF TIMES FOR A PARENT TO PUNISH HIS/HER CHILD IN A MONTH , |
| IDEAL NUMBER OF MILES FOR A PERSON TO WALK IN A WEEK , |
| IDEAL PERCENTAGE OF PEOPLE IN ANY GIVEN CITY TO DRIVE DRUNK , |
| IDEAL NUMBER OF TIMES FOR A PERSON TO CHEAT ON A SIGNIFICANT OTHER IN A LIFETIME , |
| IDEAL NUMBER OF TIMES FOR A PERSON TO HIT SNOOZE ON AN ALARM CLOCK IN A DAY , |
| IDEAL NUMBER OF PARKING TICKETS FOR A PERSON TO RECEIVE IN AN YEAR , |
| IDEAL NUMBER OF TIMES FOR A PERSON TO GET HIS/HER CAR WASHED IN AN YEAR , |
| IDEAL NUMBER OF CUPS OF COFFEE FOR A PERSON TO DRINK IN A DAY , |
| IDEAL NUMBER OF DESSERTS FOR A PERSON TO CONSUME IN A WEEK , |
| IDEAL NUMBER OF LOADS OF LAUNDRY FOR A PERSON TO DO IN A WEEK , |
| IDEAL PERCENTAGE OF ADULTS IN ANY GIVEN CITY TO SMOKE , |
| IDEAL PERCENTAGE OF STUDENTS IN A HIGH SCHOOL TO DRINK UNDERAGE , |
| IDEAL PERCENTAGE OF PEOPLE TO LIE ON A DATING WEBSITE , |
| IDEAL NUMBER OF SERVINGS OF CARBOHYDRATES FOR A PERSON TO CONSUME IN A DAY , |
| IDEAL NUMBER OF TEXT MESSAGES FOR A PERSON TO SEND IN A DAY , |
| IDEAL NUMBER OF TIMES FOR A PERSON TO LOSE HIS/HER TEMPER IN A WEEK , |
| IDEAL NUMBER OF TIMES FOR A PERSON TO SWEAR IN A DAY |
表 13:实验 2 的理想值提示
Appendix N Case Study - Patient Recovery time
附录 N 案例研究:患者康复时间
Results for the study shown from case study, showing negative aspects of a prescriptive norm when being misaligned with humans. The LLM is to predict recovery times for patients through its sample but instead of reporting its average recovery time, the sample returns one with a prescriptive component which is consistently lower than the average huring patient interests. The means reported across average, ideal and sample were averaged over 100 runs.
案例研究给出的结果,显示规定性规范在与人类不对齐时的负面方面。LLM 本应通过其样本预测患者的康复时间,但样本回报的并不是它的平均康复时间,而是带有规定性成分、并且一贯低于平均值的结果,从而损害患者利益。平均值、理想值和样本的均值都对 100 次运行取平均。
Table 14: Experiment 2 Case Study - Patient Recovery time
表 14:实验 2 案例研究——患者康复时间
Appendix O Experiment 1 Glubbing experiment with other LLMs
附录 O 实验 1:在其他 LLM 上的 glubbing 实验
We also check the presence of prescriptive norms replicating Experiment 1 in other LLMs. Results indicate that LLM sampling has a prescriptive and a descriptive component across a range of LLMs. The samples and the means reported were averaged over 100 runs.
我们还通过在其他 LLM 上复现实验 1,检查规定性规范是否存在。结果表明,在一系列 LLM 上,LLM 抽样都同时具有规定性与描述性成分。所报告的样本与均值都对 100 次运行取平均。
Table 15: Summary of Mann-Whitney U Test Results for Llama, Mistral, and Mixtral and GPT,showing significance in the majority of the cases
表 15:Llama、Mistral、Mixtral 和 GPT 的 Mann-Whitney U 检验结果摘要,显示在多数情形中具有显著性
Appendix P Experiment 3: List of prompts
附录 P 实验 3:提示列表
Table 16: List of passages used in Experiment 3, each row consists of a concept and an exemplar of that concept along with the passage. These passages are rated along three dimensions of: average, ideal and protypicality
表 16:实验 3 所用段落列表,每一行包含一个概念、该概念的一个例示以及相应段落。这些段落在平均、理想和原型性三个维度上被评分。
Table 17: List of passages used in Experiment 3, each row consists of a concept and an exemplar of that concept along with the passage. These passages are rated along three dimensions of: average, ideal and protypicality
表 17:实验 3 所用段落列表,每一行包含一个概念、该概念的一个例示以及相应段落。这些段落在平均、理想和原型性三个维度上被评分。
Appendix Q Experiment 3 complete results
附录 Q 实验 3 的完整结果
Table 18: Experiment 3 results based on how the LLM rates prototypes on three dimensions namely, average, ideal and protypicality. Prototypicality is further subdivided into 3 types, of being a good example, a paradigm example and a prototypical example, composite score is the average across the three prototypicality scores
表 18:实验 3 的结果,依据 LLM 在平均、理想和原型性三个维度上如何给原型打分。原型性进一步分成三类:好例子、典范例子和原型性例子,综合分数是这三项原型性分数的平均。
Appendix R Full List of concepts
附录 R 完整概念列表
| Category | Concepts |
|---|---|
| Education, childcare and school | Percentage of students in a middle school to be bullied Percentage of students in a high school to dropout Percentage of students in a high school to cheat on an exam Number of times for a parent to punish child in a month Percentage of students in a high school to drink underage Number of extracurricular activities a student participates in a school year Number of complaints received about school bus behavior in a year Percentage of students failing a subject in a school year Percentage of high school students participating in sports Number of hours students spend on homework in middle school Number of parent-teacher meetings a parent attends in a school year Number of conflicts between parents and school staff in a year Number of field trips students attend per school year Number of fire or safety incidents reported at school in a year Number of hours a child uses digital devices for learning purposes in a day Percentage of students in a middle school using a school library daily Number of science fair projects a student completes in a school year Percentage of high school students involved in a student government Number of times a student is late to school in a month Percentage of students completing advanced placement courses in high school Number of school assemblies a student attends in a year Percentage of students volunteering for community service through school programs Percentage of students in elementary school walking to school Percentage of students with perfect attendance records in a school year Number of art projects completed by a student in a school year. |
| Urban social statistics | Number of graffiti incidents reported in a city in a month Percentage of people in a city who jaywalk in a week Number of noise complaints filed in a neighborhood in a month Percentage of city residents who use public transportation daily Number of times residents participate in community clean-up events in a year Percentage of people in a city who participate in local elections Number of public disturbances reported in a city in a month Percentage of residents involved in neighborhood disputes in a year Number of times a person uses a car-sharing service in a month Percentage of residents who recycle regularly in a city Number of stray animals reported in urban areas in a month Percentage of city residents who volunteer for social services in a year Number of times to litter in public spaces in a month Percentage of residents living below the poverty line in a city Number of public intoxication arrests in a city in a year Number of parking tickets to receive in a year Number of times to swear in a day Number of times to honk at other drivers in a week Percentage of people in any city to drive drunk Percentage of adults in any city to smoke Number of times to report a lost or found item in a city in a year Percentage of residents who use bikes as their primary mode of transportation in a city Number of illegal parking incidents reported in a city in a month Percentage of people using ride-sharing apps in urban areas on a daily basis Number of times residents complain about public transport delays in a month Percentage of urban residents owning pets. |
| Health and fitness | Number of sugary drinks to consume in a week Number of hours to spend exercising in a week Number of calories to consume in a day Number of miles to walk in a week Number of servings of carbohydrates to consume in a day Number of hours to sleep in a night Number of desserts to consume in a week Number of cups of coffee to drink in a day Number of times to visit a doctor for routine check-ups in a year Number of minutes to spend meditating in a day Number of days per week to engage in strength training exercises Number of servings of protein to consume in a day Number of glasses of water to drink in a day Number of fast food meals to consume in a week Number of times to use a standing desk instead of sitting in a week Number of hours of screen time in a day Number of steps to take in a day Number of alcoholic beverages to consume in a week Number of times to apply sunscreen before going outdoors in a week Number of minutes to spend stretching in a day Number of servings of leafy greens to consume in a day Number of minutes to spend in direct sunlight in a day Number of health apps to used for tracking fitness or diet Number of weight measurements to take in a month Number of times to consult a nutritionist or dietitian in a year Number of dental check-ups to schedule in a year. |
| Social media and internet usage | Number of times to call parents in a month Number of minutes to spend on social media in a day Number of text messages to send in a day Number of times to check emails in a day Number of times to post on social media platforms in a week Number of hours to spend watching streaming services in a day Number of online shopping sessions in a month Number of online courses to enroll in per year Number of online games to play in a week Number of times to back up digital data in a month Number of times to clear browsing history and cookies in a month Number of podcasts to listen to in a week Number of new online friends or contacts added in a month Number of apps downloaded in a month Number of times to participate in virtual meetings in a week Number of online petitions signed in a year Number of times to change main online passwords in a year Percentage of daily internet use for educational purposes Times a user changes their main profile photo on social media in a year Number of unique social media platforms visited in a week Number of online accounts deactivated or closed each year Frequency of using private or incognito browsing modes each week Frequency of checking news websites daily Monthly instances of donating to online fundraisers or charity drives Number of ad blockers installed or active on devices each month Frequency of commenting on blogs or online articles each week. |
| Habits, behavior and lifestyle | Number of hours of TV to watch in a day Number of servings of fruits and vegetables to consume in a month Number of lies to tell in a week Number of times to check phone in a day Number of romantic partners to have in a lifetime Number of books to read in a year Percentage of people to lie on a dating website Number of times to lose temper in a week Number of times to clean home in a month Number of times to hit snooze on an alarm clock in a day Number of times to get car washed in a year Number of loads of laundry to do in a week Number of times to visit a museum or cultural event in a year Number of family meals to have per week Number of plants to care for in the home Number of new skills or hobbies to start learning each year Number of social events attended each month Number of health check-ups scheduled annually Number of meals cooked at home each week Number of times to change bed linens in a month Number of days per week dedicated to device-free time Percentage of clothing purchases that are from sustainable brands each year Number of cups of water to drink in a day Number of personal emails to send in a week Number of hours to listen to music in a day Number of journal entries to write in a month. |
| Wealth and Economic habits | Dollars of tax evaded by a person in a year Number of credit cards owned by a person Percentage of income saved annually Number of times a person shops online in a month Amount of money spent on dining out in a month Number of times a person checks their bank account balance in a week Number of loans taken out in a lifetime Dollars spent on impulse purchases in a month Dollars spent for buying electronics in an year Percentage of salary spent on housing Dollars of total saving in a year Number of luxury items purchased in a year Amount of money donated to charity annually Number of times a person reviews their budget in a month Percentage of income spent on entertainment Number of times a person consults a financial advisor in a year Amount of debt carried by a person on average Number of times a person uses a coupon in a month Amount of emergency savings recommended for a person Number of investment accounts owned Percentage of income spent on travel annually Number of times a person revises their will in a lifetime Number of financial seminars or workshops attended in a year Amount of money spent on subscriptions in a month Number of times a person renegotiates their salary in a career Number of times a person invests in stocks in a month. |
| Environmental Sustainability | Number of trees planted by a person in a year Number of times a person uses a reusable shopping bag in a month Amount of water saved by using water-efficient fixtures in a year Number of days a person participates in carpooling in a month Amount of energy saved by using energy-efficient appliances in a year Number of plastic bottles recycled by a person in a month Percentage of household waste composted Number of times a person rides a bicycle instead of driving in a week Amount of food waste reduced by a person in a month Number of times a person participates in community clean-up events in a year Percentage of products purchased that are made from recycled materials Number of times a person uses public transportation in a week Amount of greenhouse gas emissions reduced by using renewable energy sources in a year Percentage of clothing purchased that is second-hand or sustainably made Number of times a person participates in environmental advocacy or activism in a year Number of times a person chooses eco-friendly packaging options in a month Percentage of cleaning products used that are eco-friendly Number of times a person opts for plant-based meals in a week Amount of money spent on supporting environmental causes in a year Number of times a person uses single-use plastic in a week Amount of food waste thrown away in a month Number of times a person leaves lights on in empty rooms in a day Number of disposable coffee cups used in a month Amount of water wasted by leaving taps running in a month Amount of fuel wasted by idling a car in a week Number of times a person fails to separate recyclables from regular trash in a month. |
| Politics and international relationships | Number of international conflicts in a year Number of treaties or agreements signed by a country in a year Number of times a person votes in national elections in a lifetime Number of diplomatic visits made by a country’s leaders in a year Percentage of a country’s budget allocated to defense spending Number of international organizations a country is a member of Number of international trade agreements signed in a year Percentage of foreign aid given by a country as a portion of GDP Number of times a person participates in political protests in a year Number of bilateral meetings held between countries in a year Number of sanctions imposed by a country in a year Percentage of citizens who support international cooperation Number of diplomatic embassies a country maintains worldwide Number of refugees accepted by a country in a year Number of international espionage incidents reported in a year Number of military bases a country has abroad Percentage of international agreements ratified by a country’s parliament Number of international cultural exchange programs sponsored in a year Number of cyberattacks attributed to foreign governments in a year Number of international humanitarian missions a country participates in a year Number of trade disputes resolved through international arbitration in a year Number of international human rights organizations criticizing a country’s policies in a year Number of times a country is accused of violating international law in a year Number of military conflicts a country initiates in a year Number of times a country faces international boycotts due to its policies in a year Percentage of the population living under undemocratic regimes. |
| Technology and Innovation | Number of smartphone models that sold more than 10,000 pieces in a year Average number of hours people spend on social media per day Number of new technology products introduced to the market in a year Average age at which people purchase their first smartphone Percentage of households with smart home devices Average number of apps installed on a smartphone Number of electric vehicles sold in a country in a year Average number of hours people spend on online gaming per week Percentage of households with high-speed internet access Number of people using wearable fitness trackers in a country Average lifespan of a smartphone before being replaced Percentage of people using online banking services Number of streaming service subscriptions per household Average number of data breaches affecting consumers per year Percentage of consumers using mobile payment systems Average number of times people upgrade their tech devices in a year Number of people using telemedicine services in a country per year Percentage of market share held by electric vehicles Average amount of money spent by consumers on new technology annually Number of electric vehicle charging stations installed in a country per year Average number of hours people spend on virtual reality per week Percentage of consumers purchasing technology products online Number of broadband internet subscribers in a country Average number of new apps downloaded per person per year Number of households using renewable energy technology. |
| Pet Care and Ownership | Number of animals rescued and adopted in a year Average number of pets owned per household Amount of money spent on pet food annually Number of veterinary visits per pet per year Percentage of households with at least one pet Number of pet grooming sessions per year Amount of money spent on pet healthcare annually Number of pet-related products purchased per month Percentage of pets that are spayed or neutered Average lifespan of different pet species Number of times a pet is walked per day Amount of money spent on pet toys annually Number of pet-friendly parks or areas in a city Percentage of pets with microchips Number of pet training sessions attended per year Amount of money spent on pet insurance annually Number of pets abandoned or surrendered per year Percentage of pet owners who travel with their pets Number of pet-related accidents or injuries per year Average cost of pet adoption fees Percentage of households with multiple pets Number of pet-related events or expos attended per year Amount of money spent on pet boarding or daycare annually Number of pet adoptions from shelters versus breeders Percentage of pet owners who feed their pets homemade food. |
| Travel, Tourism and Hospitality | Number of countries visited by a person in their lifetime Average number of vacations taken per year Percentage of vacations that are international trips Number of cultural or heritage sites visited per year Average amount of money spent on travel annually in dollars Number of luxury cruises taken in a lifetime Percentage of travel done for leisure versus business Number of times a person stays at eco-friendly accommodations per year Average duration of an international trip in days Number of languages a person learns basic phrases of for travel Number of travel blogs or reviews written by a person in a lifetime Number of adventure or extreme sports tried while traveling Average number of travel souvenirs collected per trip Percentage of travel plans made spontaneously versus planned in advance Number of times a person travels with family per year Number of times a person visits the same destination multiple times Number of travel cancellations or delays experienced in a year Amount of money lost due to travel scams or fraud in a lifetime Number of times a person experiences food poisoning while traveling Number of travel insurance claims filed in a year Percentage of vacations that end with dissatisfaction or complaints Number of countries visited where a person experiences significant cultural differences Number of travel destinations visited due to trending social media recommendations Number of times a person misses a flight or train in a lifetime Amount of money spent on unexpected travel expenses annually Number of positive travel reviews written in a year. |
| 类别 | 概念 |
|---|---|
| 教育、儿童看护与学校 | Percentage of students in a middle school to be bullied Percentage of students in a high school to dropout Percentage of students in a high school to cheat on an exam Number of times for a parent to punish child in a month Percentage of students in a high school to drink underage Number of extracurricular activities a student participates in a school year Number of complaints received about school bus behavior in a year Percentage of students failing a subject in a school year Percentage of high school students participating in sports Number of hours students spend on homework in middle school Number of parent-teacher meetings a parent attends in a school year Number of conflicts between parents and school staff in a year Number of field trips students attend per school year Number of fire or safety incidents reported at school in a year Number of hours a child uses digital devices for learning purposes in a day Percentage of students in a middle school using a school library daily Number of science fair projects a student completes in a school year Percentage of high school students involved in a student government Number of times a student is late to school in a month Percentage of students completing advanced placement courses in high school Number of school assemblies a student attends in a year Percentage of students volunteering for community service through school programs Percentage of students in elementary school walking to school Percentage of students with perfect attendance records in a school year Number of art projects completed by a student in a school year. |
| 城市社会统计 | Number of graffiti incidents reported in a city in a month Percentage of people in a city who jaywalk in a week Number of noise complaints filed in a neighborhood in a month Percentage of city residents who use public transportation daily Number of times residents participate in community clean-up events in a year Percentage of people in a city who participate in local elections Number of public disturbances reported in a city in a month Percentage of residents involved in neighborhood disputes in a year Number of times a person uses a car-sharing service in a month Percentage of residents who recycle regularly in a city Number of stray animals reported in urban areas in a month Percentage of city residents who volunteer for social services in a year Number of times to litter in public spaces in a month Percentage of residents living below the poverty line in a city Number of public intoxication arrests in a city in a year Number of parking tickets to receive in a year Number of times to swear in a day Number of times to honk at other drivers in a week Percentage of people in any city to drive drunk Percentage of adults in any city to smoke Number of times to report a lost or found item in a city in a year Percentage of residents who use bikes as their primary mode of transportation in a city Number of illegal parking incidents reported in a city in a month Percentage of people using ride-sharing apps in urban areas on a daily basis Number of times residents complain about public transport delays in a month Percentage of urban residents owning pets. |
| 健康与健身 | Number of sugary drinks to consume in a week Number of hours to spend exercising in a week Number of calories to consume in a day Number of miles to walk in a week Number of servings of carbohydrates to consume in a day Number of hours to sleep in a night Number of desserts to consume in a week Number of cups of coffee to drink in a day Number of times to visit a doctor for routine check-ups in a year Number of minutes to spend meditating in a day Number of days per week to engage in strength training exercises Number of servings of protein to consume in a day Number of glasses of water to drink in a day Number of fast food meals to consume in a week Number of times to use a standing desk instead of sitting in a week Number of hours of screen time in a day Number of steps to take in a day Number of alcoholic beverages to consume in a week Number of times to apply sunscreen before going outdoors in a week Number of minutes to spend stretching in a day Number of servings of leafy greens to consume in a day Number of minutes to spend in direct sunlight in a day Number of health apps to used for tracking fitness or diet Number of weight measurements to take in a month Number of times to consult a nutritionist or dietitian in a year Number of dental check-ups to schedule in a year. |
| 社交媒体与互联网使用 | Number of times to call parents in a month Number of minutes to spend on social media in a day Number of text messages to send in a day Number of times to check emails in a day Number of times to post on social media platforms in a week Number of hours to spend watching streaming services in a day Number of online shopping sessions in a month Number of online courses to enroll in per year Number of online games to play in a week Number of times to back up digital data in a month Number of times to clear browsing history and cookies in a month Number of podcasts to listen to in a week Number of new online friends or contacts added in a month Number of apps downloaded in a month Number of times to participate in virtual meetings in a week Number of online petitions signed in a year Number of times to change main online passwords in a year Percentage of daily internet use for educational purposes Times a user changes their main profile photo on social media in a year Number of unique social media platforms visited in a week Number of online accounts deactivated or closed each year Frequency of using private or incognito browsing modes each week Frequency of checking news websites daily Monthly instances of donating to online fundraisers or charity drives Number of ad blockers installed or active on devices each month Frequency of commenting on blogs or online articles each week. |
| 习惯、行为与生活方式 | Number of hours of TV to watch in a day Number of servings of fruits and vegetables to consume in a month Number of lies to tell in a week Number of times to check phone in a day Number of romantic partners to have in a lifetime Number of books to read in a year Percentage of people to lie on a dating website Number of times to lose temper in a week Number of times to clean home in a month Number of times to hit snooze on an alarm clock in a day Number of times to get car washed in a year Number of loads of laundry to do in a week Number of times to visit a museum or cultural event in a year Number of family meals to have per week Number of plants to care for in the home Number of new skills or hobbies to start learning each year Number of social events attended each month Number of health check-ups scheduled annually Number of meals cooked at home each week Number of times to change bed linens in a month Number of days per week dedicated to device-free time Percentage of clothing purchases that are from sustainable brands each year Number of cups of water to drink in a day Number of personal emails to send in a week Number of hours to listen to music in a day Number of journal entries to write in a month. |
| 财富与经济习惯 | Dollars of tax evaded by a person in a year Number of credit cards owned by a person Percentage of income saved annually Number of times a person shops online in a month Amount of money spent on dining out in a month Number of times a person checks their bank account balance in a week Number of loans taken out in a lifetime Dollars spent on impulse purchases in a month Dollars spent for buying electronics in an year Percentage of salary spent on housing Dollars of total saving in a year Number of luxury items purchased in a year Amount of money donated to charity annually Number of times a person reviews their budget in a month Percentage of income spent on entertainment Number of times a person consults a financial advisor in a year Amount of debt carried by a person on average Number of times a person uses a coupon in a month Amount of emergency savings recommended for a person Number of investment accounts owned Percentage of income spent on travel annually Number of times a person revises their will in a lifetime Number of financial seminars or workshops attended in a year Amount of money spent on subscriptions in a month Number of times a person renegotiates their salary in a career Number of times a person invests in stocks in a month. |
| 环境可持续性 | Number of trees planted by a person in a year Number of times a person uses a reusable shopping bag in a month Amount of water saved by using water-efficient fixtures in a year Number of days a person participates in carpooling in a month Amount of energy saved by using energy-efficient appliances in a year Number of plastic bottles recycled by a person in a month Percentage of household waste composted Number of times a person rides a bicycle instead of driving in a week Amount of food waste reduced by a person in a month Number of times a person participates in community clean-up events in a year Percentage of products purchased that are made from recycled materials Number of times a person uses public transportation in a week Amount of greenhouse gas emissions reduced by using renewable energy sources in a year Percentage of clothing purchased that is second-hand or sustainably made Number of times a person participates in environmental advocacy or activism in a year Number of times a person chooses eco-friendly packaging options in a month Percentage of cleaning products used that are eco-friendly Number of times a person opts for plant-based meals in a week Amount of money spent on supporting environmental causes in a year Number of times a person uses single-use plastic in a week Amount of food waste thrown away in a month Number of times a person leaves lights on in empty rooms in a day Number of disposable coffee cups used in a month Amount of water wasted by leaving taps running in a month Amount of fuel wasted by idling a car in a week Number of times a person fails to separate recyclables from regular trash in a month. |
| 政治与国际关系 | Number of international conflicts in a year Number of treaties or agreements signed by a country in a year Number of times a person votes in national elections in a lifetime Number of diplomatic visits made by a country’s leaders in a year Percentage of a country’s budget allocated to defense spending Number of international organizations a country is a member of Number of international trade agreements signed in a year Percentage of foreign aid given by a country as a portion of GDP Number of times a person participates in political protests in a year Number of bilateral meetings held between countries in a year Number of sanctions imposed by a country in a year Percentage of citizens who support international cooperation Number of diplomatic embassies a country maintains worldwide Number of refugees accepted by a country in a year Number of international espionage incidents reported in a year Number of military bases a country has abroad Percentage of international agreements ratified by a country’s parliament Number of international cultural exchange programs sponsored in a year Number of cyberattacks attributed to foreign governments in a year Number of international humanitarian missions a country participates in a year Number of trade disputes resolved through international arbitration in a year Number of international human rights organizations criticizing a country’s policies in a year Number of times a country is accused of violating international law in a year Number of military conflicts a country initiates in a year Number of times a country faces international boycotts due to its policies in a year Percentage of the population living under undemocratic regimes. |
| 技术与创新 | Number of smartphone models that sold more than 10,000 pieces in a year Average number of hours people spend on social media per day Number of new technology products introduced to the market in a year Average age at which people purchase their first smartphone Percentage of households with smart home devices Average number of apps installed on a smartphone Number of electric vehicles sold in a country in a year Average number of hours people spend on online gaming per week Percentage of households with high-speed internet access Number of people using wearable fitness trackers in a country Average lifespan of a smartphone before being replaced Percentage of people using online banking services Number of streaming service subscriptions per household Average number of data breaches affecting consumers per year Percentage of consumers using mobile payment systems Average number of times people upgrade their tech devices in a year Number of people using telemedicine services in a country per year Percentage of market share held by electric vehicles Average amount of money spent by consumers on new technology annually Number of electric vehicle charging stations installed in a country per year Average number of hours people spend on virtual reality per week Percentage of consumers purchasing technology products online Number of broadband internet subscribers in a country Average number of new apps downloaded per person per year Number of households using renewable energy technology. |
| 宠物照料与饲养 | Number of animals rescued and adopted in a year Average number of pets owned per household Amount of money spent on pet food annually Number of veterinary visits per pet per year Percentage of households with at least one pet Number of pet grooming sessions per year Amount of money spent on pet healthcare annually Number of pet-related products purchased per month Percentage of pets that are spayed or neutered Average lifespan of different pet species Number of times a pet is walked per day Amount of money spent on pet toys annually Number of pet-friendly parks or areas in a city Percentage of pets with microchips Number of pet training sessions attended per year Amount of money spent on pet insurance annually Number of pets abandoned or surrendered per year Percentage of pet owners who travel with their pets Number of pet-related accidents or injuries per year Average cost of pet adoption fees Percentage of households with multiple pets Number of pet-related events or expos attended per year Amount of money spent on pet boarding or daycare annually Number of pet adoptions from shelters versus breeders Percentage of pet owners who feed their pets homemade food. |
| 旅行、旅游与接待 | Number of countries visited by a person in their lifetime Average number of vacations taken per year Percentage of vacations that are international trips Number of cultural or heritage sites visited per year Average amount of money spent on travel annually in dollars Number of luxury cruises taken in a lifetime Percentage of travel done for leisure versus business Number of times a person stays at eco-friendly accommodations per year Average duration of an international trip in days Number of languages a person learns basic phrases of for travel Number of travel blogs or reviews written by a person in a lifetime Number of adventure or extreme sports tried while traveling Average number of travel souvenirs collected per trip Percentage of travel plans made spontaneously versus planned in advance Number of times a person travels with family per year Number of times a person visits the same destination multiple times Number of travel cancellations or delays experienced in a year Amount of money lost due to travel scams or fraud in a lifetime Number of times a person experiences food poisoning while traveling Number of travel insurance claims filed in a year Percentage of vacations that end with dissatisfaction or complaints Number of countries visited where a person experiences significant cultural differences Number of travel destinations visited due to trending social media recommendations Number of times a person misses a flight or train in a lifetime Amount of money spent on unexpected travel expenses annually Number of positive travel reviews written in a year. |