Rich Feature Hierarchies for Accurate Object Detection and Semantic Segmentation
Rich feature hierarchies for accurate object detection and semantic segmentation Tech report (v5)
面向精确目标检测与语义分割的丰富特征层次 技术报告(第 5 版)
Ross Girshick Jeff Donahue Trevor Darrell Jitendra Malik Affiliation: UC Berkeley Email: {rbg,jdonahue,trevor,malik}@eecs.berkeley.edu
Abstract
摘要
Object detection performance, as measured on the canonical PASCAL VOC dataset, has plateaued in the last few years. The best-performing methods are complex ensemble systems that typically combine multiple low-level image features with high-level context. In this paper, we propose a simple and scalable detection algorithm that improves mean average precision (mAP) by more than 30% relative to the previous best result on VOC 2012—achieving a mAP of 53.3%. Our approach combines two key insights: (1) one can apply high-capacity convolutional neural networks (CNNs) to bottom-up region proposals in order to localize and segment objects and (2) when labeled training data is scarce, supervised pre-training for an auxiliary task, followed by domain-specific fine-tuning, yields a significant performance boost. Since we combine region proposals with CNNs, we call our method R-CNN: Regions with CNN features. We also compare R-CNN to OverFeat, a recently proposed sliding-window detector based on a similar CNN architecture. We find that R-CNN outperforms OverFeat by a large margin on the 200-class ILSVRC2013 detection dataset. Source code for the complete system is available at http://www.cs.berkeley.edu/~rbg/rcnn.
以经典的 PASCAL VOC 数据集衡量,目标检测性能在过去几年里已经进入平台期。表现最好的方法是复杂的集成系统,通常把多种底层图像特征和高层上下文拼在一起。本文提出一种简单、可扩展的检测算法,在 VOC 2012 上把平均精度均值(mAP)相对此前最佳结果提高了三成以上,达到 53.3%。我们的方法结合了两点关键认识:(1)可以把容量很大的卷积网络(CNN)用在自底向上的区域提议上,从而定位并分割物体;(2)当带标注的训练数据很少时,先为一项辅助任务做有监督预训练,再做面向特定域的微调,能带来明显提升。因为我们把区域提议和 CNN 结合在一起,把这种方法叫做 R-CNN: Regions with CNN features(带 CNN 特征的区域)。我们还把 R-CNN 与最近提出的、基于相近 CNN 结构的滑动窗口检测器 OverFeat 做了比较。在 200 类的 ILSVRC2013 检测数据集上,R-CNN 以较大优势超过 OverFeat。完整系统的源代码见 http://www.cs.berkeley.edu/~rbg/rcnn。
1 Introduction
1 引言
Features matter. The last decade of progress on various visual recognition tasks has been based considerably on the use of SIFT [29] and HOG [7]. But if we look at performance on the canonical visual recognition task, PASCAL VOC object detection [15], it is generally acknowledged that progress has been slow during 2010-2012, with small gains obtained by building ensemble systems and employing minor variants of successful methods.
特征很重要。过去十年里,各类视觉识别任务的进展在很大程度上建立在 SIFT [29] 和 HOG [7] 之上。可是如果我们去看那个经典的视觉识别任务——PASCAL VOC 目标检测 [15],大家普遍承认,2010 到 2012 年的进步很慢,拿到的只是靠搭集成系统、以及在已有成功方法上做些小改动带来的一点提升。
SIFT and HOG are blockwise orientation histograms, a representation we could associate roughly with complex cells in V1, the first cortical area in the primate visual pathway. But we also know that recognition occurs several stages downstream, which suggests that there might be hierarchical, multi-stage processes for computing features that are even more informative for visual recognition.
SIFT 和 HOG 是分块的方向直方图,这种表示大致可以对应到灵长类视觉通路中第一皮层区 V1 里的复杂细胞。可我们同样知道,识别发生在更靠后的若干阶段,这就提示:也许还存在分层次、多阶段的特征计算过程,能得到对视觉识别更有用的特征。
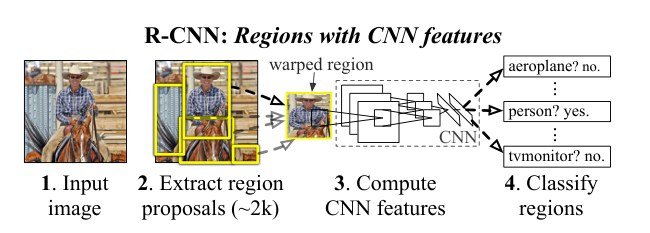
Figure 1: Object detection system overview. Our system (1) takes an input image, (2) extracts around 2000 bottom-up region proposals, (3) computes features for each proposal using a large convolutional neural network (CNN), and then (4) classifies each region using class-specific linear SVMs. R-CNN achieves a mean average precision (mAP) of 53.7% on PASCAL VOC 2010. For comparison, [39] reports 35.1% mAP using the same region proposals, but with a spatial pyramid and bag-of-visual-words approach. The popular deformable part models perform at 33.4%. On the 200-class ILSVRC2013 detection dataset, R-CNN’s mAP is 31.4%, a large improvement over OverFeat [34], which had the previous best result at 24.3%.
图 1:目标检测系统概览。我们的系统(1)接收一张输入图像,(2)提取大约 2000 个自底向上的区域提议,(3)用一个大型卷积网络(CNN)为每个提议计算特征,然后(4)用类别专用的线性 SVM 对每个区域分类。R-CNN 在 PASCAL VOC 2010 上达到 53.7% 的平均精度均值(mAP)。作为对照,[39] 使用同样的区域提议,但采用空间金字塔和视觉词袋,报告的 mAP 为 35.1%。流行的可变形部件模型为 33.4%。在 200 类的 ILSVRC2013 检测数据集上,R-CNN 的 mAP 为 31.4%,明显超过此前最好的 OverFeat [34](24.3%)。
Fukushima’s “neocognitron” [19], a biologically-inspired hierarchical and shift-invariant model for pattern recognition, was an early attempt at just such a process. The neocognitron, however, lacked a supervised training algorithm. Building on Rumelhart et al. [33], LeCun et al. [26] showed that stochastic gradient descent via backpropagation was effective for training convolutional neural networks (CNNs), a class of models that extend the neocognitron.
Fukushima 的“神经认知机”(neocognitron)[19] 是一种受生物启发的、分层且具有平移不变性的模式识别模型,正是对上述过程的一次早期尝试。不过神经认知机缺少有监督的训练算法。在 Rumelhart 等人 [33] 的工作之上,LeCun 等人 [26] 表明,用反向传播做随机梯度下降,可以有效训练卷积网络(CNN)——这是一类把神经认知机加以扩展的模型。
CNNs saw heavy use in the 1990s (e.g., [27]), but then fell out of fashion with the rise of support vector machines. In 2012, Krizhevsky et al. [25] rekindled interest in CNNs by showing substantially higher image classification accuracy on the ImageNet Large Scale Visual Recognition Challenge (ILSVRC) [9, 10]. Their success resulted from training a large CNN on 1.2 million labeled images, together with a few twists on LeCun’s CNN (e.g., rectifying non-linearities and “dropout” regularization).
CNN 在 1990 年代用得很广(例如 [27]),但随着支持向量机兴起,就逐渐不再流行。2012 年,Krizhevsky 等人 [25] 在 ImageNet 大规模视觉识别挑战赛(ILSVRC)[9, 10] 上展示了明显更高的图像分类精度,重新点燃了对 CNN 的兴趣。他们的成功来自在 120 万张带标注图像上训练一个大型 CNN,并在 LeCun 的 CNN 上做了几处改动(例如 整流非线性,以及“dropout”正则)。
The significance of the ImageNet result was vigorously debated during the ILSVRC 2012 workshop. The central issue can be distilled to the following: To what extent do the CNN classification results on ImageNet generalize to object detection results on the PASCAL VOC Challenge?
ImageNet 这一结果的意义,在 ILSVRC 2012 研讨会上引起了激烈争论。核心问题可以浓缩成一句:CNN 在 ImageNet 上的分类结果,能在多大程度上推广到 PASCAL VOC 挑战赛上的目标检测?
We answer this question by bridging the gap between image classification and object detection. This paper is the first to show that a CNN can lead to dramatically higher object detection performance on PASCAL VOC as compared to systems based on simpler HOG-like features. To achieve this result, we focused on two problems: localizing objects with a deep network and training a high-capacity model with only a small quantity of annotated detection data.
我们通过弥合图像分类和目标检测之间的差距来回答这个问题。本文首次表明,与基于更简单的 HOG 类特征的系统相比,CNN 可以在 PASCAL VOC 上带来大幅度更高的目标检测性能。为了得到这一结果,我们着重处理了两个问题:用深度网络定位物体,以及在只有少量带标注检测数据的情况下训练高容量模型。
Unlike image classification, detection requires localizing (likely many) objects within an image. One approach frames localization as a regression problem. However, work from Szegedy et al. [38], concurrent with our own, indicates that this strategy may not fare well in practice (they report a mAP of 30.5% on VOC 2007 compared to the 58.5% achieved by our method). An alternative is to build a sliding-window detector. CNNs have been used in this way for at least two decades, typically on constrained object categories, such as faces [32, 40] and pedestrians [35]. In order to maintain high spatial resolution, these CNNs typically only have two convolutional and pooling layers. We also considered adopting a sliding-window approach. However, units high up in our network, which has five convolutional layers, have very large receptive fields ( pixels) and strides ( pixels) in the input image, which makes precise localization within the sliding-window paradigm an open technical challenge.
与图像分类不同,检测需要在图像里定位(很可能是多个)物体。一种做法是把定位写成回归问题。不过与我们同期的 Szegedy 等人 [38] 的工作表明,这条策略在实践中可能并不理想(他们在 VOC 2007 上报告的 mAP 为 30.5%,而我们的方法达到 58.5%)。另一种做法是做滑动窗口检测器。CNN 以这种方式使用至少已有二十年,通常面向人脸 [32, 40] 和行人 [35] 这类受限的物体类别。为了保持较高的空间分辨率,这些 CNN 往往只有两层卷积和池化。我们也考虑过采用滑动窗口。然而,我们这个有五层卷积的网络里,靠上的单元在输入图像上有非常大的感受野( 像素)和步幅( 像素),这使得在滑动窗口范式里做精确的定位仍然是一个开放的技术难题。
Instead, we solve the CNN localization problem by operating within the “recognition using regions” paradigm [21], which has been successful for both object detection [39] and semantic segmentation [5]. At test time, our method generates around 2000 category-independent region proposals for the input image, extracts a fixed-length feature vector from each proposal using a CNN, and then classifies each region with category-specific linear SVMs. We use a simple technique (affine image warping) to compute a fixed-size CNN input from each region proposal, regardless of the region’s shape. Figure 1 presents an overview of our method and highlights some of our results. Since our system combines region proposals with CNNs, we dub the method R-CNN: Regions with CNN features.
于是,我们改在“用区域来识别”这一范式 [21] 里解决 CNN 的定位问题,该范式在目标检测 [39] 和语义分割 [5] 上都已取得成功。测试时,我们的方法为输入图像生成大约 2000 个与类别无关的区域提议,用 CNN 从每个提议提取一个固定长度的特征向量,再用类别专用的线性 SVM 对每个区域分类。我们用一种简单的技术(仿射图像扭曲)从每个区域提议算出固定尺寸的 CNN 输入,而不论该区域是什么形状。图 1 给出了方法概览,并标出了若干结果。因为系统把区域提议和 CNN 结合在一起,我们把它叫做 R-CNN:Regions with CNN features。
In this updated version of this paper, we provide a head-to-head comparison of R-CNN and the recently proposed OverFeat [34] detection system by running R-CNN on the 200-class ILSVRC2013 detection dataset. OverFeat uses a sliding-window CNN for detection and until now was the best performing method on ILSVRC2013 detection. We show that R-CNN significantly outperforms OverFeat, with a mAP of 31.4% versus 24.3%.
在本版更新中,我们把 R-CNN 放到 200 类的 ILSVRC2013 检测数据集上运行,与最近提出的 OverFeat [34] 检测系统做了直接对比。OverFeat 用滑动窗口 CNN 做检测,在此之前是 ILSVRC2013 检测上表现最好的方法。我们表明 R-CNN 明显超过 OverFeat,mAP 为 31.4%,对 24.3%。
A second challenge faced in detection is that labeled data is scarce and the amount currently available is insufficient for training a large CNN. The conventional solution to this problem is to use unsupervised pre-training, followed by supervised fine-tuning (e.g., [35]). The second principle contribution of this paper is to show that supervised pre-training on a large auxiliary dataset (ILSVRC), followed by domain-specific fine-tuning on a small dataset (PASCAL), is an effective paradigm for learning high-capacity CNNs when data is scarce. In our experiments, fine-tuning for detection improves mAP performance by 8 percentage points. After fine-tuning, our system achieves a mAP of 54% on VOC 2010 compared to 33% for the highly-tuned, HOG-based deformable part model (DPM) [17, 20]. We also point readers to contemporaneous work by Donahue et al. [12], who show that Krizhevsky’s CNN can be used (without fine-tuning) as a blackbox feature extractor, yielding excellent performance on several recognition tasks including scene classification, fine-grained sub-categorization, and domain adaptation.
检测面临的第二个困难是,带标注的数据很少,现有数量不足以训练一个大型 CNN。这个问题的常规解法是先做无监督预训练,再做有监督微调(例如 [35])。本文的第二项原则性贡献是表明:在一个大规模辅助数据集(ILSVRC)上做有监督预训练,再在一个小数据集(PASCAL)上做面向特定域的微调,是在数据稀缺时学习高容量 CNN 的有效范式。实验里,面向检测的微调把 mAP 提高了 8 个百分点。微调之后,我们的系统在 VOC 2010 上达到 54% 的 mAP,而精心调过的、基于 HOG 的可变形部件模型(DPM)[17, 20] 为 33%。我们也请读者参看 Donahue 等人 [12] 同期的工作,他们表明 Krizhevsky 的 CNN 可以(不必微调)当作黑盒特征提取器使用,在场景分类、细粒度子类划分和域适应等多项识别任务上都能得到出色的表现。
Our system is also quite efficient. The only class-specific computations are a reasonably small matrix-vector product and greedy non-maximum suppression. This computational property follows from features that are shared across all categories and that are also two orders of magnitude lower-dimensional than previously used region features (cf. [39]).
我们的系统也相当高效。唯一与类别相关的计算,是规模不大的矩阵–向量乘积,以及贪心的非极大值抑制。这一计算性质来自在所有类别之间共享的特征,而且这些特征的维数比此前使用的区域特征低两个数量级(参见 [39])。
Understanding the failure modes of our approach is also critical for improving it, and so we report results from the detection analysis tool of Hoiem et al. [23]. As an immediate consequence of this analysis, we demonstrate that a simple bounding-box regression method significantly reduces mislocalizations, which are the dominant error mode.
弄清方法的失败模式,对继续改进同样关键,因此我们报告了 Hoiem 等人 [23] 的检测分析工具给出的结果。作为这一分析的直接后果,我们表明一种简单的边界框回归方法能显著减少定位错误,而定位错误正是主要的错误模式。
Before developing technical details, we note that because R-CNN operates on regions it is natural to extend it to the task of semantic segmentation. With minor modifications, we also achieve competitive results on the PASCAL VOC segmentation task, with an average segmentation accuracy of 47.9% on the VOC 2011 test set.
在展开技术细节之前,我们指出:因为 R-CNN 在区域上工作,把它扩展到语义分割是很自然的。只需少量修改,我们在 PASCAL VOC 分割任务上也取得了有竞争力的结果,在 VOC 2011 测试集上的平均分割精度为 47.9%。
2 Object detection with R-CNN
2 用 R-CNN 做目标检测
Our object detection system consists of three modules. The first generates category-independent region proposals. These proposals define the set of candidate detections available to our detector. The second module is a large convolutional neural network that extracts a fixed-length feature vector from each region. The third module is a set of class-specific linear SVMs. In this section, we present our design decisions for each module, describe their test-time usage, detail how their parameters are learned, and show detection results on PASCAL VOC 2010-12 and on ILSVRC2013.
我们的目标检测系统由三个模块组成。第一个模块生成与类别无关的区域提议。这些提议定义了检测器可以使用的候选检测集合。第二个模块是一个大型卷积网络,从每个区域提取固定长度的特征向量。第三个模块是一组类别专用的线性 SVM。在这一节里,我们给出每个模块的设计选择,说明测试时如何使用它们,详细介绍参数如何学习,并展示在 PASCAL VOC 2010-12 以及 ILSVRC2013 上的检测结果。
2.1 Module design
2.1 模块设计
Region proposals.
A variety of recent papers offer methods for generating category-independent region proposals. Examples include: objectness [1], selective search [39], category-independent object proposals [14], constrained parametric min-cuts (CPMC) [5], multi-scale combinatorial grouping [3], and Cireşan et al. [6], who detect mitotic cells by applying a CNN to regularly-spaced square crops, which are a special case of region proposals. While R-CNN is agnostic to the particular region proposal method, we use selective search to enable a controlled comparison with prior detection work (e.g., [39, 41]).
区域提议。
最近有不少论文提出了生成与类别无关的区域提议的方法。例子包括:objectness [1]、选择性搜索 [39]、与类别无关的物体提议 [14]、受约束的参数化最小割(CPMC)[5]、多尺度组合分组 [3],以及 Cireşan 等人 [6]——他们把 CNN 用在规则间隔的方形裁块上检测有丝分裂细胞,而这些裁块可以看成区域提议的一种特例。R-CNN 并不绑定某一种区域提议方法,但为了能与先前的检测工作做受控比较(例如 [39, 41]),我们使用选择性搜索。
Feature extraction.
We extract a 4096-dimensional feature vector from each region proposal using the Caffe [24] implementation of the CNN described by Krizhevsky et al. [25]. Features are computed by forward propagating a mean-subtracted RGB image through five convolutional layers and two fully connected layers. We refer readers to [24, 25] for more network architecture details.
特征提取。
我们用 Caffe [24] 实现的、Krizhevsky 等人 [25] 所描述的 CNN,从每个区域提议提取一个 4096 维特征向量。特征的计算方式是:把减去均值后的 RGB 图像向前传播,经过五层卷积和两层全连接。更多网络结构细节请见 [24, 25]。
In order to compute features for a region proposal, we must first convert the image data in that region into a form that is compatible with the CNN (its architecture requires inputs of a fixed pixel size). Of the many possible transformations of our arbitrary-shaped regions, we opt for the simplest. Regardless of the size or aspect ratio of the candidate region, we warp all pixels in a tight bounding box around it to the required size. Prior to warping, we dilate the tight bounding box so that at the warped size there are exactly pixels of warped image context around the original box (we use ). Figure 2 shows a random sampling of warped training regions. Alternatives to warping are discussed in Appendix A.
要为一个区域提议计算特征,必须先把该区域里的图像数据转换成与 CNN 兼容的形式(其结构要求输入为固定的 像素)。在各种可能的、针对任意形状区域的变换里,我们选了最简单的一种。不论候选区域的大小或宽高比如何,都把紧包围它的边界框里的全部像素扭曲到所需尺寸。扭曲之前,我们先把紧边界框扩大,使得在扭曲后的尺寸上,原框周围恰好有 个像素的扭曲后图像上下文(我们取 )。图 2 给出了一些随机抽样的扭曲训练区域。关于扭曲之外的替代方案,见附录 A。
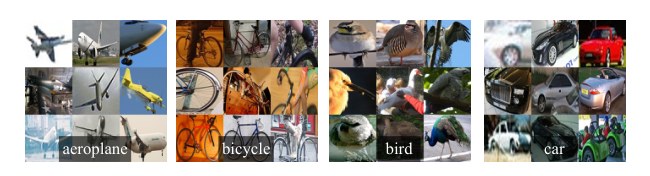
Figure 2: Warped training samples from VOC 2007 train.
图 2:来自 VOC 2007 训练集的扭曲训练样本。
2.2 Test-time detection
2.2 测试时的检测
At test time, we run selective search on the test image to extract around 2000 region proposals (we use selective search’s “fast mode” in all experiments). We warp each proposal and forward propagate it through the CNN in order to compute features. Then, for each class, we score each extracted feature vector using the SVM trained for that class. Given all scored regions in an image, we apply a greedy non-maximum suppression (for each class independently) that rejects a region if it has an intersection-over-union (IoU) overlap with a higher scoring selected region larger than a learned threshold.
测试时,我们在测试图像上运行选择性搜索,提取大约 2000 个区域提议(全部实验都使用选择性搜索的“快速模式”)。把每个提议扭曲后送入 CNN 做前向传播,以计算特征。然后,对每个类别,用该类别训练好的 SVM 给每个提取出的特征向量打分。得到一幅图像里所有打过分的区域后,我们(按类别独立地)做贪心非极大值抑制:若一个区域与某个得分更高的已选区域之间的交并比(IoU)重叠超过一个学到的阈值,就把它丢掉。
Run-time analysis.
Two properties make detection efficient. First, all CNN parameters are shared across all categories. Second, the feature vectors computed by the CNN are low-dimensional when compared to other common approaches, such as spatial pyramids with bag-of-visual-word encodings. The features used in the UVA detection system [39], for example, are two orders of magnitude larger than ours (360k vs. 4k-dimensional).
运行时间分析。
有两个性质使检测变得高效。第一,所有 CNN 参数在全部类别之间共享。第二,与空间金字塔加视觉词袋编码等常见做法相比,CNN 算出的特征向量维数较低。例如,UVA 检测系统 [39] 使用的特征比我们的高出两个数量级(36 万维对 4 千维)。
The result of such sharing is that the time spent computing region proposals and features (13s/image on a GPU or 53s/image on a CPU) is amortized over all classes. The only class-specific computations are dot products between features and SVM weights and non-maximum suppression. In practice, all dot products for an image are batched into a single matrix-matrix product. The feature matrix is typically and the SVM weight matrix is , where is the number of classes.
这种共享的结果是,计算区域提议和特征所花的时间(GPU 上每张图 13 秒,或 CPU 上每张图 53 秒)可以摊到所有类别上。唯一与类别相关的计算,是特征与 SVM 权重之间的点积,以及非极大值抑制。实践中,一张图上的全部点积会批成一次矩阵–矩阵乘积。特征矩阵通常是 ,SVM 权重矩阵是 ,其中 是类别数。
This analysis shows that R-CNN can scale to thousands of object classes without resorting to approximate techniques, such as hashing. Even if there were 100k classes, the resulting matrix multiplication takes only 10 seconds on a modern multi-core CPU. This efficiency is not merely the result of using region proposals and shared features. The UVA system, due to its high-dimensional features, would be two orders of magnitude slower while requiring 134GB of memory just to store 100k linear predictors, compared to just 1.5GB for our lower-dimensional features.
这一分析表明,R-CNN 可以扩展到数千个物体类别,而不必借助哈希之类的近似技术。即便有 10 万个类,所得的矩阵乘法在一台现代多核 CPU 上也只需 10 秒。这种效率并不仅仅来自使用区域提议和共享特征。UVA 系统由于特征维数很高,会慢上两个数量级,而且仅仅为了存储 10 万个线性预测器就需要 134GB 内存,而我们这种较低维的特征只需 1.5GB。
It is also interesting to contrast R-CNN with the recent work from Dean et al. on scalable detection using DPMs and hashing [8]. They report a mAP of around 16% on VOC 2007 at a run-time of 5 minutes per image when introducing 10k distractor classes. With our approach, 10k detectors can run in about a minute on a CPU, and because no approximations are made mAP would remain at 59% (Section 3.2).
把 R-CNN 与 Dean 等人最近用 DPM 和哈希做可扩展检测的工作 [8] 对照,也很有意思。他们在引入 1 万个干扰类别时,报告 VOC 2007 上的 mAP 约为 16%,每张图运行 5 分钟。用我们的方法,1 万个检测器在 CPU 上大约一分钟就能跑完,而且因为没有做近似,mAP 仍会保持在 59%(第 3.2 节)。
2.3 Training
2.3 训练
Supervised pre-training.
We discriminatively pre-trained the CNN on a large auxiliary dataset (ILSVRC2012 classification) using image-level annotations only (bounding-box labels are not available for this data). Pre-training was performed using the open source Caffe CNN library [24]. In brief, our CNN nearly matches the performance of Krizhevsky et al. [25], obtaining a top-1 error rate 2.2 percentage points higher on the ILSVRC2012 classification validation set. This discrepancy is due to simplifications in the training process.
有监督预训练。
我们在一个大规模辅助数据集(ILSVRC2012 分类)上判别式地预训练 CNN,只用到图像级标注(这些数据没有边界框标注)。预训练使用开源的 Caffe CNN 库 [24] 完成。简言之,我们的 CNN 与 Krizhevsky 等人 [25] 的表现几乎相当,在 ILSVRC2012 分类验证集上的 top-1 错误率高出 2.2 个百分点。这一差距来自训练过程中的简化。
Domain-specific fine-tuning.
To adapt our CNN to the new task (detection) and the new domain (warped proposal windows), we continue stochastic gradient descent (SGD) training of the CNN parameters using only warped region proposals. Aside from replacing the CNN’s ImageNet-specific 1000-way classification layer with a randomly initialized ()-way classification layer (where is the number of object classes, plus 1 for background), the CNN architecture is unchanged. For VOC, and for ILSVRC2013, . We treat all region proposals with IoU overlap with a ground-truth box as positives for that box’s class and the rest as negatives. We start SGD at a learning rate of 0.001 (1/10th of the initial pre-training rate), which allows fine-tuning to make progress while not clobbering the initialization. In each SGD iteration, we uniformly sample 32 positive windows (over all classes) and 96 background windows to construct a mini-batch of size 128. We bias the sampling towards positive windows because they are extremely rare compared to background.
面向特定域的微调。
为了让 CNN 适应新的任务(检测)和新的域(扭曲后的提议窗口),我们只用扭曲后的区域提议,继续用随机梯度下降(SGD)训练 CNN 参数。除了把 CNN 原先面向 ImageNet 的 1000 路分类层,换成随机初始化的 路分类层( 是物体类别数,再加 1 类背景)之外,CNN 结构保持不变。对 VOC,;对 ILSVRC2013,。我们把与某个真值框的 IoU 重叠 的所有区域提议,当作该框所属类别的正例,其余当作负例。SGD 从学习率 0.001 开始(是预训练初始学习率的 1/10),这样微调既能推进,又不会把初始化冲掉。在每次 SGD 迭代中,我们均匀采样 32 个正窗口(在所有类别上)和 96 个背景窗口,构成大小为 128 的小批量。我们把采样偏向正窗口,因为它们相对背景极为稀少。
| VOC 2010 test | aero | bike | bird | boat | bottle | bus | car | cat | chair | cow | table | dog | horse | mbike | person | plant | sheep | sofa | train | tv | mAP |
|---|---|---|---|---|---|---|---|---|---|---|---|---|---|---|---|---|---|---|---|---|---|
| DPM v5 [20]† | 49.2 | 53.8 | 13.1 | 15.3 | 35.5 | 53.4 | 49.7 | 27.0 | 17.2 | 28.8 | 14.7 | 17.8 | 46.4 | 51.2 | 47.7 | 10.8 | 34.2 | 20.7 | 43.8 | 38.3 | 33.4 |
| UVA [39] | 56.2 | 42.4 | 15.3 | 12.6 | 21.8 | 49.3 | 36.8 | 46.1 | 12.9 | 32.1 | 30.0 | 36.5 | 43.5 | 52.9 | 32.9 | 15.3 | 41.1 | 31.8 | 47.0 | 44.8 | 35.1 |
| Regionlets [41] | 65.0 | 48.9 | 25.9 | 24.6 | 24.5 | 56.1 | 54.5 | 51.2 | 17.0 | 28.9 | 30.2 | 35.8 | 40.2 | 55.7 | 43.5 | 14.3 | 43.9 | 32.6 | 54.0 | 45.9 | 39.7 |
| SegDPM [18]† | 61.4 | 53.4 | 25.6 | 25.2 | 35.5 | 51.7 | 50.6 | 50.8 | 19.3 | 33.8 | 26.8 | 40.4 | 48.3 | 54.4 | 47.1 | 14.8 | 38.7 | 35.0 | 52.8 | 43.1 | 40.4 |
| R-CNN | 67.1 | 64.1 | 46.7 | 32.0 | 30.5 | 56.4 | 57.2 | 65.9 | 27.0 | 47.3 | 40.9 | 66.6 | 57.8 | 65.9 | 53.6 | 26.7 | 56.5 | 38.1 | 52.8 | 50.2 | 50.2 |
| R-CNN BB | 71.8 | 65.8 | 53.0 | 36.8 | 35.9 | 59.7 | 60.0 | 69.9 | 27.9 | 50.6 | 41.4 | 70.0 | 62.0 | 69.0 | 58.1 | 29.5 | 59.4 | 39.3 | 61.2 | 52.4 | 53.7 |
Table 1: Detection average precision (%) on VOC 2010 test. R-CNN is most directly comparable to UVA and Regionlets since all methods use selective search region proposals. Bounding-box regression (BB) is described in Section C. At publication time, SegDPM was the top-performer on the PASCAL VOC leaderboard. †DPM and SegDPM use context rescoring not used by the other methods.
| VOC 2010 test | aero | bike | bird | boat | bottle | bus | car | cat | chair | cow | table | dog | horse | mbike | person | plant | sheep | sofa | train | tv | mAP |
|---|---|---|---|---|---|---|---|---|---|---|---|---|---|---|---|---|---|---|---|---|---|
| DPM v5 [20]† | 49.2 | 53.8 | 13.1 | 15.3 | 35.5 | 53.4 | 49.7 | 27.0 | 17.2 | 28.8 | 14.7 | 17.8 | 46.4 | 51.2 | 47.7 | 10.8 | 34.2 | 20.7 | 43.8 | 38.3 | 33.4 |
| UVA [39] | 56.2 | 42.4 | 15.3 | 12.6 | 21.8 | 49.3 | 36.8 | 46.1 | 12.9 | 32.1 | 30.0 | 36.5 | 43.5 | 52.9 | 32.9 | 15.3 | 41.1 | 31.8 | 47.0 | 44.8 | 35.1 |
| Regionlets [41] | 65.0 | 48.9 | 25.9 | 24.6 | 24.5 | 56.1 | 54.5 | 51.2 | 17.0 | 28.9 | 30.2 | 35.8 | 40.2 | 55.7 | 43.5 | 14.3 | 43.9 | 32.6 | 54.0 | 45.9 | 39.7 |
| SegDPM [18]† | 61.4 | 53.4 | 25.6 | 25.2 | 35.5 | 51.7 | 50.6 | 50.8 | 19.3 | 33.8 | 26.8 | 40.4 | 48.3 | 54.4 | 47.1 | 14.8 | 38.7 | 35.0 | 52.8 | 43.1 | 40.4 |
| R-CNN | 67.1 | 64.1 | 46.7 | 32.0 | 30.5 | 56.4 | 57.2 | 65.9 | 27.0 | 47.3 | 40.9 | 66.6 | 57.8 | 65.9 | 53.6 | 26.7 | 56.5 | 38.1 | 52.8 | 50.2 | 50.2 |
| R-CNN BB | 71.8 | 65.8 | 53.0 | 36.8 | 35.9 | 59.7 | 60.0 | 69.9 | 27.9 | 50.6 | 41.4 | 70.0 | 62.0 | 69.0 | 58.1 | 29.5 | 59.4 | 39.3 | 61.2 | 52.4 | 53.7 |
表 1:VOC 2010 测试集上的检测平均精度(%)。R-CNN 与 UVA、Regionlets 最宜直接比较,因为这些方法都使用选择性搜索的区域提议。边界框回归(BB)在附录 C 中说明。论文发表时,SegDPM 是 PASCAL VOC 排行榜上的最好成绩。†DPM 和 SegDPM 使用了其他方法没有用的上下文重打分。
Object category classifiers.
Consider training a binary classifier to detect cars. It’s clear that an image region tightly enclosing a car should be a positive example. Similarly, it’s clear that a background region, which has nothing to do with cars, should be a negative example. Less clear is how to label a region that partially overlaps a car. We resolve this issue with an IoU overlap threshold, below which regions are defined as negatives. The overlap threshold, , was selected by a grid search over on a validation set. We found that selecting this threshold carefully is important. Setting it to , as in [39], decreased mAP by points. Similarly, setting it to decreased mAP by points. Positive examples are defined simply to be the ground-truth bounding boxes for each class.
物体类别分类器。
考虑训练一个检测汽车的二分类器。紧紧框住一辆汽车的图像区域显然应是正例。同样,与汽车毫无关系的背景区域显然应是负例。不太清楚的是,如何标注一个只与汽车部分重叠的区域。我们用一个 IoU 重叠阈值来处理这件事,低于该阈值的区域被定义为负例。重叠阈值 是在验证集上对 做网格搜索得到的。我们发现,仔细选择这个阈值很重要。若像 [39] 那样设为 ,mAP 会下降 个点。同样,设为 会使 mAP 下降 个点。正例则简单地定义为每个类别的真值边界框。
Once features are extracted and training labels are applied, we optimize one linear SVM per class. Since the training data is too large to fit in memory, we adopt the standard hard negative mining method [17, 37]. Hard negative mining converges quickly and in practice mAP stops increasing after only a single pass over all images.
特征提取完毕并赋好训练标签之后,我们为每个类别优化一个线性 SVM。由于训练数据太大,无法全部装进内存,我们采用标准的难负例挖掘方法 [17, 37]。难负例挖掘收敛很快,实践中只需在全部图像上走一轮,mAP 就不再上升。
In Appendix B we discuss why the positive and negative examples are defined differently in fine-tuning versus SVM training. We also discuss the trade-offs involved in training detection SVMs rather than simply using the outputs from the final softmax layer of the fine-tuned CNN.
在附录 B 中,我们讨论为什么微调和 SVM 训练里正例与负例的定义不同。我们也讨论了训练检测 SVM、而不是直接使用微调后 CNN 最后一层 softmax 输出,其中涉及的权衡。
2.4 Results on PASCAL VOC 2010-12
2.4 在 PASCAL VOC 2010-12 上的结果
Following the PASCAL VOC best practices [15], we validated all design decisions and hyperparameters on the VOC 2007 dataset (Section 3.2). For final results on the VOC 2010-12 datasets, we fine-tuned the CNN on VOC 2012 train and optimized our detection SVMs on VOC 2012 trainval. We submitted test results to the evaluation server only once for each of the two major algorithm variants (with and without bounding-box regression).
按照 PASCAL VOC 的最佳实践 [15],我们在 VOC 2007 数据集上验证了全部设计决策和超参数(第 3.2 节)。对于 VOC 2010-12 数据集上的最终结果,我们在 VOC 2012 train 上微调 CNN,并在 VOC 2012 trainval 上优化检测 SVM。对两种主要算法变体(带或不带边界框回归),我们各自只向评测服务器提交了一次测试结果。
Table 1 shows complete results on VOC 2010. We compare our method against four strong baselines, including SegDPM [18], which combines DPM detectors with the output of a semantic segmentation system [4] and uses additional inter-detector context and image-classifier rescoring. The most germane comparison is to the UVA system from Uijlings et al. [39], since our systems use the same region proposal algorithm. To classify regions, their method builds a four-level spatial pyramid and populates it with densely sampled SIFT, Extended OpponentSIFT, and RGB-SIFT descriptors, each vector quantized with 4000-word codebooks. Classification is performed with a histogram intersection kernel SVM. Compared to their multi-feature, non-linear kernel SVM approach, we achieve a large improvement in mAP, from 35.1% to 53.7% mAP, while also being much faster (Section 2.2). Our method achieves similar performance (53.3% mAP) on VOC 2011/12 test.
表 1 给出了 VOC 2010 上的完整结果。我们与四个强基线做比较,其中包括 SegDPM [18],它把 DPM 检测器与一个语义分割系统 [4] 的输出结合起来,并使用额外的检测器间上下文以及图像分类器重打分。最直接相关的对照是 Uijlings 等人的 UVA 系统 [39],因为两边使用相同的区域提议算法。为了对区域分类,他们的方法建立一个四层空间金字塔,并向其中填入稠密采样的 SIFT、Extended OpponentSIFT 和 RGB-SIFT 描述子,每类描述子都用 4000 词的码本做向量量化。分类则使用直方图交叉核 SVM。与他们这种多特征、非线性核 SVM 的方法相比,我们把 mAP 从 35.1% 大幅提高到 53.7%,同时也快得多(第 2.2 节)。我们的方法在 VOC 2011/12 测试集上达到相近的表现(53.3% mAP)。
2.5 Results on ILSVRC2013 detection
2.5 在 ILSVRC2013 检测上的结果
We ran R-CNN on the 200-class ILSVRC2013 detection dataset using the same system hyperparameters that we used for PASCAL VOC. We followed the same protocol of submitting test results to the ILSVRC2013 evaluation server only twice, once with and once without bounding-box regression.
我们用与 PASCAL VOC 相同的系统超参数,在 200 类的 ILSVRC2013 检测数据集上运行了 R-CNN。我们沿用同样的规程:只向 ILSVRC2013 评测服务器提交两次测试结果,一次带边界框回归,一次不带。
Figure 3 compares R-CNN to the entries in the ILSVRC 2013 competition and to the post-competition OverFeat result [34]. R-CNN achieves a mAP of 31.4%, which is significantly ahead of the second-best result of 24.3% from OverFeat. To give a sense of the AP distribution over classes, box plots are also presented and a table of per-class APs follows at the end of the paper in Table 8. Most of the competing submissions (OverFeat, NEC-MU, UvA-Euvision, Toronto A, and UIUC-IFP) used convolutional neural networks, indicating that there is significant nuance in how CNNs can be applied to object detection, leading to greatly varying outcomes.
图 3 把 R-CNN 与 ILSVRC 2013 竞赛的各支队伍,以及赛后的 OverFeat 结果 [34] 做了比较。R-CNN 达到 31.4% 的 mAP,显著领先第二名 OverFeat 的 24.3%。为了展示各类别 AP 的分布,图中也给出了箱线图,各类 AP 的表格见文末表 8。大多数参赛系统(OverFeat、NEC-MU、UvA-Euvision、Toronto A 和 UIUC-IFP)都使用了卷积网络,这说明 CNN 用在目标检测上有相当多的讲究,结果也会因此相差很大。
In Section 4, we give an overview of the ILSVRC2013 detection dataset and provide details about choices that we made when running R-CNN on it.
在第 4 节,我们概述 ILSVRC2013 检测数据集,并说明在其上运行 R-CNN 时所做的选择。
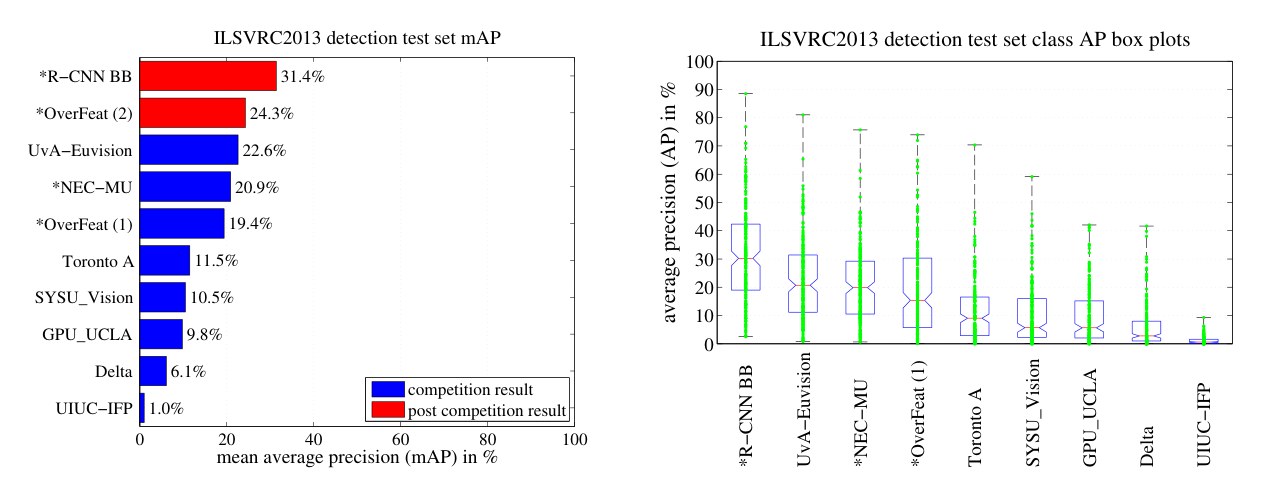
Figure 3: (Left) Mean average precision on the ILSVRC2013 detection test set. Methods preceeded by * use outside training data (images and labels from the ILSVRC classification dataset in all cases). (Right) Box plots for the 200 average precision values per method. A box plot for the post-competition OverFeat result is not shown because per-class APs are not yet available (per-class APs for R-CNN are in Table 8 and also included in the tech report source uploaded to arXiv.org; see R-CNN-ILSVRC2013-APs.txt). The red line marks the median AP, the box bottom and top are the 25th and 75th percentiles. The whiskers extend to the min and max AP of each method. Each AP is plotted as a green dot over the whiskers (best viewed digitally with zoom).
图 3:(左)ILSVRC2013 检测测试集上的平均精度均值。名称前带 * 的方法使用了外部训练数据(在所有情形下都是 ILSVRC 分类数据集中的图像和标签)。(右)每种方法 200 个平均精度值的箱线图。赛后 OverFeat 结果没有给出箱线图,因为当时还没有各类 AP(R-CNN 的各类 AP 见底表 8,也包含在上传到 arXiv.org 的技术报告源文件中;见 R-CNN-ILSVRC2013-APs.txt)。红线标出 AP 的中位数,箱体下沿和上沿分别是第 25 和第 75 百分位。须线伸到每种方法 AP 的最小和最大值。每个 AP 以绿点画在须线上(建议在电子版中放大查看)。
3 Visualization, ablation, and modes of error
3 可视化、消融与错误模式
3.1 Visualizing learned features
3.1 可视化学到的特征
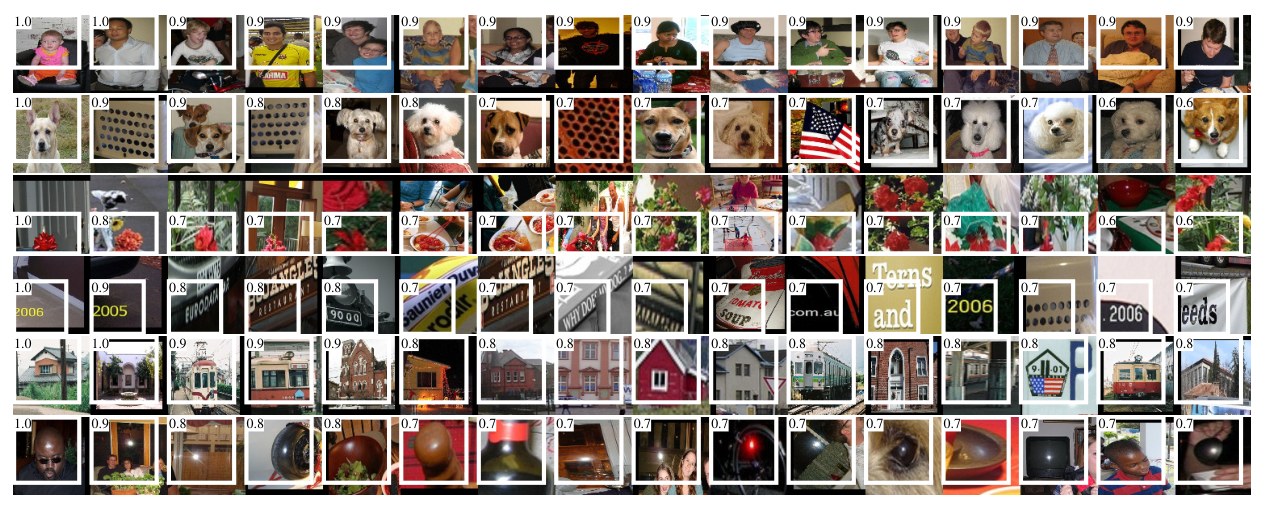
Figure 4: Top regions for six units. Receptive fields and activation values are drawn in white. Some units are aligned to concepts, such as people (row 1) or text (4). Other units capture texture and material properties, such as dot arrays (2) and specular reflections (6).
图 4:六个 单元激活最强的区域。感受野和激活值用白色画出。有些单元对齐到概念,例如人(第 1 行)或文字(第 4 行)。另一些单元捕捉纹理和材料属性,例如点阵(第 2 行)和镜面高光(第 6 行)。
| VOC 2007 test | aero | bike | bird | boat | bottle | bus | car | cat | chair | cow | table | dog | horse | mbike | person | plant | sheep | sofa | train | tv | mAP |
|---|---|---|---|---|---|---|---|---|---|---|---|---|---|---|---|---|---|---|---|---|---|
| R-CNN | 51.8 | 60.2 | 36.4 | 27.8 | 23.2 | 52.8 | 60.6 | 49.2 | 18.3 | 47.8 | 44.3 | 40.8 | 56.6 | 58.7 | 42.4 | 23.4 | 46.1 | 36.7 | 51.3 | 55.7 | 44.2 |
| R-CNN | 59.3 | 61.8 | 43.1 | 34.0 | 25.1 | 53.1 | 60.6 | 52.8 | 21.7 | 47.8 | 42.7 | 47.8 | 52.5 | 58.5 | 44.6 | 25.6 | 48.3 | 34.0 | 53.1 | 58.0 | 46.2 |
| R-CNN | 57.6 | 57.9 | 38.5 | 31.8 | 23.7 | 51.2 | 58.9 | 51.4 | 20.0 | 50.5 | 40.9 | 46.0 | 51.6 | 55.9 | 43.3 | 23.3 | 48.1 | 35.3 | 51.0 | 57.4 | 44.7 |
| R-CNN FT | 58.2 | 63.3 | 37.9 | 27.6 | 26.1 | 54.1 | 66.9 | 51.4 | 26.7 | 55.5 | 43.4 | 43.1 | 57.7 | 59.0 | 45.8 | 28.1 | 50.8 | 40.6 | 53.1 | 56.4 | 47.3 |
| R-CNN FT | 63.5 | 66.0 | 47.9 | 37.7 | 29.9 | 62.5 | 70.2 | 60.2 | 32.0 | 57.9 | 47.0 | 53.5 | 60.1 | 64.2 | 52.2 | 31.3 | 55.0 | 50.0 | 57.7 | 63.0 | 53.1 |
| R-CNN FT | 64.2 | 69.7 | 50.0 | 41.9 | 32.0 | 62.6 | 71.0 | 60.7 | 32.7 | 58.5 | 46.5 | 56.1 | 60.6 | 66.8 | 54.2 | 31.5 | 52.8 | 48.9 | 57.9 | 64.7 | 54.2 |
| R-CNN FT BB | 68.1 | 72.8 | 56.8 | 43.0 | 36.8 | 66.3 | 74.2 | 67.6 | 34.4 | 63.5 | 54.5 | 61.2 | 69.1 | 68.6 | 58.7 | 33.4 | 62.9 | 51.1 | 62.5 | 64.8 | 58.5 |
| DPM v5 [20] | 33.2 | 60.3 | 10.2 | 16.1 | 27.3 | 54.3 | 58.2 | 23.0 | 20.0 | 24.1 | 26.7 | 12.7 | 58.1 | 48.2 | 43.2 | 12.0 | 21.1 | 36.1 | 46.0 | 43.5 | 33.7 |
| DPM ST [28] | 23.8 | 58.2 | 10.5 | 08.5 | 27.1 | 50.4 | 52.0 | 07.3 | 19.2 | 22.8 | 18.1 | 08.0 | 55.9 | 44.8 | 32.4 | 13.3 | 15.9 | 22.8 | 46.2 | 44.9 | 29.1 |
| DPM HSC [31] | 32.2 | 58.3 | 11.5 | 16.3 | 30.6 | 49.9 | 54.8 | 23.5 | 21.5 | 27.7 | 34.0 | 13.7 | 58.1 | 51.6 | 39.9 | 12.4 | 23.5 | 34.4 | 47.4 | 45.2 | 34.3 |
Table 2: Detection average precision (%) on VOC 2007 test. Rows 1-3 show R-CNN performance without fine-tuning. Rows 4-6 show results for the CNN pre-trained on ILSVRC 2012 and then fine-tuned (FT) on VOC 2007 trainval. Row 7 includes a simple bounding-box regression (BB) stage that reduces localization errors (Section C). Rows 8-10 present DPM methods as a strong baseline. The first uses only HOG, while the next two use different feature learning approaches to augment or replace HOG.
| VOC 2007 test | aero | bike | bird | boat | bottle | bus | car | cat | chair | cow | table | dog | horse | mbike | person | plant | sheep | sofa | train | tv | mAP |
|---|---|---|---|---|---|---|---|---|---|---|---|---|---|---|---|---|---|---|---|---|---|
| R-CNN | 51.8 | 60.2 | 36.4 | 27.8 | 23.2 | 52.8 | 60.6 | 49.2 | 18.3 | 47.8 | 44.3 | 40.8 | 56.6 | 58.7 | 42.4 | 23.4 | 46.1 | 36.7 | 51.3 | 55.7 | 44.2 |
| R-CNN | 59.3 | 61.8 | 43.1 | 34.0 | 25.1 | 53.1 | 60.6 | 52.8 | 21.7 | 47.8 | 42.7 | 47.8 | 52.5 | 58.5 | 44.6 | 25.6 | 48.3 | 34.0 | 53.1 | 58.0 | 46.2 |
| R-CNN | 57.6 | 57.9 | 38.5 | 31.8 | 23.7 | 51.2 | 58.9 | 51.4 | 20.0 | 50.5 | 40.9 | 46.0 | 51.6 | 55.9 | 43.3 | 23.3 | 48.1 | 35.3 | 51.0 | 57.4 | 44.7 |
| R-CNN FT | 58.2 | 63.3 | 37.9 | 27.6 | 26.1 | 54.1 | 66.9 | 51.4 | 26.7 | 55.5 | 43.4 | 43.1 | 57.7 | 59.0 | 45.8 | 28.1 | 50.8 | 40.6 | 53.1 | 56.4 | 47.3 |
| R-CNN FT | 63.5 | 66.0 | 47.9 | 37.7 | 29.9 | 62.5 | 70.2 | 60.2 | 32.0 | 57.9 | 47.0 | 53.5 | 60.1 | 64.2 | 52.2 | 31.3 | 55.0 | 50.0 | 57.7 | 63.0 | 53.1 |
| R-CNN FT | 64.2 | 69.7 | 50.0 | 41.9 | 32.0 | 62.6 | 71.0 | 60.7 | 32.7 | 58.5 | 46.5 | 56.1 | 60.6 | 66.8 | 54.2 | 31.5 | 52.8 | 48.9 | 57.9 | 64.7 | 54.2 |
| R-CNN FT BB | 68.1 | 72.8 | 56.8 | 43.0 | 36.8 | 66.3 | 74.2 | 67.6 | 34.4 | 63.5 | 54.5 | 61.2 | 69.1 | 68.6 | 58.7 | 33.4 | 62.9 | 51.1 | 62.5 | 64.8 | 58.5 |
| DPM v5 [20] | 33.2 | 60.3 | 10.2 | 16.1 | 27.3 | 54.3 | 58.2 | 23.0 | 20.0 | 24.1 | 26.7 | 12.7 | 58.1 | 48.2 | 43.2 | 12.0 | 21.1 | 36.1 | 46.0 | 43.5 | 33.7 |
| DPM ST [28] | 23.8 | 58.2 | 10.5 | 08.5 | 27.1 | 50.4 | 52.0 | 07.3 | 19.2 | 22.8 | 18.1 | 08.0 | 55.9 | 44.8 | 32.4 | 13.3 | 15.9 | 22.8 | 46.2 | 44.9 | 29.1 |
| DPM HSC [31] | 32.2 | 58.3 | 11.5 | 16.3 | 30.6 | 49.9 | 54.8 | 23.5 | 21.5 | 27.7 | 34.0 | 13.7 | 58.1 | 51.6 | 39.9 | 12.4 | 23.5 | 34.4 | 47.4 | 45.2 | 34.3 |
表 2:VOC 2007 测试集上的检测平均精度(%)。第 1–3 行给出不微调时 R-CNN 的表现。第 4–6 行是先在 ILSVRC 2012 上预训练、再在 VOC 2007 trainval 上微调(FT)的 CNN 结果。第 7 行加入一个简单的边界框回归(BB)阶段,以减少定位错误(附录 C)。第 8–10 行给出作为强基线的 DPM 方法。第一种只使用 HOG,后两种用不同的特征学习方法来增强或替换 HOG。
| VOC 2007 test | aero | bike | bird | boat | bottle | bus | car | cat | chair | cow | table | dog | horse | mbike | person | plant | sheep | sofa | train | tv | mAP |
|---|---|---|---|---|---|---|---|---|---|---|---|---|---|---|---|---|---|---|---|---|---|
| R-CNN T-Net | 64.2 | 69.7 | 50.0 | 41.9 | 32.0 | 62.6 | 71.0 | 60.7 | 32.7 | 58.5 | 46.5 | 56.1 | 60.6 | 66.8 | 54.2 | 31.5 | 52.8 | 48.9 | 57.9 | 64.7 | 54.2 |
| R-CNN T-Net BB | 68.1 | 72.8 | 56.8 | 43.0 | 36.8 | 66.3 | 74.2 | 67.6 | 34.4 | 63.5 | 54.5 | 61.2 | 69.1 | 68.6 | 58.7 | 33.4 | 62.9 | 51.1 | 62.5 | 64.8 | 58.5 |
| R-CNN O-Net | 71.6 | 73.5 | 58.1 | 42.2 | 39.4 | 70.7 | 76.0 | 74.5 | 38.7 | 71.0 | 56.9 | 74.5 | 67.9 | 69.6 | 59.3 | 35.7 | 62.1 | 64.0 | 66.5 | 71.2 | 62.2 |
| R-CNN O-Net BB | 73.4 | 77.0 | 63.4 | 45.4 | 44.6 | 75.1 | 78.1 | 79.8 | 40.5 | 73.7 | 62.2 | 79.4 | 78.1 | 73.1 | 64.2 | 35.6 | 66.8 | 67.2 | 70.4 | 71.1 | 66.0 |
Table 3: Detection average precision (%) on VOC 2007 test for two different CNN architectures. The first two rows are results from Table 2 using Krizhevsky et al.’s architecture (T-Net). Rows three and four use the recently proposed 16-layer architecture from Simonyan and Zisserman (O-Net) [43].
| VOC 2007 test | aero | bike | bird | boat | bottle | bus | car | cat | chair | cow | table | dog | horse | mbike | person | plant | sheep | sofa | train | tv | mAP |
|---|---|---|---|---|---|---|---|---|---|---|---|---|---|---|---|---|---|---|---|---|---|
| R-CNN T-Net | 64.2 | 69.7 | 50.0 | 41.9 | 32.0 | 62.6 | 71.0 | 60.7 | 32.7 | 58.5 | 46.5 | 56.1 | 60.6 | 66.8 | 54.2 | 31.5 | 52.8 | 48.9 | 57.9 | 64.7 | 54.2 |
| R-CNN T-Net BB | 68.1 | 72.8 | 56.8 | 43.0 | 36.8 | 66.3 | 74.2 | 67.6 | 34.4 | 63.5 | 54.5 | 61.2 | 69.1 | 68.6 | 58.7 | 33.4 | 62.9 | 51.1 | 62.5 | 64.8 | 58.5 |
| R-CNN O-Net | 71.6 | 73.5 | 58.1 | 42.2 | 39.4 | 70.7 | 76.0 | 74.5 | 38.7 | 71.0 | 56.9 | 74.5 | 67.9 | 69.6 | 59.3 | 35.7 | 62.1 | 64.0 | 66.5 | 71.2 | 62.2 |
| R-CNN O-Net BB | 73.4 | 77.0 | 63.4 | 45.4 | 44.6 | 75.1 | 78.1 | 79.8 | 40.5 | 73.7 | 62.2 | 79.4 | 78.1 | 73.1 | 64.2 | 35.6 | 66.8 | 67.2 | 70.4 | 71.1 | 66.0 |
表 3:VOC 2007 测试集上两种不同 CNN 结构的检测平均精度(%)。前两行是表 2 中使用 Krizhevsky 等人结构(T-Net)的结果。第三、四行使用 Simonyan 和 Zisserman 最近提出的 16 层结构(O-Net)[43]。
First-layer filters can be visualized directly and are easy to understand [25]. They capture oriented edges and opponent colors. Understanding the subsequent layers is more challenging. Zeiler and Fergus present a visually attractive deconvolutional approach in [42]. We propose a simple (and complementary) non-parametric method that directly shows what the network learned.
第一层滤波器可以直接可视化,也很容易理解 [25]。它们捕捉有方向的边缘以及对立颜色。理解后面的层则更困难。Zeiler 和 Fergus 在 [42] 中给出了一种视觉上很吸引人的反卷积方法。我们提出一种简单(且与之互补)的非参数方法,直接展示网络学到了什么。
The idea is to single out a particular unit (feature) in the network and use it as if it were an object detector in its own right. That is, we compute the unit’s activations on a large set of held-out region proposals (about 10 million), sort the proposals from highest to lowest activation, perform non-maximum suppression, and then display the top-scoring regions. Our method lets the selected unit “speak for itself” by showing exactly which inputs it fires on. We avoid averaging in order to see different visual modes and gain insight into the invariances computed by the unit.
想法是单独挑出网络中的某个单元(特征),并把它本身当作一个物体检测器来用。也就是说,我们在一大组留出的区域提议(约 1000 万个)上计算该单元的激活,按激活从高到低排序,做非极大值抑制,然后显示得分最高的区域。这种方法让被选中的单元“自己说话”,精确展示它会在哪些输入上被点亮。我们避免做平均,以便看到不同的视觉模式,并洞察该单元所计算的不变性。
We visualize units from layer , which is the max-pooled output of the network’s fifth and final convolutional layer. The feature map is -dimensional. Ignoring boundary effects, each unit has a receptive field of pixels in the original pixel input. A central unit has a nearly global view, while one near the edge has a smaller, clipped support.
我们可视化的是 层的单元,它是网络第五层也是最后一层卷积的最大池化输出。 特征图是 维。忽略边界效应,每个 单元在原来 像素的输入上有 像素的感受野。中心位置的 单元几乎有全局视野,靠近边缘的单元则有更小、被裁切过的支撑。
Each row in Figure 4 displays the top 16 activations for a unit from a CNN that we fine-tuned on VOC 2007 trainval. Six of the 256 functionally unique units are visualized (Appendix D includes more). These units were selected to show a representative sample of what the network learns. In the second row, we see a unit that fires on dog faces and dot arrays. The unit corresponding to the third row is a red blob detector. There are also detectors for human faces and more abstract patterns such as text and triangular structures with windows. The network appears to learn a representation that combines a small number of class-tuned features together with a distributed representation of shape, texture, color, and material properties. The subsequent fully connected layer has the ability to model a large set of compositions of these rich features.
图 4 的每一行展示的是,一个在 VOC 2007 trainval 上微调过的 CNN 中,某个 单元的前 16 个最强激活。256 个功能上互不相同的单元里,这里可视化了 6 个(附录 D 里还有更多)。选取这些单元,是为了给出网络所学内容的一个有代表性的样本。在第二行,我们看到一个会对狗脸和点阵产生响应的单元。对应第三行的单元是一个红色斑块检测器。此外还有人脸检测器,以及文字、带窗户的三角形结构这类更抽象的模式。网络似乎学到了一种表示,把少量按类别调过的特征,与形状、纹理、颜色和材料属性的分布式表示结合在一起。随后的全连接层 则有能力对这些丰富特征的大量组合建模。
3.2 Ablation studies
3.2 消融实验
Performance layer-by-layer, without fine-tuning.
To understand which layers are critical for detection performance, we analyzed results on the VOC 2007 dataset for each of the CNN’s last three layers. Layer was briefly described in Section 3.1. The final two layers are summarized below.
不微调时逐层看表现。
为了弄清哪些层对检测性能至关重要,我们在 VOC 2007 数据集上分析了 CNN 最后三层各自的结果。 层已在第 3.1 节简要介绍。最后两层概述如下。
Layer is fully connected to . To compute features, it multiplies a weight matrix by the feature map (reshaped as a 9216-dimensional vector) and then adds a vector of biases. This intermediate vector is component-wise half-wave rectified ().
层与 全连接。计算特征时,它用一个 的权重矩阵去乘 特征图(被重排成 9216 维向量),再加上一个偏置向量。这个中间向量再按分量做半波整流()。
Layer is the final layer of the network. It is implemented by multiplying the features computed by by a weight matrix, and similarly adding a vector of biases and applying half-wave rectification.
层是网络的最后一层。它的实现是用一个 的权重矩阵去乘 算出的特征,同样加上偏置向量并做半波整流。
We start by looking at results from the CNN without fine-tuning on PASCAL, i.e. all CNN parameters were pre-trained on ILSVRC 2012 only. Analyzing performance layer-by-layer (Table 2 rows 1-3) reveals that features from generalize worse than features from . This means that 29%, or about 16.8 million, of the CNN’s parameters can be removed without degrading mAP. More surprising is that removing both and produces quite good results even though features are computed using only 6% of the CNN’s parameters. Much of the CNN’s representational power comes from its convolutional layers, rather than from the much larger densely connected layers. This finding suggests potential utility in computing a dense feature map, in the sense of HOG, of an arbitrary-sized image by using only the convolutional layers of the CNN. This representation would enable experimentation with sliding-window detectors, including DPM, on top of features.
我们先看 CNN 不在 PASCAL 上微调 的结果,也就是说,全部 CNN 参数只在 ILSVRC 2012 上预训练过。逐层分析表现(表 2 第 1–3 行)表明, 的特征比 更不容易推广。这意味着可以去掉 29%、约 1680 万的 CNN 参数,而不降低 mAP。更意外的是,把 和 都去掉,仍然能得到相当好的结果,尽管 特征只用了 CNN 参数的 6% 来计算。CNN 的表示能力大部分来自卷积层,而不是大得多的稠密连接层。这一发现提示:可以只用 CNN 的卷积层,在任意大小的图像上计算一种类似 HOG 的稠密特征图。这种表示将使人们可以在 特征之上实验滑动窗口检测器,包括 DPM。
Performance layer-by-layer, with fine-tuning.
We now look at results from our CNN after having fine-tuned its parameters on VOC 2007 trainval. The improvement is striking (Table 2 rows 4-6): fine-tuning increases mAP by 8.0 percentage points to 54.2%. The boost from fine-tuning is much larger for and than for , which suggests that the features learned from ImageNet are general and that most of the improvement is gained from learning domain-specific non-linear classifiers on top of them.
微调后逐层看表现。
现在我们看在 VOC 2007 trainval 上微调参数之后的 CNN 结果。提升非常明显(表 2 第 4–6 行):微调把 mAP 提高了 8.0 个百分点,达到 54.2%。微调给 和 带来的提升,远大于给 的提升,这说明从 ImageNet 学到的 特征具有通用性,大部分改进来自在它们之上学习面向特定域的非线性分类器。
Comparison to recent feature learning methods.
Relatively few feature learning methods have been tried on PASCAL VOC detection. We look at two recent approaches that build on deformable part models. For reference, we also include results for the standard HOG-based DPM [20].
与近期特征学习方法的比较。
在 PASCAL VOC 检测上尝试过的特征学习方法相对不多。我们看两种建立在可变形部件模型之上的近期方法。作为参照,我们也列入了标准的基于 HOG 的 DPM [20] 的结果。
The first DPM feature learning method, DPM ST [28], augments HOG features with histograms of “sketch token” probabilities. Intuitively, a sketch token is a tight distribution of contours passing through the center of an image patch. Sketch token probabilities are computed at each pixel by a random forest that was trained to classify pixel patches into one of 150 sketch tokens or background.
第一种 DPM 特征学习方法 DPM ST [28],用“素描符号”(sketch token)概率的直方图来增强 HOG 特征。直观上,一个素描符号是穿过图像块中心的轮廓的紧分布。每个像素上的素描符号概率,由一个随机森林计算,该森林被训练把 像素的图像块分到 150 种素描符号或背景之一。
The second method, DPM HSC [31], replaces HOG with histograms of sparse codes (HSC). To compute an HSC, sparse code activations are solved for at each pixel using a learned dictionary of 100 pixel (grayscale) atoms. The resulting activations are rectified in three ways (full and both half-waves), spatially pooled, unit normalized, and then power transformed ().
第二种方法 DPM HSC [31],用稀疏编码直方图(HSC)替换 HOG。计算 HSC 时,在每个像素上用一个学到的、含 100 个 像素(灰度)原子的词典求解稀疏编码激活。得到的激活以三种方式整流(全波和两个半波),再做空间池化、单位 归一化,然后做幂变换()。
All R-CNN variants strongly outperform the three DPM baselines (Table 2 rows 8-10), including the two that use feature learning. Compared to the latest version of DPM, which uses only HOG features, our mAP is more than 20 percentage points higher: 54.2% vs. 33.7%—a 61% relative improvement. The combination of HOG and sketch tokens yields 2.5 mAP points over HOG alone, while HSC improves over HOG by 4 mAP points (when compared internally to their private DPM baselines—both use non-public implementations of DPM that underperform the open source version [20]). These methods achieve mAPs of 29.1% and 34.3%, respectively.
所有 R-CNN 变体都大幅超过三个 DPM 基线(表 2 第 8–10 行),包括那两个使用了特征学习的方法。与最新版、只使用 HOG 特征的 DPM 相比,我们的 mAP 高出 20 多个百分点:54.2% 对 33.7%——相对提高 61%。HOG 与素描符号的组合,比单独使用 HOG 高 2.5 个 mAP 点,而 HSC 比 HOG 高 4 个 mAP 点(这是与他们各自的私有 DPM 基线做内部比较——两者都使用非公开的 DPM 实现,表现低于开源版本 [20])。这些方法达到的 mAP 分别为 29.1% 和 34.3%。
3.3 Network architectures
3.3 网络结构
Most results in this paper use the network architecture from Krizhevsky et al. [25]. However, we have found that the choice of architecture has a large effect on R-CNN detection performance. In Table 3 we show results on VOC 2007 test using the 16-layer deep network recently proposed by Simonyan and Zisserman [43]. This network was one of the top performers in the recent ILSVRC 2014 classification challenge. The network has a homogeneous structure consisting of 13 layers of convolution kernels, with five max pooling layers interspersed, and topped with three fully-connected layers. We refer to this network as “O-Net” for OxfordNet and the baseline as “T-Net” for TorontoNet.
本文中的大多数结果使用 Krizhevsky 等人 [25] 的网络结构。不过我们发现,结构的选择对 R-CNN 的检测表现影响很大。表 3 给出了使用 Simonyan 和 Zisserman [43] 最近提出的 16 层深度网络,在 VOC 2007 测试集上的结果。该网络是近期 ILSVRC 2014 分类挑战赛中的优胜者之一。它的结构很均匀:13 层 卷积核,其间穿插五层最大池化,顶上再接三层全连接。我们把这个网络叫做 “O-Net”(OxfordNet),把基线叫做 “T-Net”(TorontoNet)。
To use O-Net in R-CNN, we downloaded the publicly available pre-trained network weights for the VGG_ILSVRC_16_layers model from the Caffe Model Zoo.[^1] We then fine-tuned the network using the same protocol as we used for T-Net. The only difference was to use smaller minibatches (24 examples) as required in order to fit within GPU memory. The results in Table 3 show that R-CNN with O-Net substantially outperforms R-CNN with T-Net, increasing mAP from 58.5% to 66.0%. However there is a considerable drawback in terms of compute time, with the forward pass of O-Net taking roughly 7 times longer than T-Net.
为了在 R-CNN 中使用 O-Net,我们从 Caffe Model Zoo 下载了公开的 VGG_ILSVRC_16_layers 模型预训练权重(https://github.com/BVLC/caffe/wiki/Model-Zoo)。然后用与 T-Net 相同的规程微调该网络。唯一的差别是使用更小的小批量(24 个样本),以便能放进 GPU 显存。表 3 的结果表明,使用 O-Net 的 R-CNN 明显超过使用 T-Net 的 R-CNN,把 mAP 从 58.5% 提高到 66.0%。不过计算时间上有不小的代价,O-Net 的前向传播大约比 T-Net 慢 7 倍。
3.4 Detection error analysis
3.4 检测错误分析
We applied the excellent detection analysis tool from Hoiem et al. [23] in order to reveal our method’s error modes, understand how fine-tuning changes them, and to see how our error types compare with DPM. A full summary of the analysis tool is beyond the scope of this paper and we encourage readers to consult [23] to understand some finer details (such as “normalized AP”). Since the analysis is best absorbed in the context of the associated plots, we present the discussion within the captions of Figure 5 and Figure 6.
我们使用了 Hoiem 等人 [23] 出色的检测分析工具,以便揭示方法的错误模式,理解微调如何改变它们,并看我们的错误类型与 DPM 相比如何。对该分析工具做完整概述超出了本文的范围,我们鼓励读者查阅 [23] 以了解一些更细的细节(例如“归一化 AP”)。由于分析最好结合相应的图来看,我们把讨论放在图 5 和图 6 的图注里。
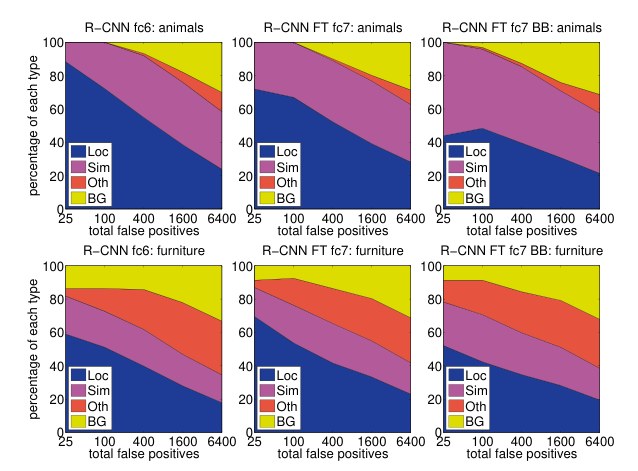
Figure 5: Distribution of top-ranked false positive (FP) types. Each plot shows the evolving distribution of FP types as more FPs are considered in order of decreasing score. Each FP is categorized into 1 of 4 types: Loc—poor localization (a detection with an IoU overlap with the correct class between 0.1 and 0.5, or a duplicate); Sim—confusion with a similar category; Oth—confusion with a dissimilar object category; BG—a FP that fired on background. Compared with DPM (see [23]), significantly more of our errors result from poor localization, rather than confusion with background or other object classes, indicating that the CNN features are much more discriminative than HOG. Loose localization likely results from our use of bottom-up region proposals and the positional invariance learned from pre-training the CNN for whole-image classification. Column three shows how our simple bounding-box regression method fixes many localization errors.
图 5:排名靠前的假阳性(FP)类型分布。每张图展示的是,按分数从高到低纳入越来越多 FP 时,FP 类型分布如何演变。每个 FP 被归入 4 类之一:Loc——定位不佳(与正确类别的 IoU 重叠在 0.1 到 0.5 之间的检测,或重复检测);Sim——与相近类别混淆;Oth——与不相似的物体类别混淆;BG——在背景上触发的 FP。与 DPM 相比(见 [23]),我们的错误里明显有更多来自定位不佳,而不是与背景或其他物体类别混淆,这表明 CNN 特征比 HOG 更具判别性。定位偏松,很可能来自我们使用自底向上的区域提议,以及 CNN 为整图分类做预训练时学到的位置不变性。第三列显示,我们这种简单的边界框回归方法修好了许多定位错误。
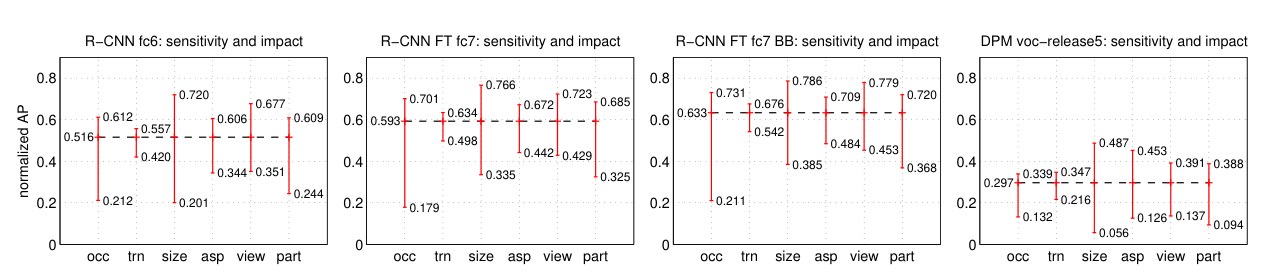
Figure 6: Sensitivity to object characteristics. Each plot shows the mean (over classes) normalized AP (see [23]) for the highest and lowest performing subsets within six different object characteristics (occlusion, truncation, bounding-box area, aspect ratio, viewpoint, part visibility). We show plots for our method (R-CNN) with and without fine-tuning (FT) and bounding-box regression (BB) as well as for DPM voc-release5. Overall, fine-tuning does not reduce sensitivity (the difference between max and min), but does substantially improve both the highest and lowest performing subsets for nearly all characteristics. This indicates that fine-tuning does more than simply improve the lowest performing subsets for aspect ratio and bounding-box area, as one might conjecture based on how we warp network inputs. Instead, fine-tuning improves robustness for all characteristics including occlusion, truncation, viewpoint, and part visibility.
图 6:对物体特性的敏感性。每张图给出六种不同物体特性(遮挡、截断、边界框面积、宽高比、视角、部件可见性)中,表现最好和最差子集的(各类平均)归一化 AP(见 [23])。我们给出了方法(R-CNN)在有无微调(FT)、有无边界框回归(BB)时的图,以及 DPM voc-release5 的图。总体上看,微调并没有降低敏感性(最大值与最小值之差),但几乎对所有特性都大幅提高了最好和最差子集的表现。这说明微调做的并不只是改善宽高比和边界框面积上最差的那些子集——尽管从我们扭曲网络输入的方式看,或许会这样猜想。相反,微调提高了对所有特性的稳健性,包括遮挡、截断、视角和部件可见性。
3.5 Bounding-box regression
3.5 边界框回归
Based on the error analysis, we implemented a simple method to reduce localization errors. Inspired by the bounding-box regression employed in DPM [17], we train a linear regression model to predict a new detection window given the features for a selective search region proposal. Full details are given in Appendix C. Results in Table 1, Table 2, and Figure 5 show that this simple approach fixes a large number of mislocalized detections, boosting mAP by 3 to 4 points.
基于错误分析,我们实现了一种简单的方法来减少定位错误。受 DPM 中使用的边界框回归 [17] 启发,我们训练一个线性回归模型,根据某个选择性搜索区域提议的 特征,预测一个新的检测窗口。完整细节见附录 C。表 1、表 2 和图 5 的结果表明,这种简单方法修好了大量定位不准的检测,把 mAP 提高了 3 到 4 个点。
3.6 Qualitative results
3.6 定性结果
Qualitative detection results on ILSVRC2013 are presented in Figure 8 and Figure 9 at the end of the paper. Each image was sampled randomly from the val2 set and all detections from all detectors with a precision greater than 0.5 are shown. Note that these are not curated and give a realistic impression of the detectors in action. More qualitative results are presented in Figure 10 and Figure 11, but these have been curated. We selected each image because it contained interesting, surprising, or amusing results. Here, also, all detections at precision greater than 0.5 are shown.
ILSVRC2013 上的定性检测结果见文末图 8 和图 9。每张图像都是从 val2 集合中随机抽样的,并画出所有检测器中精度大于 0.5 的全部检测。需要注意,这些结果未经挑选,能比较真实地反映检测器实际工作时的样子。图 10 和图 11 给出了更多定性结果,但那些是经过挑选的。我们选中每张图,是因为它包含有趣、出人意料或好笑的结果。这里同样画出精度大于 0.5 的全部检测。
4 The ILSVRC2013 detection dataset
4 ILSVRC2013 检测数据集
In Section 2 we presented results on the ILSVRC2013 detection dataset. This dataset is less homogeneous than PASCAL VOC, requiring choices about how to use it. Since these decisions are non-trivial, we cover them in this section.
第 2 节给出了在 ILSVRC2013 检测数据集上的结果。这个数据集不像 PASCAL VOC 那样同质,使用时需要做一些选择。这些决定并不平凡,因此我们在这一节加以说明。
4.1 Dataset overview
4.1 数据集概览
The ILSVRC2013 detection dataset is split into three sets: train (395,918), val (20,121), and test (40,152), where the number of images in each set is in parentheses. The val and test splits are drawn from the same image distribution. These images are scene-like and similar in complexity (number of objects, amount of clutter, pose variability, etc.) to PASCAL VOC images. The val and test splits are exhaustively annotated, meaning that in each image all instances from all 200 classes are labeled with bounding boxes. The train set, in contrast, is drawn from the ILSVRC2013 classification image distribution. These images have more variable complexity with a skew towards images of a single centered object. Unlike val and test, the train images (due to their large number) are not exhaustively annotated. In any given train image, instances from the 200 classes may or may not be labeled. In addition to these image sets, each class has an extra set of negative images. Negative images are manually checked to validate that they do not contain any instances of their associated class. The negative image sets were not used in this work. More information on how ILSVRC was collected and annotated can be found in [11, 36].
ILSVRC2013 检测数据集分成三个子集:train(395,918)、val(20,121)和 test(40,152),括号里是各集的图像数。val 和 test 划分来自同一图像分布。这些图像偏场景,复杂度(物体数量、杂乱程度、姿态变化等)与 PASCAL VOC 图像相近。val 和 test 划分是穷尽标注的,也就是说每张图里全部 200 类的所有实例都标了边界框。相比之下,train 集来自 ILSVRC2013 的分类图像分布。这些图像的复杂度更不均匀,并偏向只有一个居中物体的图像。与 val 和 test 不同,train 图像(由于其数量很大)并没有被穷尽标注。在任意一张训练图里,200 类中的实例可能被标了,也可能没被标。除了这些图像集合,每个类别还有一组额外的负图像。负图像经过人工检查,以确认其中不含相应类别的任何实例。本组工作没有使用这些负图像集合。关于 ILSVRC 如何收集和标注的更多信息,见 [11, 36]。
The nature of these splits presents a number of choices for training R-CNN. The train images cannot be used for hard negative mining, because annotations are not exhaustive. Where should negative examples come from? Also, the train images have different statistics than val and test. Should the train images be used at all, and if so, to what extent? While we have not thoroughly evaluated a large number of choices, we present what seemed like the most obvious path based on previous experience.
这些划分的性质,给训练 R-CNN 带来了若干选择。train 图像不能用于难负例挖掘,因为标注并不穷尽。负例该从哪里来?此外,train 图像与 val、test 的统计特性不同。train 图像到底该不该用,如果用,用到什么程度?我们并没有对大量选择做彻底评估,只给出基于以往经验看起来最自然的一条路。
Our general strategy is to rely heavily on the val set and use some of the train images as an auxiliary source of positive examples. To use val for both training and validation, we split it into roughly equally sized “val1” and “val2’’ sets. Since some classes have very few examples in val (the smallest has only 31 and half have fewer than 110), it is important to produce an approximately class-balanced partition. To do this, a large number of candidate splits were generated and the one with the smallest maximum relative class imbalance was selected.[^2] Each candidate split was generated by clustering val images using their class counts as features, followed by a randomized local search that may improve the split balance. The particular split used here has a maximum relative imbalance of about 11% and a median relative imbalance of 4%. The val1/val2 split and code used to produce them will be publicly available to allow other researchers to compare their methods on the val splits used in this report.
我们的总体策略是主要依靠 val 集,并把一部分 train 图像当作正例的辅助来源。为了让 val 既能用于训练也能用于验证,我们把它大致均分成 “val1” 和 “val2” 两集。由于 val 中有些类别的样本很少(最少的只有 31 个,一半类别少于 110 个),做出一个大致类别均衡的划分很重要。为此,我们生成了大量候选划分,并选出最大相对类别不平衡最小的一个。相对不平衡定义为 ,其中 和 是划分后两半中各类的样本数。每个候选划分都是先用各类计数作为特征对 val 图像做聚类,再跟一次可能改善划分平衡的随机局部搜索而生成的。这里使用的特定划分,最大相对不平衡约为 11%,中位相对不平衡为 4%。val1/val2 划分以及生成它们的代码将公开,以便其他研究者能在本报告所用的 val 划分上比较方法。
4.2 Region proposals
4.2 区域提议
We followed the same region proposal approach that was used for detection on PASCAL. Selective search [39] was run in “fast mode” on each image in val1, val2, and test (but not on images in train). One minor modification was required to deal with the fact that selective search is not scale invariant and so the number of regions produced depends on the image resolution. ILSVRC image sizes range from very small to a few that are several mega-pixels, and so we resized each image to a fixed width (500 pixels) before running selective search. On val, selective search resulted in an average of 2403 region proposals per image with a 91.6% recall of all ground-truth bounding boxes (at 0.5 IoU threshold). This recall is notably lower than in PASCAL, where it is approximately 98%, indicating significant room for improvement in the region proposal stage.
我们沿用了在 PASCAL 上做检测时相同的区域提议方法。选择性搜索 [39] 以“快速模式”在 val1、val2 和 test 的每张图像上运行(但不在 train 的图像上运行)。需要一处小修改,以处理选择性搜索不具有尺度不变性、因而生成的区域数依赖于图像分辨率这一事实。ILSVRC 图像尺寸从很小到少数几张高达数百万像素都有,因此我们在运行选择性搜索之前,把每张图像的宽度调整到固定值(500 像素)。在 val 上,选择性搜索平均每张图产生 2403 个区域提议,对全部真值边界框的召回率为 91.6%(在 0.5 IoU 阈值下)。这一召回明显低于 PASCAL 上大约 98% 的水平,说明区域提议阶段还有很大的改进空间。
4.3 Training data
4.3 训练数据
For training data, we formed a set of images and boxes that includes all selective search and ground-truth boxes from val1 together with up to ground-truth boxes per class from train (if a class has fewer than ground-truth boxes in train, then we take all of them). We’ll call this dataset of images and boxes valtrainN. In an ablation study, we show mAP on val2 for (Section 4.5).
作为训练数据,我们构造了一组图像和框,其中包括 val1 上全部的选择性搜索框和真值框,再加上 train 中每个类别至多 个真值框(若某类在 train 中的真值框少于 个,则全部取用)。我们把这个由图像和框组成的数据集叫做 valtrainN。在一项消融实验中,我们给出 时在 val2 上的 mAP(第 4.5 节)。
Training data is required for three procedures in R-CNN: (1) CNN fine-tuning, (2) detector SVM training, and (3) bounding-box regressor training. CNN fine-tuning was run for 50k SGD iteration on valtrainN using the exact same settings as were used for PASCAL. Fine-tuning on a single NVIDIA Tesla K20 took 13 hours using Caffe. For SVM training, all ground-truth boxes from valtrainN were used as positive examples for their respective classes. Hard negative mining was performed on a randomly selected subset of 5000 images from val1. An initial experiment indicated that mining negatives from all of val1, versus a 5000 image subset (roughly half of it), resulted in only a 0.5 percentage point drop in mAP, while cutting SVM training time in half. No negative examples were taken from train because the annotations are not exhaustive. The extra sets of verified negative images were not used. The bounding-box regressors were trained on val1.
R-CNN 中有三处需要训练数据:(1)CNN 微调,(2)检测 SVM 训练,以及(3)边界框回归器训练。CNN 微调在 valtrainN 上跑 5 万次 SGD 迭代,设置与 PASCAL 上完全相同。在单块 NVIDIA Tesla K20 上用 Caffe 微调需要 13 个小时。对于 SVM 训练,valtrainN 中的全部真值框被用作相应类别的正例。难负例挖掘在从 val1 中随机选出的 5000 张图像子集上进行。初步实验表明,从全部 val1 挖掘负例,与从大约一半的 5000 张图像子集挖掘相比,mAP 只下降 0.5 个百分点,而 SVM 训练时间减半。没有从 train 中取负例,因为标注并不穷尽。那些经过核验的额外负图像集合也没有使用。边界框回归器在 val1 上训练。
| test set | val2 | val2 | val2 | val2 | val2 | val2 | test | test |
|---|---|---|---|---|---|---|---|---|
| SVM training set | val1 | valtrain | valtrain | valtrain | valtrain | valtrain | valtrain | valtrain |
| CNN fine-tuning set | n/a | n/a | n/a | val1 | valtrain | valtrain | valtrain | valtrain |
| bbox reg set | n/a | n/a | n/a | n/a | n/a | val1 | n/a | val |
| CNN feature layer | ||||||||
| mAP | 20.9 | 24.1 | 24.1 | 26.5 | 29.7 | 31.0 | 30.2 | 31.4 |
| median AP | 17.7 | 21.0 | 21.4 | 24.8 | 29.2 | 29.6 | 29.0 | 30.3 |
Table 4: ILSVRC2013 ablation study of data usage choices, fine-tuning, and bounding-box regression.
| test set | val2 | val2 | val2 | val2 | val2 | val2 | test | test |
|---|---|---|---|---|---|---|---|---|
| SVM training set | val1 | valtrain | valtrain | valtrain | valtrain | valtrain | valtrain | valtrain |
| CNN fine-tuning set | n/a | n/a | n/a | val1 | valtrain | valtrain | valtrain | valtrain |
| bbox reg set | n/a | n/a | n/a | n/a | n/a | val1 | n/a | val |
| CNN feature layer | ||||||||
| mAP | 20.9 | 24.1 | 24.1 | 26.5 | 29.7 | 31.0 | 30.2 | 31.4 |
| median AP | 17.7 | 21.0 | 21.4 | 24.8 | 29.2 | 29.6 | 29.0 | 30.3 |
表 4:ILSVRC2013 上关于数据使用选择、微调以及边界框回归的消融实验。
4.4 Validation and evaluation
4.4 验证与评测
Before submitting results to the evaluation server, we validated data usage choices and the effect of fine-tuning and bounding-box regression on the val2 set using the training data described above. All system hyperparameters (e.g., SVM C hyperparameters, padding used in region warping, NMS thresholds, bounding-box regression hyperparameters) were fixed at the same values used for PASCAL. Undoubtedly some of these hyperparameter choices are slightly suboptimal for ILSVRC, however the goal of this work was to produce a preliminary R-CNN result on ILSVRC without extensive dataset tuning. After selecting the best choices on val2, we submitted exactly two result files to the ILSVRC2013 evaluation server. The first submission was without bounding-box regression and the second submission was with bounding-box regression. For these submissions, we expanded the SVM and bounding-box regressor training sets to use valtrain and val, respectively. We used the CNN that was fine-tuned on valtrain to avoid re-running fine-tuning and feature computation.
在向评测服务器提交结果之前,我们用上面所述的训练数据,在 val2 集上验证了数据使用选择,以及微调和边界框回归的效果。全部系统超参数(例如 SVM 的 C 超参数、区域扭曲时使用的填充、NMS 阈值、边界框回归超参数)都固定为与 PASCAL 上相同的值。毫无疑问,其中一些超参数选择对 ILSVRC 略非最优,不过这项工作的目标是在不做大量数据集调参的情况下,给出 R-CNN 在 ILSVRC 上的初步结果。在 val2 上选定最佳选择之后,我们向 ILSVRC2013 评测服务器恰好提交了两个结果文件。第一次提交不带边界框回归,第二次提交带边界框回归。对这些提交,我们把 SVM 和边界框回归器的训练集分别扩大为 valtrain 和 val。我们使用在 valtrain 上微调过的 CNN,以避免重新做微调和特征计算。
4.5 Ablation study
4.5 消融实验
Table 4 shows an ablation study of the effects of different amounts of training data, fine-tuning, and bounding-box regression. A first observation is that mAP on val2 matches mAP on test very closely. This gives us confidence that mAP on val2 is a good indicator of test set performance. The first result, 20.9%, is what R-CNN achieves using a CNN pre-trained on the ILSVRC2012 classification dataset (no fine-tuning) and given access to the small amount of training data in val1 (recall that half of the classes in val1 have between 15 and 55 examples). Expanding the training set to valtrainN improves performance to 24.1%, with essentially no difference between and . Fine-tuning the CNN using examples from just val1 gives a modest improvement to 26.5%, however there is likely significant overfitting due to the small number of positive training examples. Expanding the fine-tuning set to valtrain, which adds up to 1000 positive examples per class from the train set, helps significantly, boosting mAP to 29.7%. Bounding-box regression improves results to 31.0%, which is a smaller relative gain that what was observed in PASCAL.
表 4 给出了关于不同训练数据量、微调以及边界框回归效果的消融实验。第一个观察是,val2 上的 mAP 与 test 上的 mAP 非常接近。这让我们有信心认为,val2 上的 mAP 是测试集表现的良好指示。第一个结果 20.9%,是 R-CNN 使用在 ILSVRC2012 分类数据集上预训练(未经微调)的 CNN,并且只能用到 val1 中那一小部分训练数据时达到的成绩(请注意 val1 中一半类别只有 15 到 55 个样本)。把训练集扩大到 valtrainN 后,表现提高到 24.1%, 和 之间基本上没有差别。只用 val1 中的样本微调 CNN,带来适度提升,达到 26.5%,不过由于正训练样本很少,很可能存在明显过拟合。把微调集扩大到 valtrain,也就是从 train 集为每个类别最多再加 1000 个正例,帮助很大,把 mAP 提到 29.7%。边界框回归把结果提高到 31.0%,相对增益小于在 PASCAL 上看到的。
4.6 Relationship to OverFeat
4.6 与 OverFeat 的关系
There is an interesting relationship between R-CNN and OverFeat: OverFeat can be seen (roughly) as a special case of R-CNN. If one were to replace selective search region proposals with a multi-scale pyramid of regular square regions and change the per-class bounding-box regressors to a single bounding-box regressor, then the systems would be very similar (modulo some potentially significant differences in how they are trained: CNN detection fine-tuning, using SVMs, etc.). It is worth noting that OverFeat has a significant speed advantage over R-CNN: it is about 9x faster, based on a figure of 2 seconds per image quoted from [34]. This speed comes from the fact that OverFeat’s sliding windows (i.e., region proposals) are not warped at the image level and therefore computation can be easily shared between overlapping windows. Sharing is implemented by running the entire network in a convolutional fashion over arbitrary-sized inputs. Speeding up R-CNN should be possible in a variety of ways and remains as future work.
R-CNN 和 OverFeat 之间有一种有意思的关系:OverFeat 可以(大致)看成 R-CNN 的一种特例。如果把选择性搜索的区域提议换成多尺度金字塔上的规则方形区域,并把每类一个的边界框回归器改成单个边界框回归器,那么两套系统就会非常相近(训练方式上可能仍有一些不可忽视的差别:CNN 检测微调、使用 SVM 等)。值得指出的是,OverFeat 相对 R-CNN 有明显的速度优势:大约快 9 倍,依据是 [34] 中引用的每张图 2 秒。这一速度来自 OverFeat 的滑动窗口(也就是区域提议)并不在图像层面做扭曲,因而重叠窗口之间的计算很容易共享。共享的实现方式,是让整个网络以卷积的方式在任意大小的输入上运行。用多种办法加速 R-CNN 应该是可行的,这留作未来工作。
5 Semantic segmentation
5 语义分割
Region classification is a standard technique for semantic segmentation, allowing us to easily apply R-CNN to the PASCAL VOC segmentation challenge. To facilitate a direct comparison with the current leading semantic segmentation system (called O2P for “second-order pooling”) [4], we work within their open source framework. O2P uses CPMC to generate 150 region proposals per image and then predicts the quality of each region, for each class, using support vector regression (SVR). The high performance of their approach is due to the quality of the CPMC regions and the powerful second-order pooling of multiple feature types (enriched variants of SIFT and LBP). We also note that Farabet et al. [16] recently demonstrated good results on several dense scene labeling datasets (not including PASCAL) using a CNN as a multi-scale per-pixel classifier.
区域分类是语义分割的标准技术,这让我们可以很容易地把 R-CNN 用到 PASCAL VOC 分割挑战上。为了便于与当时领先的语义分割系统(叫做 O2P,取自 “second-order pooling”,二阶池化)[4] 做直接比较,我们在他们的开源框架内工作。O2P 用 CPMC 为每张图生成 150 个区域提议,然后用支持向量回归(SVR)预测每个区域在每个类别上的质量。他们方法的高性能,来自 CPMC 区域的质量,以及对多种特征类型(SIFT 和 LBP 的增强变体)做有力的二阶池化。我们也注意到,Farabet 等人 [16] 最近在若干稠密场景标注数据集(不包括 PASCAL)上,用 CNN 作为多尺度逐像素分类器,也展示了不错的结果。
We follow [2, 4] and extend the PASCAL segmentation training set to include the extra annotations made available by Hariharan et al. [22]. Design decisions and hyperparameters were cross-validated on the VOC 2011 validation set. Final test results were evaluated only once.
我们沿用 [2, 4],把 PASCAL 分割训练集扩展为包含 Hariharan 等人 [22] 提供的额外标注。设计决策和超参数在 VOC 2011 验证集上做交叉验证。最终测试结果只评测了一次。
CNN features for segmentation.
We evaluate three strategies for computing features on CPMC regions, all of which begin by warping the rectangular window around the region to . The first strategy (full) ignores the region’s shape and computes CNN features directly on the warped window, exactly as we did for detection. However, these features ignore the non-rectangular shape of the region. Two regions might have very similar bounding boxes while having very little overlap. Therefore, the second strategy (fg) computes CNN features only on a region’s foreground mask. We replace the background with the mean input so that background regions are zero after mean subtraction. The third strategy (full+fg) simply concatenates the full and fg features; our experiments validate their complementarity.
用于分割的 CNN 特征。
我们评估了在 CPMC 区域上计算特征的三种策略,它们都以把区域周围的矩形窗口扭曲到 开始。第一种策略(full)忽略区域的形状,直接在扭曲后的窗口上计算 CNN 特征,做法与检测时完全相同。不过这些特征忽略了区域的非矩形形状。两个区域可能有非常相近的边界框,重叠却很少。因此,第二种策略(fg)只在区域的前景掩码上计算 CNN 特征。我们用均值输入替换背景,这样在减均值之后背景区域为零。第三种策略(full+fg)只是把 full 和 fg 特征拼接起来;实验验证了它们的互补性。
| full R-CNN | fg R-CNN | full+fg R-CNN | ||||
|---|---|---|---|---|---|---|
| O2P [4] | ||||||
| 46.4 | 43.0 | 42.5 | 43.7 | 42.1 | 47.9 | 45.8 |
Table 5: Segmentation mean accuracy (%) on VOC 2011 validation. Column 1 presents O2P; 2-7 use our CNN pre-trained on ILSVRC 2012.
| full R-CNN | fg R-CNN | full+fg R-CNN | ||||
|---|---|---|---|---|---|---|
| O2P [4] | ||||||
| 46.4 | 43.0 | 42.5 | 43.7 | 42.1 | 47.9 | 45.8 |
表 5:VOC 2011 验证集上的分割平均精度(%)。第 1 列给出 O2P;第 2–7 列使用我们在 ILSVRC 2012 上预训练的 CNN。
Results on VOC 2011.
Table 5 shows a summary of our results on the VOC 2011 validation set compared with O2P. (See Appendix E for complete per-category results.) Within each feature computation strategy, layer always outperforms and the following discussion refers to the features. The fg strategy slightly outperforms full, indicating that the masked region shape provides a stronger signal, matching our intuition. However, full+fg achieves an average accuracy of 47.9%, our best result by a margin of 4.2% (also modestly outperforming O2P), indicating that the context provided by the full features is highly informative even given the fg features. Notably, training the 20 SVRs on our full+fg features takes an hour on a single core, compared to 10+ hours for training on O2P features.
在 VOC 2011 上的结果。
表 5 给出了我们在 VOC 2011 验证集上与 O2P 比较的结果摘要。(完整的各类结果见附录 E。)在每一种特征计算策略内部, 层总是超过 ,下面的讨论都针对 特征。fg 策略略优于 full,说明被掩码的区域形状提供了更强的信号,这与我们的直觉一致。不过 full+fg 达到 47.9% 的平均精度,是我们最好的结果,领先 4.2%(也适度超过 O2P),说明即使已有 fg 特征,full 特征提供的上下文仍然非常有信息量。值得一提的是,在我们的 full+fg 特征上训练 20 个 SVR,在单核上只需一个小时,而在 O2P 特征上训练需要 10 个小时以上。
In Table 6 we present results on the VOC 2011 test set, comparing our best-performing method, (full+fg), against two strong baselines. Our method achieves the highest segmentation accuracy for 11 out of 21 categories, and the highest overall segmentation accuracy of 47.9%, averaged across categories (but likely ties with the O2P result under any reasonable margin of error). Still better performance could likely be achieved by fine-tuning.
在表 6 中,我们给出 VOC 2011 测试集上的结果,把表现最好的方法 (full+fg)与两个强基线做比较。我们的方法在 21 个类别中的 11 个上取得最高分割精度,总体平均分割精度也最高,为 47.9%(按类别平均;不过在任何合理的误差范围内,都很可能与 O2P 的结果打平)。若再做微调,表现多半还能更好。
| VOC 2011 test | bg | aero | bike | bird | boat | bottle | bus | car | cat | chair | cow | table | dog | horse | mbike | person | plant | sheep | sofa | train | tv | mean |
|---|---|---|---|---|---|---|---|---|---|---|---|---|---|---|---|---|---|---|---|---|---|---|
| R&P [2] | 83.4 | 46.8 | 18.9 | 36.6 | 31.2 | 42.7 | 57.3 | 47.4 | 44.1 | 08.1 | 39.4 | 36.1 | 36.3 | 49.5 | 48.3 | 50.7 | 26.3 | 47.2 | 22.1 | 42.0 | 43.2 | 40.8 |
| O2P [4] | 85.4 | 69.7 | 22.3 | 45.2 | 44.4 | 46.9 | 66.7 | 57.8 | 56.2 | 13.5 | 46.1 | 32.3 | 41.2 | 59.1 | 55.3 | 51.0 | 36.2 | 50.4 | 27.8 | 46.9 | 44.6 | 47.6 |
| ours (full+fg R-CNN ) | 84.2 | 66.9 | 23.7 | 58.3 | 37.4 | 55.4 | 73.3 | 58.7 | 56.5 | 09.7 | 45.5 | 29.5 | 49.3 | 40.1 | 57.8 | 53.9 | 33.8 | 60.7 | 22.7 | 47.1 | 41.3 | 47.9 |
Table 6: Segmentation accuracy (%) on VOC 2011 test. We compare against two strong baselines: the “Regions and Parts” (R&P) method of [2] and the second-order pooling (O2P) method of [4]. Without any fine-tuning, our CNN achieves top segmentation performance, outperforming R&P and roughly matching O2P.
| VOC 2011 test | bg | aero | bike | bird | boat | bottle | bus | car | cat | chair | cow | table | dog | horse | mbike | person | plant | sheep | sofa | train | tv | mean |
|---|---|---|---|---|---|---|---|---|---|---|---|---|---|---|---|---|---|---|---|---|---|---|
| R&P [2] | 83.4 | 46.8 | 18.9 | 36.6 | 31.2 | 42.7 | 57.3 | 47.4 | 44.1 | 08.1 | 39.4 | 36.1 | 36.3 | 49.5 | 48.3 | 50.7 | 26.3 | 47.2 | 22.1 | 42.0 | 43.2 | 40.8 |
| O2P [4] | 85.4 | 69.7 | 22.3 | 45.2 | 44.4 | 46.9 | 66.7 | 57.8 | 56.2 | 13.5 | 46.1 | 32.3 | 41.2 | 59.1 | 55.3 | 51.0 | 36.2 | 50.4 | 27.8 | 46.9 | 44.6 | 47.6 |
| ours (full+fg R-CNN ) | 84.2 | 66.9 | 23.7 | 58.3 | 37.4 | 55.4 | 73.3 | 58.7 | 56.5 | 09.7 | 45.5 | 29.5 | 49.3 | 40.1 | 57.8 | 53.9 | 33.8 | 60.7 | 22.7 | 47.1 | 41.3 | 47.9 |
表 6:VOC 2011 测试集上的分割精度(%)。我们与两个强基线比较:[2] 的 “Regions and Parts”(R&P)方法,以及 [4] 的二阶池化(O2P)方法。在不做任何微调的情况下,我们的 CNN 达到了最高的分割表现,超过 R&P,并大致与 O2P 持平。
6 Conclusion
6 结论
In recent years, object detection performance had stagnated. The best performing systems were complex ensembles combining multiple low-level image features with high-level context from object detectors and scene classifiers. This paper presents a simple and scalable object detection algorithm that gives a 30% relative improvement over the best previous results on PASCAL VOC 2012.
近年来,目标检测的表现一度停滞。表现最好的系统是复杂的集成,把多种底层图像特征,与来自物体检测器和场景分类器的高层上下文结合在一起。本文提出一种简单、可扩展的目标检测算法,在 PASCAL VOC 2012 上相对此前最佳结果提高了 30%。
We achieved this performance through two insights. The first is to apply high-capacity convolutional neural networks to bottom-up region proposals in order to localize and segment objects. The second is a paradigm for training large CNNs when labeled training data is scarce. We show that it is highly effective to pre-train the network—with supervision—for a auxiliary task with abundant data (image classification) and then to fine-tune the network for the target task where data is scarce (detection). We conjecture that the “supervised pre-training/domain-specific fine-tuning” paradigm will be highly effective for a variety of data-scarce vision problems.
这一表现来自两点认识。第一,把容量很大的卷积网络用在自底向上的区域提议上,以便定位并分割物体。第二,是在带标注训练数据稀缺时训练大型 CNN 的一套范式。我们表明,先——有监督地——为一项数据充足的辅助任务(图像分类)预训练网络,再为数据稀缺的目标任务(检测)微调网络,是非常有效的。我们猜想,“有监督预训练 / 面向特定域微调”这一范式,对多种数据稀缺的视觉问题都会很有效。
We conclude by noting that it is significant that we achieved these results by using a combination of classical tools from computer vision and deep learning (bottom-up region proposals and convolutional neural networks). Rather than opposing lines of scientific inquiry, the two are natural and inevitable partners.
最后我们想指出,这些结果是通过把计算机视觉中的经典工具和深度学习(自底向上的区域提议与卷积网络)结合起来得到的,这一点本身就有意义。它们并不是彼此对立的研究路线,而是自然且必然的伙伴。
Acknowledgments.
This research was supported in part by DARPA Mind’s Eye and MSEE programs, by NSF awards IIS-0905647, IIS-1134072, and IIS-1212798, MURI N000014-10-1-0933, and by support from Toyota. The GPUs used in this research were generously donated by the NVIDIA Corporation.
致谢。
本研究部分得到 DARPA Mind’s Eye 和 MSEE 项目,NSF 奖项 IIS-0905647、IIS-1134072 和 IIS-1212798,MURI N000014-10-1-0933,以及丰田公司的支持。本研究所用 GPU 由 NVIDIA 公司慷慨捐赠。
Appendix
附录
Appendix A Object proposal transformations
附录 A 物体提议的变换
The convolutional neural network used in this work requires a fixed-size input of pixels. For detection, we consider object proposals that are arbitrary image rectangles. We evaluated two approaches for transforming object proposals into valid CNN inputs.
本工作使用的卷积网络要求固定尺寸的 像素输入。做检测时,我们考虑的物体提议是任意的图像矩形。我们评估了两种把物体提议变换成合法 CNN 输入的方法。
The first method (“tightest square with context”) encloses each object proposal inside the tightest square and then scales (isotropically) the image contained in that square to the CNN input size. Figure 7 column (B) shows this transformation. A variant on this method (“tightest square without context”) excludes the image content that surrounds the original object proposal. Figure 7 column (C) shows this transformation. The second method (“warp”) anisotropically scales each object proposal to the CNN input size. Figure 7 column (D) shows the warp transformation.
第一种方法(“带上下文的最小正方形”)把每个物体提议包进最小的正方形,再(各向同性地)把该正方形里的图像缩放到 CNN 输入尺寸。图 7 第(B)列展示了这一变换。它的一个变体(“不带上下文的最小正方形”)排除原物体提议周围的图像内容。图 7 第(C)列展示了这一变换。第二种方法(“扭曲”)把每个物体提议各向异性地缩放到 CNN 输入尺寸。图 7 第(D)列展示了扭曲变换。
For each of these transformations, we also consider including additional image context around the original object proposal. The amount of context padding () is defined as a border size around the original object proposal in the transformed input coordinate frame. Figure 7 shows pixels in the top row of each example and pixels in the bottom row. In all methods, if the source rectangle extends beyond the image, the missing data is replaced with the image mean (which is then subtracted before inputing the image into the CNN). A pilot set of experiments showed that warping with context padding ( pixels) outperformed the alternatives by a large margin (3-5 mAP points). Obviously more alternatives are possible, including using replication instead of mean padding. Exhaustive evaluation of these alternatives is left as future work.
对这些变换中的每一种,我们也考虑在原物体提议周围加入额外的图像上下文。上下文填充量()定义为:在变换后的输入坐标系里,原物体提议周围的边框大小。图 7 中,每个例子的上行对应 像素,下行对应 像素。在所有方法中,若源矩形超出图像范围,缺失的数据就用图像均值填上(再在送入 CNN 之前把均值减掉)。一组探索性实验表明,带上下文填充的扭曲( 像素)以较大优势(3–5 个 mAP 点)超过其他方案。显然还可以有更多替代做法,包括用复制填充代替均值填充。对这些替代方案做穷尽评估,留作未来工作。
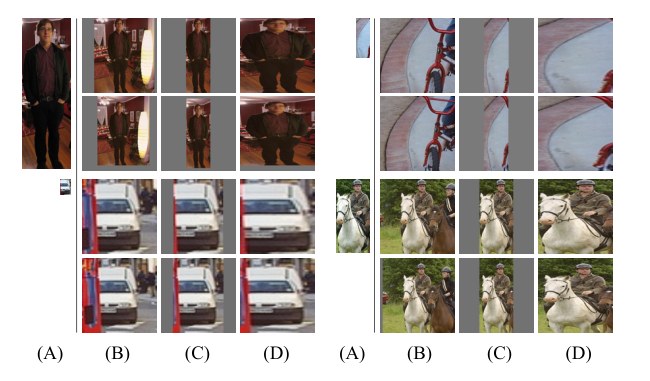
Figure 7: Different object proposal transformations. (A) the original object proposal at its actual scale relative to the transformed CNN inputs; (B) tightest square with context; (C) tightest square without context; (D) warp. Within each column and example proposal, the top row corresponds to pixels of context padding while the bottom row has pixels of context padding.
图 7:不同的物体提议变换。(A)原物体提议按其相对于变换后 CNN 输入的实际尺度;(B)带上下文的最小正方形;(C)不带上下文的最小正方形;(D)扭曲。在每一列和每一个示例提议里,上行对应 像素的上下文填充,下行对应 像素的上下文填充。
Appendix B Positive vs. negative examples and softmax
附录 B 正例与负例,以及 softmax
Two design choices warrant further discussion. The first is: Why are positive and negative examples defined differently for fine-tuning the CNN versus training the object detection SVMs? To review the definitions briefly, for fine-tuning we map each object proposal to the ground-truth instance with which it has maximum IoU overlap (if any) and label it as a positive for the matched ground-truth class if the IoU is at least 0.5. All other proposals are labeled “background” (i.e., negative examples for all classes). For training SVMs, in contrast, we take only the ground-truth boxes as positive examples for their respective classes and label proposals with less than 0.3 IoU overlap with all instances of a class as a negative for that class. Proposals that fall into the grey zone (more than 0.3 IoU overlap, but are not ground truth) are ignored.
有两项设计选择值得进一步讨论。第一项是:为什么微调 CNN 与训练物体检测 SVM 时,正例和负例的定义不同?简要回顾定义:微调时,我们把每个物体提议映射到与它 IoU 重叠最大的真值实例(如果有的话),若 IoU 至少为 0.5,就把它标为所匹配真值类别的正例。所有其他提议被标为“背景”(也就是对所有类别都是负例)。相比之下,训练 SVM 时,我们只把真值框当作相应类别的正例,并把与某类所有实例的 IoU 重叠都小于 0.3 的提议标为该类的负例。落入灰色地带的提议(IoU 重叠大于 0.3,但又不是真值)则被忽略。
Historically speaking, we arrived at these definitions because we started by training SVMs on features computed by the ImageNet pre-trained CNN, and so fine-tuning was not a consideration at that point in time. In that setup, we found that our particular label definition for training SVMs was optimal within the set of options we evaluated (which included the setting we now use for fine-tuning). When we started using fine-tuning, we initially used the same positive and negative example definition as we were using for SVM training. However, we found that results were much worse than those obtained using our current definition of positives and negatives.
从历史上说,我们会给出这些定义,是因为一开始是在 ImageNet 预训练 CNN 算出的特征上训练 SVM,当时还没有考虑微调。在那种设置下,我们发现,在所评估的选项里(也包括我们现在用于微调的设置),这种用于训练 SVM 的标签定义是最优的。开始使用微调时,我们起初采用了与 SVM 训练相同的正负例定义。不过我们发现,结果比使用当前这套正负例定义要差得多。
Our hypothesis is that this difference in how positives and negatives are defined is not fundamentally important and arises from the fact that fine-tuning data is limited. Our current scheme introduces many “jittered” examples (those proposals with overlap between 0.5 and 1, but not ground truth), which expands the number of positive examples by approximately 30x. We conjecture that this large set is needed when fine-tuning the entire network to avoid overfitting. However, we also note that using these jittered examples is likely suboptimal because the network is not being fine-tuned for precise localization.
我们的假设是,正负例定义上的这一差别并不是根本性的,它来自微调数据有限这一事实。当前方案引入了许多“抖动”样本(那些重叠在 0.5 到 1 之间、但不是真值的提议),大约把正例数量扩大了 30 倍。我们猜想,在微调整个网络时,需要这一大集合来避免过拟合。不过我们也指出,使用这些抖动样本很可能并非最优,因为网络并没有被微调去追求精确的定位。
This leads to the second issue: Why, after fine-tuning, train SVMs at all? It would be cleaner to simply apply the last layer of the fine-tuned network, which is a 21-way softmax regression classifier, as the object detector. We tried this and found that performance on VOC 2007 dropped from 54.2% to 50.9% mAP. This performance drop likely arises from a combination of several factors including that the definition of positive examples used in fine-tuning does not emphasize precise localization and the softmax classifier was trained on randomly sampled negative examples rather than on the subset of “hard negatives” used for SVM training.
这就引出第二个问题:微调之后,为什么还要训练 SVM?更干净的做法,是直接把微调后网络的最后一层——一个 21 路 softmax 回归分类器——当作物体检测器来用。我们试过这样做,发现 VOC 2007 上的表现从 54.2% 降到 50.9% mAP。这一下降很可能来自几个因素的叠加,包括微调时使用的正例定义并不强调精确定位,以及 softmax 分类器是在随机采样的负例上训练的,而不是在 SVM 训练所用的那一子集“难负例”上训练的。
This result shows that it’s possible to obtain close to the same level of performance without training SVMs after fine-tuning. We conjecture that with some additional tweaks to fine-tuning the remaining performance gap may be closed. If true, this would simplify and speed up R-CNN training with no loss in detection performance.
这一结果表明,微调之后不再训练 SVM,也有可能达到接近同一水平的表现。我们猜想,若对微调再做一些调整,剩下的表现差距或许可以被补上。如果属实,这将简化并加快 R-CNN 的训练,同时不损失检测性能。
Appendix C Bounding-box regression
附录 C 边界框回归
We use a simple bounding-box regression stage to improve localization performance. After scoring each selective search proposal with a class-specific detection SVM, we predict a new bounding box for the detection using a class-specific bounding-box regressor. This is similar in spirit to the bounding-box regression used in deformable part models [17]. The primary difference between the two approaches is that here we regress from features computed by the CNN, rather than from geometric features computed on the inferred DPM part locations.
我们使用一个简单的边界框回归阶段来提高定位表现。在用类别专用的检测 SVM 给每个选择性搜索提议打分之后,再用一个类别专用的边界框回归器,为该检测预测一个新的边界框。这在思路上类似于可变形部件模型中使用的边界框回归 [17]。两种方法的主要差别在于,这里我们是从 CNN 算出的特征做回归,而不是从在推断出的 DPM 部件位置上计算的几何特征做回归。
The input to our training algorithm is a set of training pairs , where specifies the pixel coordinates of the center of proposal ’s bounding box together with ’s width and height in pixels. Hence forth, we drop the superscript unless it is needed. Each ground-truth bounding box is specified in the same way: . Our goal is to learn a transformation that maps a proposed box to a ground-truth box .
训练算法的输入是一组 个训练对 ,其中 给出提议 边界框中心的像素坐标,以及 的宽和高(以像素计)。此后除非需要,我们略去上标 。每个真值边界框 以同样方式给出:。我们的目标是学习一个变换,把提议框 映射到真值框 。
We parameterize the transformation in terms of four functions , , , and . The first two specify a scale-invariant translation of the center of ’s bounding box, while the second two specify log-space translations of the width and height of ’s bounding box. After learning these functions, we can transform an input proposal into a predicted ground-truth box by applying the transformation
我们用四个函数 、、 和 来参数化这个变换。前两个给出 的边界框中心的尺度不变平移,后两个给出 的边界框宽和高在对数空间中的平移。学到这些函数之后,我们可以通过施加如下变换,把输入提议 变成预测的真值框
Each function (where is one of ) is modeled as a linear function of the features of proposal , denoted by \mbox{\boldmath\phi}_{5}(P). (The dependence of \mbox{\boldmath\phi}_{5}(P) on the image data is implicitly assumed.) Thus we have d_{\star}(P)={\bf w}_{\star}^{\textrm{T}}\mbox{\boldmath\phi}_{5}(P), where is a vector of learnable model parameters. We learn by optimizing the regularized least squares objective (ridge regression):
每个函数 (其中 是 之一)被建模为提议 的 特征的线性函数,该特征记为 \mbox{\boldmath\phi}_{5}(P)。(\mbox{\boldmath\phi}_{5}(P) 对图像数据的依赖是隐含假定的。)于是有 d_{\star}(P)={\bf w}_{\star}^{\textrm{T}}\mbox{\boldmath\phi}_{5}(P),其中 是可学习的模型参数向量。我们通过优化正则化最小二乘目标(岭回归)来学习 :
\displaystyle{\bf w}_{\star}=\argmin_{\hat{{\bf w}}_{\star}}\sum_{i}^{N}(t^{i}_{\star}-\hat{{\bf w}}_{\star}^{\textrm{T}}\mbox{\boldmath$\phi$}_{5}(P^{i}))^{2}+\lambda\left\lVert\hat{{\bf w}}_{\star}\right\rVert^{2}. \tag{5}
The regression targets for the training pair are defined as
训练对 的回归目标 定义为
As a standard regularized least squares problem, this can be solved efficiently in closed form.
作为一个标准的正则化最小二乘问题,这可以高效地以闭式解求出。
We found two subtle issues while implementing bounding-box regression. The first is that regularization is important: we set based on a validation set. The second issue is that care must be taken when selecting which training pairs to use. Intuitively, if is far from all ground-truth boxes, then the task of transforming to a ground-truth box does not make sense. Using examples like would lead to a hopeless learning problem. Therefore, we only learn from a proposal if it is nearby at least one ground-truth box. We implement “nearness” by assigning to the ground-truth box with which it has maximum IoU overlap (in case it overlaps more than one) if and only if the overlap is greater than a threshold (which we set to 0.6 using a validation set). All unassigned proposals are discarded. We do this once for each object class in order to learn a set of class-specific bounding-box regressors.
在实现边界框回归时,我们发现两个细致的问题。第一,正则化很重要:我们根据验证集把 设为 。第二个问题是,必须小心选择使用哪些训练对 。直观上,如果 离所有真值框都很远,那么把 变换到某个真值框 这一任务就没有意义。使用像 这样的样本,会带来一个没有希望的学习问题。因此,我们只从至少靠近一个真值框的提议 上学习。我们这样实现“靠近”:把 赋给与它 IoU 重叠最大的真值框 (若它与不止一个重叠),当且仅当该重叠大于一个阈值(我们根据验证集把该阈值设为 0.6)。所有未被赋值的提议都被丢弃。我们对每个物体类别做一次这样的处理,以便学到一组类别专用的边界框回归器。
At test time, we score each proposal and predict its new detection window only once. In principle, we could iterate this procedure (i.e., re-score the newly predicted bounding box, and then predict a new bounding box from it, and so on). However, we found that iterating does not improve results.
测试时,我们给每个提议打分,并只预测一次它的新检测窗口。原则上,我们可以迭代这一过程(也就是对新预测的边界框重新打分,再从它预测一个新的边界框,如此反复)。不过我们发现,迭代并不会改进结果。
Appendix D Additional feature visualizations
附录 D 更多特征可视化
Figure 12 shows additional visualizations for 20 units. For each unit, we show the 24 region proposals that maximally activate that unit out of the full set of approximately 10 million regions in all of VOC 2007 test.
图 12 给出另外 20 个 单元的可视化。对每个单元,我们在 VOC 2007 测试集全部大约 1000 万个区域里,展示使该单元激活最强的 24 个区域提议。
We label each unit by its (y, x, channel) position in the dimensional feature map. Within each channel, the CNN computes exactly the same function of the input region, with the (y, x) position changing only the receptive field.
我们用每个单元在 维 特征图中的 位置来标记它。在每个通道内部,CNN 对输入区域计算的是完全相同的函数, 位置只改变感受野。
Appendix E Per-category segmentation results
附录 E 各类别分割结果
In Table 7 we show the per-category segmentation accuracy on VOC 2011 val for each of our six segmentation methods in addition to the O2P method [4]. These results show which methods are strongest across each of the 20 PASCAL classes, plus the background class.
在表 7 中,我们给出 VOC 2011 val 上的各类别分割精度,覆盖我们的六种分割方法以及 O2P 方法 [4]。这些结果说明,在 20 个 PASCAL 类别以及背景类上,哪些方法最强。
| VOC 2011 val | bg | aero | bike | bird | boat | bottle | bus | car | cat | chair | cow | table | dog | horse | mbike | person | plant | sheep | sofa | train | tv | mean |
|---|---|---|---|---|---|---|---|---|---|---|---|---|---|---|---|---|---|---|---|---|---|---|
| O2P [4] | 84.0 | 69.0 | 21.7 | 47.7 | 42.2 | 42.4 | 64.7 | 65.8 | 57.4 | 12.9 | 37.4 | 20.5 | 43.7 | 35.7 | 52.7 | 51.0 | 35.8 | 51.0 | 28.4 | 59.8 | 49.7 | 46.4 |
| full R-CNN | 81.3 | 56.2 | 23.9 | 42.9 | 40.7 | 38.8 | 59.2 | 56.5 | 53.2 | 11.4 | 34.6 | 16.7 | 48.1 | 37.0 | 51.4 | 46.0 | 31.5 | 44.0 | 24.3 | 53.7 | 51.1 | 43.0 |
| full R-CNN | 81.0 | 52.8 | 25.1 | 43.8 | 40.5 | 42.7 | 55.4 | 57.7 | 51.3 | 08.7 | 32.5 | 11.5 | 48.1 | 37.0 | 50.5 | 46.4 | 30.2 | 42.1 | 21.2 | 57.7 | 56.0 | 42.5 |
| fg R-CNN | 81.4 | 54.1 | 21.1 | 40.6 | 38.7 | 53.6 | 59.9 | 57.2 | 52.5 | 09.1 | 36.5 | 23.6 | 46.4 | 38.1 | 53.2 | 51.3 | 32.2 | 38.7 | 29.0 | 53.0 | 47.5 | 43.7 |
| fg R-CNN | 80.9 | 50.1 | 20.0 | 40.2 | 34.1 | 40.9 | 59.7 | 59.8 | 52.7 | 07.3 | 32.1 | 14.3 | 48.8 | 42.9 | 54.0 | 48.6 | 28.9 | 42.6 | 24.9 | 52.2 | 48.8 | 42.1 |
| full+fg R-CNN | 83.1 | 60.4 | 23.2 | 48.4 | 47.3 | 52.6 | 61.6 | 60.6 | 59.1 | 10.8 | 45.8 | 20.9 | 57.7 | 43.3 | 57.4 | 52.9 | 34.7 | 48.7 | 28.1 | 60.0 | 48.6 | 47.9 |
| full+fg R-CNN | 82.3 | 56.7 | 20.6 | 49.9 | 44.2 | 43.6 | 59.3 | 61.3 | 57.8 | 07.7 | 38.4 | 15.1 | 53.4 | 43.7 | 50.8 | 52.0 | 34.1 | 47.8 | 24.7 | 60.1 | 55.2 | 45.7 |
Table 7: Per-category segmentation accuracy (%) on the VOC 2011 validation set.
| VOC 2011 val | bg | aero | bike | bird | boat | bottle | bus | car | cat | chair | cow | table | dog | horse | mbike | person | plant | sheep | sofa | train | tv | mean |
|---|---|---|---|---|---|---|---|---|---|---|---|---|---|---|---|---|---|---|---|---|---|---|
| O2P [4] | 84.0 | 69.0 | 21.7 | 47.7 | 42.2 | 42.4 | 64.7 | 65.8 | 57.4 | 12.9 | 37.4 | 20.5 | 43.7 | 35.7 | 52.7 | 51.0 | 35.8 | 51.0 | 28.4 | 59.8 | 49.7 | 46.4 |
| full R-CNN | 81.3 | 56.2 | 23.9 | 42.9 | 40.7 | 38.8 | 59.2 | 56.5 | 53.2 | 11.4 | 34.6 | 16.7 | 48.1 | 37.0 | 51.4 | 46.0 | 31.5 | 44.0 | 24.3 | 53.7 | 51.1 | 43.0 |
| full R-CNN | 81.0 | 52.8 | 25.1 | 43.8 | 40.5 | 42.7 | 55.4 | 57.7 | 51.3 | 08.7 | 32.5 | 11.5 | 48.1 | 37.0 | 50.5 | 46.4 | 30.2 | 42.1 | 21.2 | 57.7 | 56.0 | 42.5 |
| fg R-CNN | 81.4 | 54.1 | 21.1 | 40.6 | 38.7 | 53.6 | 59.9 | 57.2 | 52.5 | 09.1 | 36.5 | 23.6 | 46.4 | 38.1 | 53.2 | 51.3 | 32.2 | 38.7 | 29.0 | 53.0 | 47.5 | 43.7 |
| fg R-CNN | 80.9 | 50.1 | 20.0 | 40.2 | 34.1 | 40.9 | 59.7 | 59.8 | 52.7 | 07.3 | 32.1 | 14.3 | 48.8 | 42.9 | 54.0 | 48.6 | 28.9 | 42.6 | 24.9 | 52.2 | 48.8 | 42.1 |
| full+fg R-CNN | 83.1 | 60.4 | 23.2 | 48.4 | 47.3 | 52.6 | 61.6 | 60.6 | 59.1 | 10.8 | 45.8 | 20.9 | 57.7 | 43.3 | 57.4 | 52.9 | 34.7 | 48.7 | 28.1 | 60.0 | 48.6 | 47.9 |
| full+fg R-CNN | 82.3 | 56.7 | 20.6 | 49.9 | 44.2 | 43.6 | 59.3 | 61.3 | 57.8 | 07.7 | 38.4 | 15.1 | 53.4 | 43.7 | 50.8 | 52.0 | 34.1 | 47.8 | 24.7 | 60.1 | 55.2 | 45.7 |
表 7:VOC 2011 验证集上的各类别分割精度(%)。
Appendix F Analysis of cross-dataset redundancy
附录 F 跨数据集冗余分析
One concern when training on an auxiliary dataset is that there might be redundancy between it and the test set. Even though the tasks of object detection and whole-image classification are substantially different, making such cross-set redundancy much less worrisome, we still conducted a thorough investigation that quantifies the extent to which PASCAL test images are contained within the ILSVRC 2012 training and validation sets. Our findings may be useful to researchers who are interested in using ILSVRC 2012 as training data for the PASCAL image classification task.
在辅助数据集上训练时,一个担心是它与测试集之间可能存在冗余。尽管目标检测和整图分类这两项任务有实质差别,使得这种跨集合的冗余不那么令人担心,我们仍然做了一次彻底的调查,量化 PASCAL 测试图像在多大程度上包含在 ILSVRC 2012 的训练和验证集中。我们的发现,对有意把 ILSVRC 2012 用作 PASCAL 图像分类任务训练数据的研究者可能有用。
We performed two checks for duplicate (and near-duplicate) images. The first test is based on exact matches of flickr image IDs, which are included in the VOC 2007 test annotations (these IDs are intentionally kept secret for subsequent PASCAL test sets). All PASCAL images, and about half of ILSVRC, were collected from flickr.com. This check turned up 31 matches out of 4952 (0.63%).
我们对重复(以及近重复)图像做了两项检查。第一项检查基于 flickr 图像 ID 的精确匹配,这些 ID 包含在 VOC 2007 测试标注里(后续 PASCAL 测试集有意对这些 ID 保密)。全部 PASCAL 图像,以及大约一半的 ILSVRC,都收集自 flickr.com。这项检查在 4952 张图里找出 31 个匹配(0.63%)。
The second check uses GIST [30] descriptor matching, which was shown in [13] to have excellent performance at near-duplicate image detection in large ( 1 million) image collections. Following [13], we computed GIST descriptors on warped pixel versions of all ILSVRC 2012 trainval and PASCAL 2007 test images.
第二项检查使用 GIST [30] 描述子匹配,[13] 表明它在大型( 100 万)图像集合中做近重复图像检测有出色的表现。沿用 [13],我们在全部 ILSVRC 2012 trainval 和 PASCAL 2007 测试图像扭曲到 像素后的版本上,计算了 GIST 描述子。
Euclidean distance nearest-neighbor matching of GIST descriptors revealed 38 near-duplicate images (including all 31 found by flickr ID matching). The matches tend to vary slightly in JPEG compression level and resolution, and to a lesser extent cropping. These findings show that the overlap is small, less than 1%. For VOC 2012, because flickr IDs are not available, we used the GIST matching method only. Based on GIST matches, 1.5% of VOC 2012 test images are in ILSVRC 2012 trainval. The slightly higher rate for VOC 2012 is likely due to the fact that the two datasets were collected closer together in time than VOC 2007 and ILSVRC 2012 were.
对 GIST 描述子做欧氏距离最近邻匹配,找出了 38 张近重复图像(包括 flickr ID 匹配找到的全部 31 张)。这些匹配往往在 JPEG 压缩级别和分辨率上略有差别,裁剪上的差别则更小一些。这些发现表明重叠很小,不到 1%。对 VOC 2012,由于没有 flickr ID,我们只使用了 GIST 匹配方法。基于 GIST 匹配,VOC 2012 测试图像中有 1.5% 出现在 ILSVRC 2012 trainval 中。VOC 2012 略高的比例,很可能是因为这两个数据集在时间上的采集间隔,比 VOC 2007 和 ILSVRC 2012 更近。
| class | AP | class | AP | class | AP | class | AP | class | AP |
|---|---|---|---|---|---|---|---|---|---|
| accordion | 50.8 | centipede | 30.4 | hair spray | 13.8 | pencil box | 11.4 | snowplow | 69.2 |
| airplane | 50.0 | chain saw | 14.1 | hamburger | 34.2 | pencil sharpener | 9.0 | soap dispenser | 16.8 |
| ant | 31.8 | chair | 19.5 | hammer | 9.9 | perfume | 32.8 | soccer ball | 43.7 |
| antelope | 53.8 | chime | 24.6 | hamster | 46.0 | person | 41.7 | sofa | 16.3 |
| apple | 30.9 | cocktail shaker | 46.2 | harmonica | 12.6 | piano | 20.5 | spatula | 6.8 |
| armadillo | 54.0 | coffee maker | 21.5 | harp | 50.4 | pineapple | 22.6 | squirrel | 31.3 |
| artichoke | 45.0 | computer keyboard | 39.6 | hat with a wide brim | 40.5 | ping-pong ball | 21.0 | starfish | 45.1 |
| axe | 11.8 | computer mouse | 21.2 | head cabbage | 17.4 | pitcher | 19.2 | stethoscope | 18.3 |
| baby bed | 42.0 | corkscrew | 24.2 | helmet | 33.4 | pizza | 43.7 | stove | 8.1 |
| backpack | 2.8 | cream | 29.9 | hippopotamus | 38.0 | plastic bag | 6.4 | strainer | 9.9 |
| bagel | 37.5 | croquet ball | 30.0 | horizontal bar | 7.0 | plate rack | 15.2 | strawberry | 26.8 |
| balance beam | 32.6 | crutch | 23.7 | horse | 41.7 | pomegranate | 32.0 | stretcher | 13.2 |
| banana | 21.9 | cucumber | 22.8 | hotdog | 28.7 | popsicle | 21.2 | sunglasses | 18.8 |
| band aid | 17.4 | cup or mug | 34.0 | iPod | 59.2 | porcupine | 37.2 | swimming trunks | 9.1 |
| banjo | 55.3 | diaper | 10.1 | isopod | 19.5 | power drill | 7.9 | swine | 45.3 |
| baseball | 41.8 | digital clock | 18.5 | jellyfish | 23.7 | pretzel | 24.8 | syringe | 5.7 |
| basketball | 65.3 | dishwasher | 19.9 | koala bear | 44.3 | printer | 21.3 | table | 21.7 |
| bathing cap | 37.2 | dog | 76.8 | ladle | 3.0 | puck | 14.1 | tape player | 21.4 |
| beaker | 11.3 | domestic cat | 44.1 | ladybug | 58.4 | punching bag | 29.4 | tennis ball | 59.1 |
| bear | 62.7 | dragonfly | 27.8 | lamp | 9.1 | purse | 8.0 | tick | 42.6 |
| bee | 52.9 | drum | 19.9 | laptop | 35.4 | rabbit | 71.0 | tie | 24.6 |
| bell pepper | 38.8 | dumbbell | 14.1 | lemon | 33.3 | racket | 16.2 | tiger | 61.8 |
| bench | 12.7 | electric fan | 35.0 | lion | 51.3 | ray | 41.1 | toaster | 29.2 |
| bicycle | 41.1 | elephant | 56.4 | lipstick | 23.1 | red panda | 61.1 | traffic light | 24.7 |
| binder | 6.2 | face powder | 22.1 | lizard | 38.9 | refrigerator | 14.0 | train | 60.8 |
| bird | 70.9 | fig | 44.5 | lobster | 32.4 | remote control | 41.6 | trombone | 13.8 |
| bookshelf | 19.3 | filing cabinet | 20.6 | maillot | 31.0 | rubber eraser | 2.5 | trumpet | 14.4 |
| bow tie | 38.8 | flower pot | 20.2 | maraca | 30.1 | rugby ball | 34.5 | turtle | 59.1 |
| bow | 9.0 | flute | 4.9 | microphone | 4.0 | ruler | 11.5 | tv or monitor | 41.7 |
| bowl | 26.7 | fox | 59.3 | microwave | 40.1 | salt or pepper shaker | 24.6 | unicycle | 27.2 |
| brassiere | 31.2 | french horn | 24.2 | milk can | 33.3 | saxophone | 40.8 | vacuum | 19.5 |
| burrito | 25.7 | frog | 64.1 | miniskirt | 14.9 | scorpion | 57.3 | violin | 13.7 |
| bus | 57.5 | frying pan | 21.5 | monkey | 49.6 | screwdriver | 10.6 | volleyball | 59.7 |
| butterfly | 88.5 | giant panda | 42.5 | motorcycle | 42.2 | seal | 20.9 | waffle iron | 24.0 |
| camel | 37.6 | goldfish | 28.6 | mushroom | 31.8 | sheep | 48.9 | washer | 39.8 |
| can opener | 28.9 | golf ball | 51.3 | nail | 4.5 | ski | 9.0 | water bottle | 8.1 |
| car | 44.5 | golfcart | 47.9 | neck brace | 31.6 | skunk | 57.9 | watercraft | 40.9 |
| cart | 48.0 | guacamole | 32.3 | oboe | 27.5 | snail | 36.2 | whale | 48.6 |
| cattle | 32.3 | guitar | 33.1 | orange | 38.8 | snake | 33.8 | wine bottle | 31.2 |
| cello | 28.9 | hair dryer | 13.0 | otter | 22.2 | snowmobile | 58.8 | zebra | 49.6 |
Table 8: Per-class average precision (%) on the ILSVRC2013 detection test set.
| 类别 | AP | class | AP | 类别 | AP | class | AP | 类别 | AP |
|---|---|---|---|---|---|---|---|---|---|
| accordion | 50.8 | centipede | 30.4 | hair spray | 13.8 | pencil box | 11.4 | snowplow | 69.2 |
| airplane | 50.0 | chain saw | 14.1 | hamburger | 34.2 | pencil sharpener | 9.0 | soap dispenser | 16.8 |
| ant | 31.8 | chair | 19.5 | hammer | 9.9 | perfume | 32.8 | soccer ball | 43.7 |
| antelope | 53.8 | chime | 24.6 | hamster | 46.0 | person | 41.7 | sofa | 16.3 |
| apple | 30.9 | cocktail shaker | 46.2 | harmonica | 12.6 | piano | 20.5 | spatula | 6.8 |
| armadillo | 54.0 | coffee maker | 21.5 | harp | 50.4 | pineapple | 22.6 | squirrel | 31.3 |
| artichoke | 45.0 | computer keyboard | 39.6 | hat with a wide brim | 40.5 | ping-pong ball | 21.0 | starfish | 45.1 |
| axe | 11.8 | computer mouse | 21.2 | head cabbage | 17.4 | pitcher | 19.2 | stethoscope | 18.3 |
| baby bed | 42.0 | corkscrew | 24.2 | helmet | 33.4 | pizza | 43.7 | stove | 8.1 |
| backpack | 2.8 | cream | 29.9 | hippopotamus | 38.0 | plastic bag | 6.4 | strainer | 9.9 |
| bagel | 37.5 | croquet ball | 30.0 | horizontal bar | 7.0 | plate rack | 15.2 | strawberry | 26.8 |
| balance beam | 32.6 | crutch | 23.7 | horse | 41.7 | pomegranate | 32.0 | stretcher | 13.2 |
| banana | 21.9 | cucumber | 22.8 | hotdog | 28.7 | popsicle | 21.2 | sunglasses | 18.8 |
| band aid | 17.4 | cup or mug | 34.0 | iPod | 59.2 | porcupine | 37.2 | swimming trunks | 9.1 |
| banjo | 55.3 | diaper | 10.1 | isopod | 19.5 | power drill | 7.9 | swine | 45.3 |
| baseball | 41.8 | digital clock | 18.5 | jellyfish | 23.7 | pretzel | 24.8 | syringe | 5.7 |
| basketball | 65.3 | dishwasher | 19.9 | koala bear | 44.3 | printer | 21.3 | table | 21.7 |
| bathing cap | 37.2 | dog | 76.8 | ladle | 3.0 | puck | 14.1 | tape player | 21.4 |
| beaker | 11.3 | domestic cat | 44.1 | ladybug | 58.4 | punching bag | 29.4 | tennis ball | 59.1 |
| bear | 62.7 | dragonfly | 27.8 | lamp | 9.1 | purse | 8.0 | tick | 42.6 |
| bee | 52.9 | drum | 19.9 | laptop | 35.4 | rabbit | 71.0 | tie | 24.6 |
| bell pepper | 38.8 | dumbbell | 14.1 | lemon | 33.3 | racket | 16.2 | tiger | 61.8 |
| bench | 12.7 | electric fan | 35.0 | lion | 51.3 | ray | 41.1 | toaster | 29.2 |
| bicycle | 41.1 | elephant | 56.4 | lipstick | 23.1 | red panda | 61.1 | traffic light | 24.7 |
| binder | 6.2 | face powder | 22.1 | lizard | 38.9 | refrigerator | 14.0 | train | 60.8 |
| bird | 70.9 | fig | 44.5 | lobster | 32.4 | remote control | 41.6 | trombone | 13.8 |
| bookshelf | 19.3 | filing cabinet | 20.6 | maillot | 31.0 | rubber eraser | 2.5 | trumpet | 14.4 |
| bow tie | 38.8 | flower pot | 20.2 | maraca | 30.1 | rugby ball | 34.5 | turtle | 59.1 |
| bow | 9.0 | flute | 4.9 | microphone | 4.0 | ruler | 11.5 | tv or monitor | 41.7 |
| bowl | 26.7 | fox | 59.3 | microwave | 40.1 | salt or pepper shaker | 24.6 | unicycle | 27.2 |
| brassiere | 31.2 | french horn | 24.2 | milk can | 33.3 | saxophone | 40.8 | vacuum | 19.5 |
| burrito | 25.7 | frog | 64.1 | miniskirt | 14.9 | scorpion | 57.3 | violin | 13.7 |
| bus | 57.5 | frying pan | 21.5 | monkey | 49.6 | screwdriver | 10.6 | volleyball | 59.7 |
| butterfly | 88.5 | giant panda | 42.5 | motorcycle | 42.2 | seal | 20.9 | waffle iron | 24.0 |
| camel | 37.6 | goldfish | 28.6 | mushroom | 31.8 | sheep | 48.9 | washer | 39.8 |
| can opener | 28.9 | golf ball | 51.3 | nail | 4.5 | ski | 9.0 | water bottle | 8.1 |
| car | 44.5 | golfcart | 47.9 | neck brace | 31.6 | skunk | 57.9 | watercraft | 40.9 |
| cart | 48.0 | guacamole | 32.3 | oboe | 27.5 | snail | 36.2 | whale | 48.6 |
| cattle | 32.3 | guitar | 33.1 | orange | 38.8 | snake | 33.8 | wine bottle | 31.2 |
| cello | 28.9 | hair dryer | 13.0 | otter | 22.2 | snowmobile | 58.8 | zebra | 49.6 |
表 8:ILSVRC2013 检测测试集上的各类平均精度(%)。
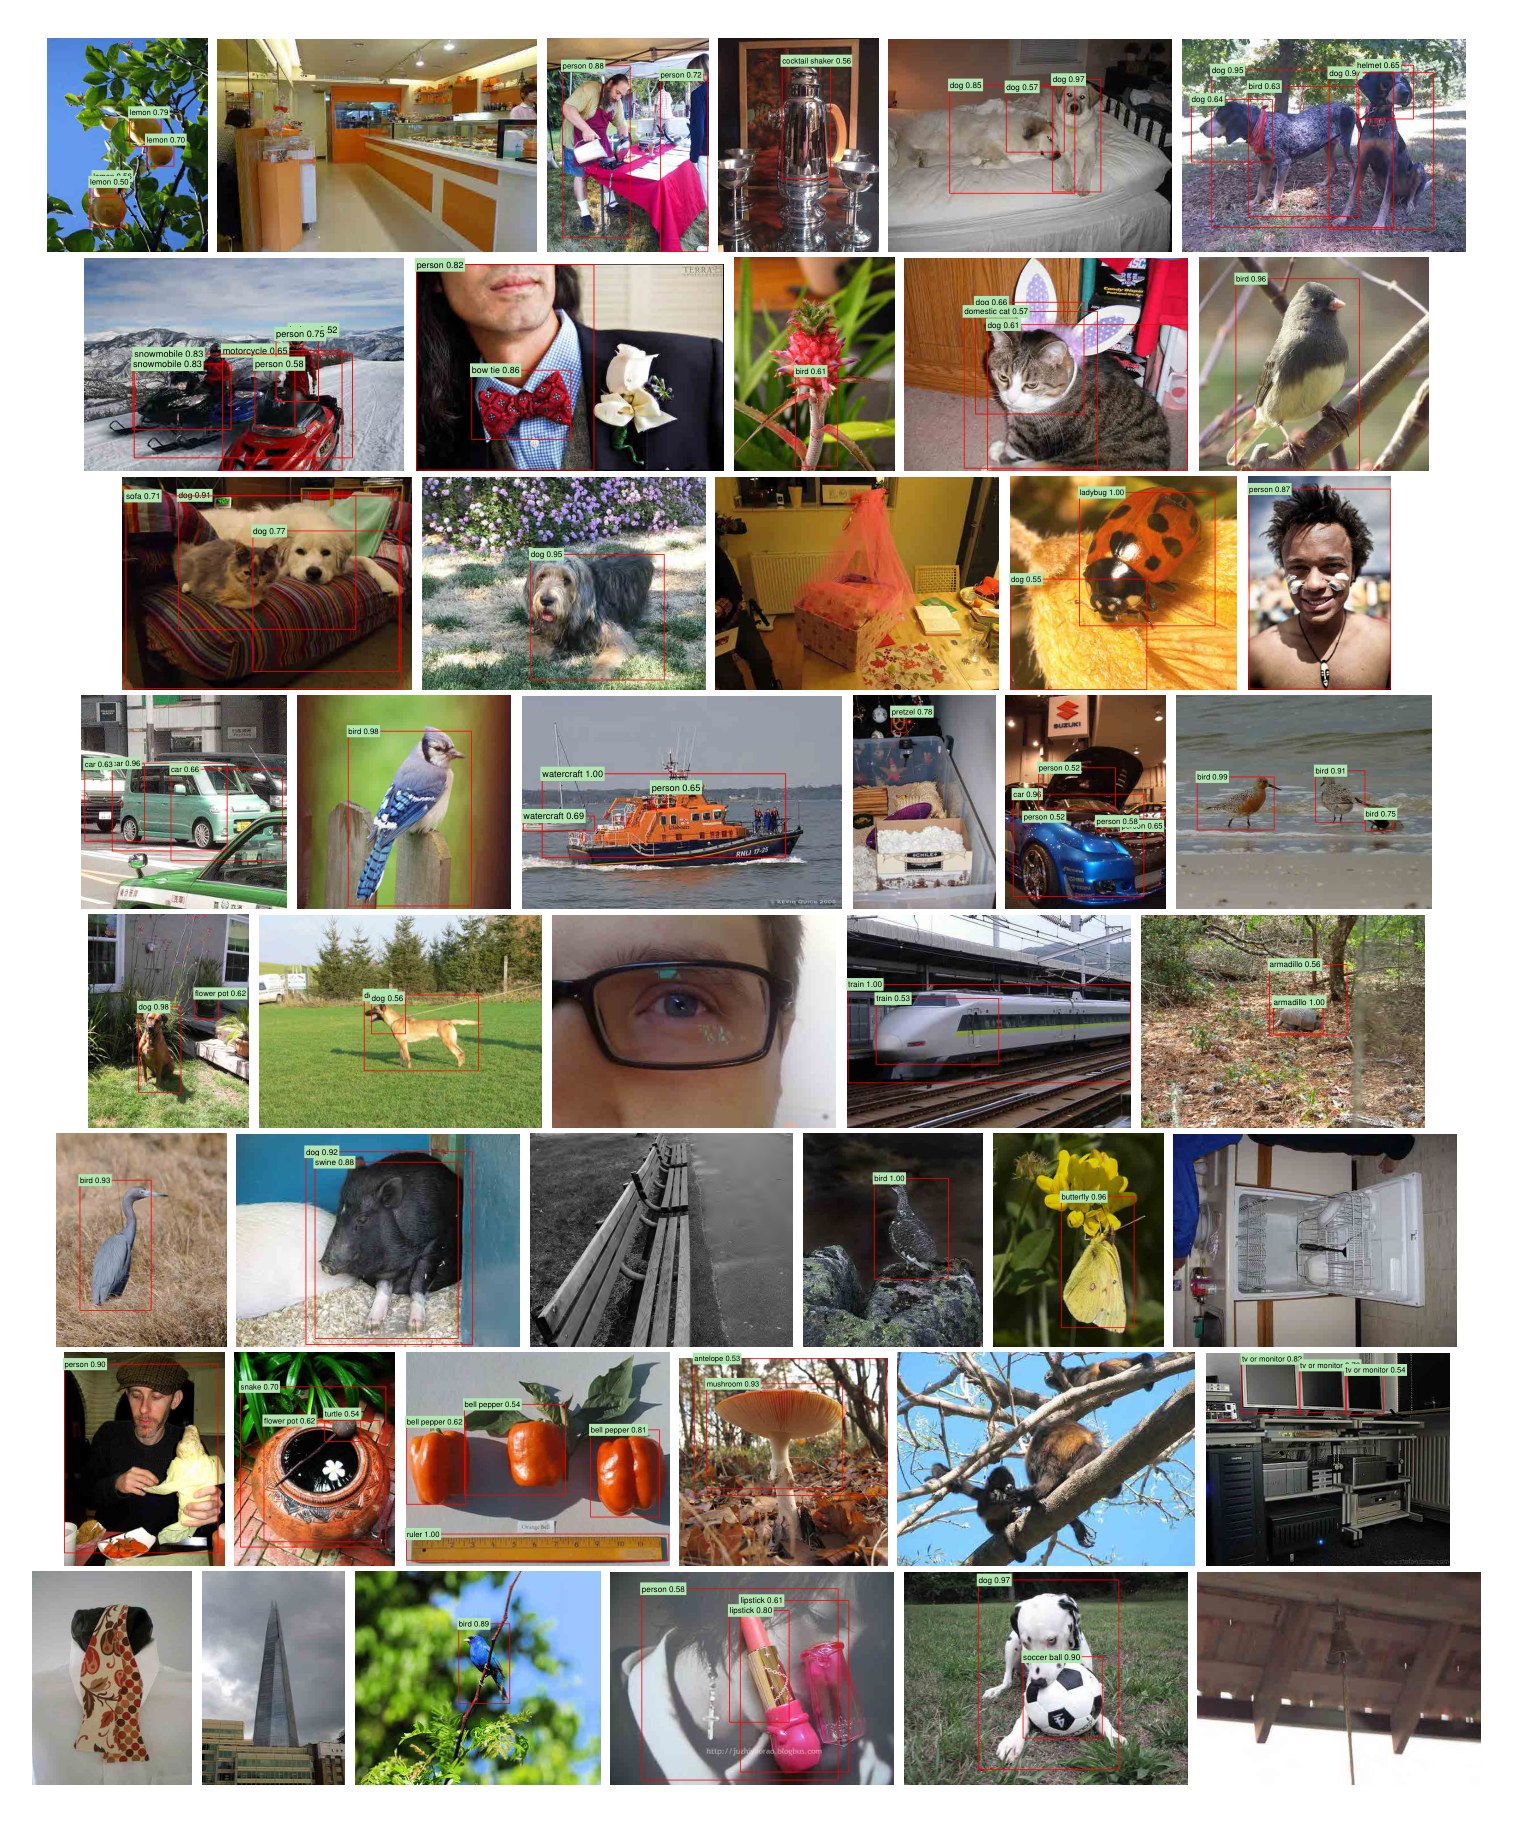
Figure 8: Example detections on the val2 set from the configuration that achieved 31.0% mAP on val2. Each image was sampled randomly (these are not curated). All detections at precision greater than 0.5 are shown. Each detection is labeled with the predicted class and the precision value of that detection from the detector’s precision-recall curve. Viewing digitally with zoom is recommended.
图 8:在 val2 上达到 31.0% mAP 的配置,在 val2 集合上的示例检测。每张图像都是随机抽样的(这些不是经过挑选的)。图中画出精度大于 0.5 的全部检测。每个检测标有预测类别,以及该检测在检测器精度–召回曲线上的精度值。建议在电子版中放大查看。
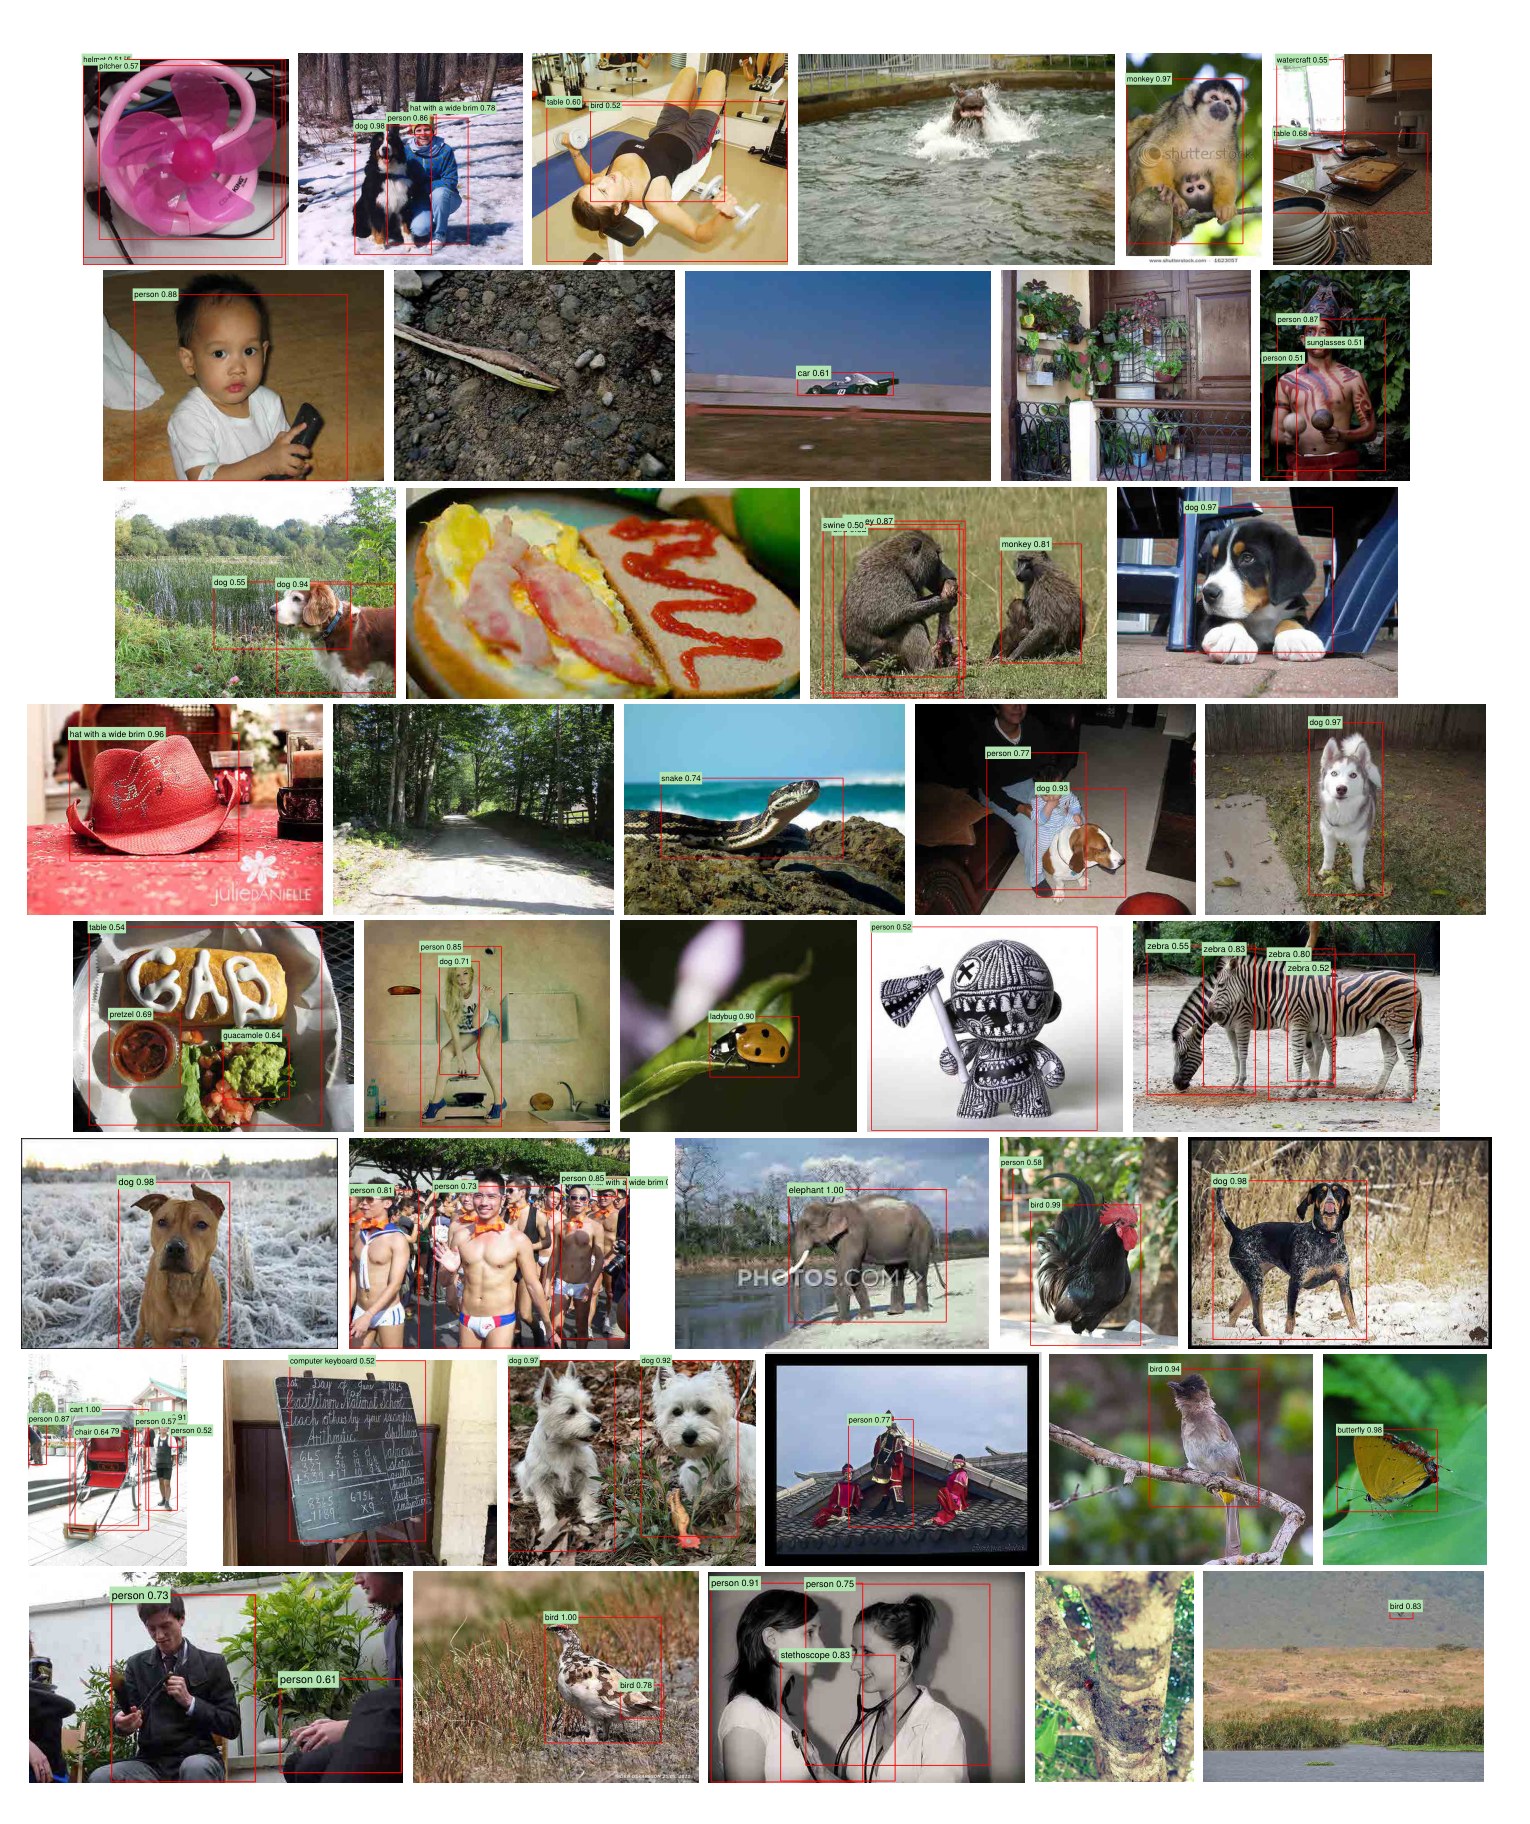
Figure 9: More randomly selected examples. See Figure 8 caption for details. Viewing digitally with zoom is recommended.
图 9:更多随机选取的例子。细节见图 8 的图注。建议在电子版中放大查看。
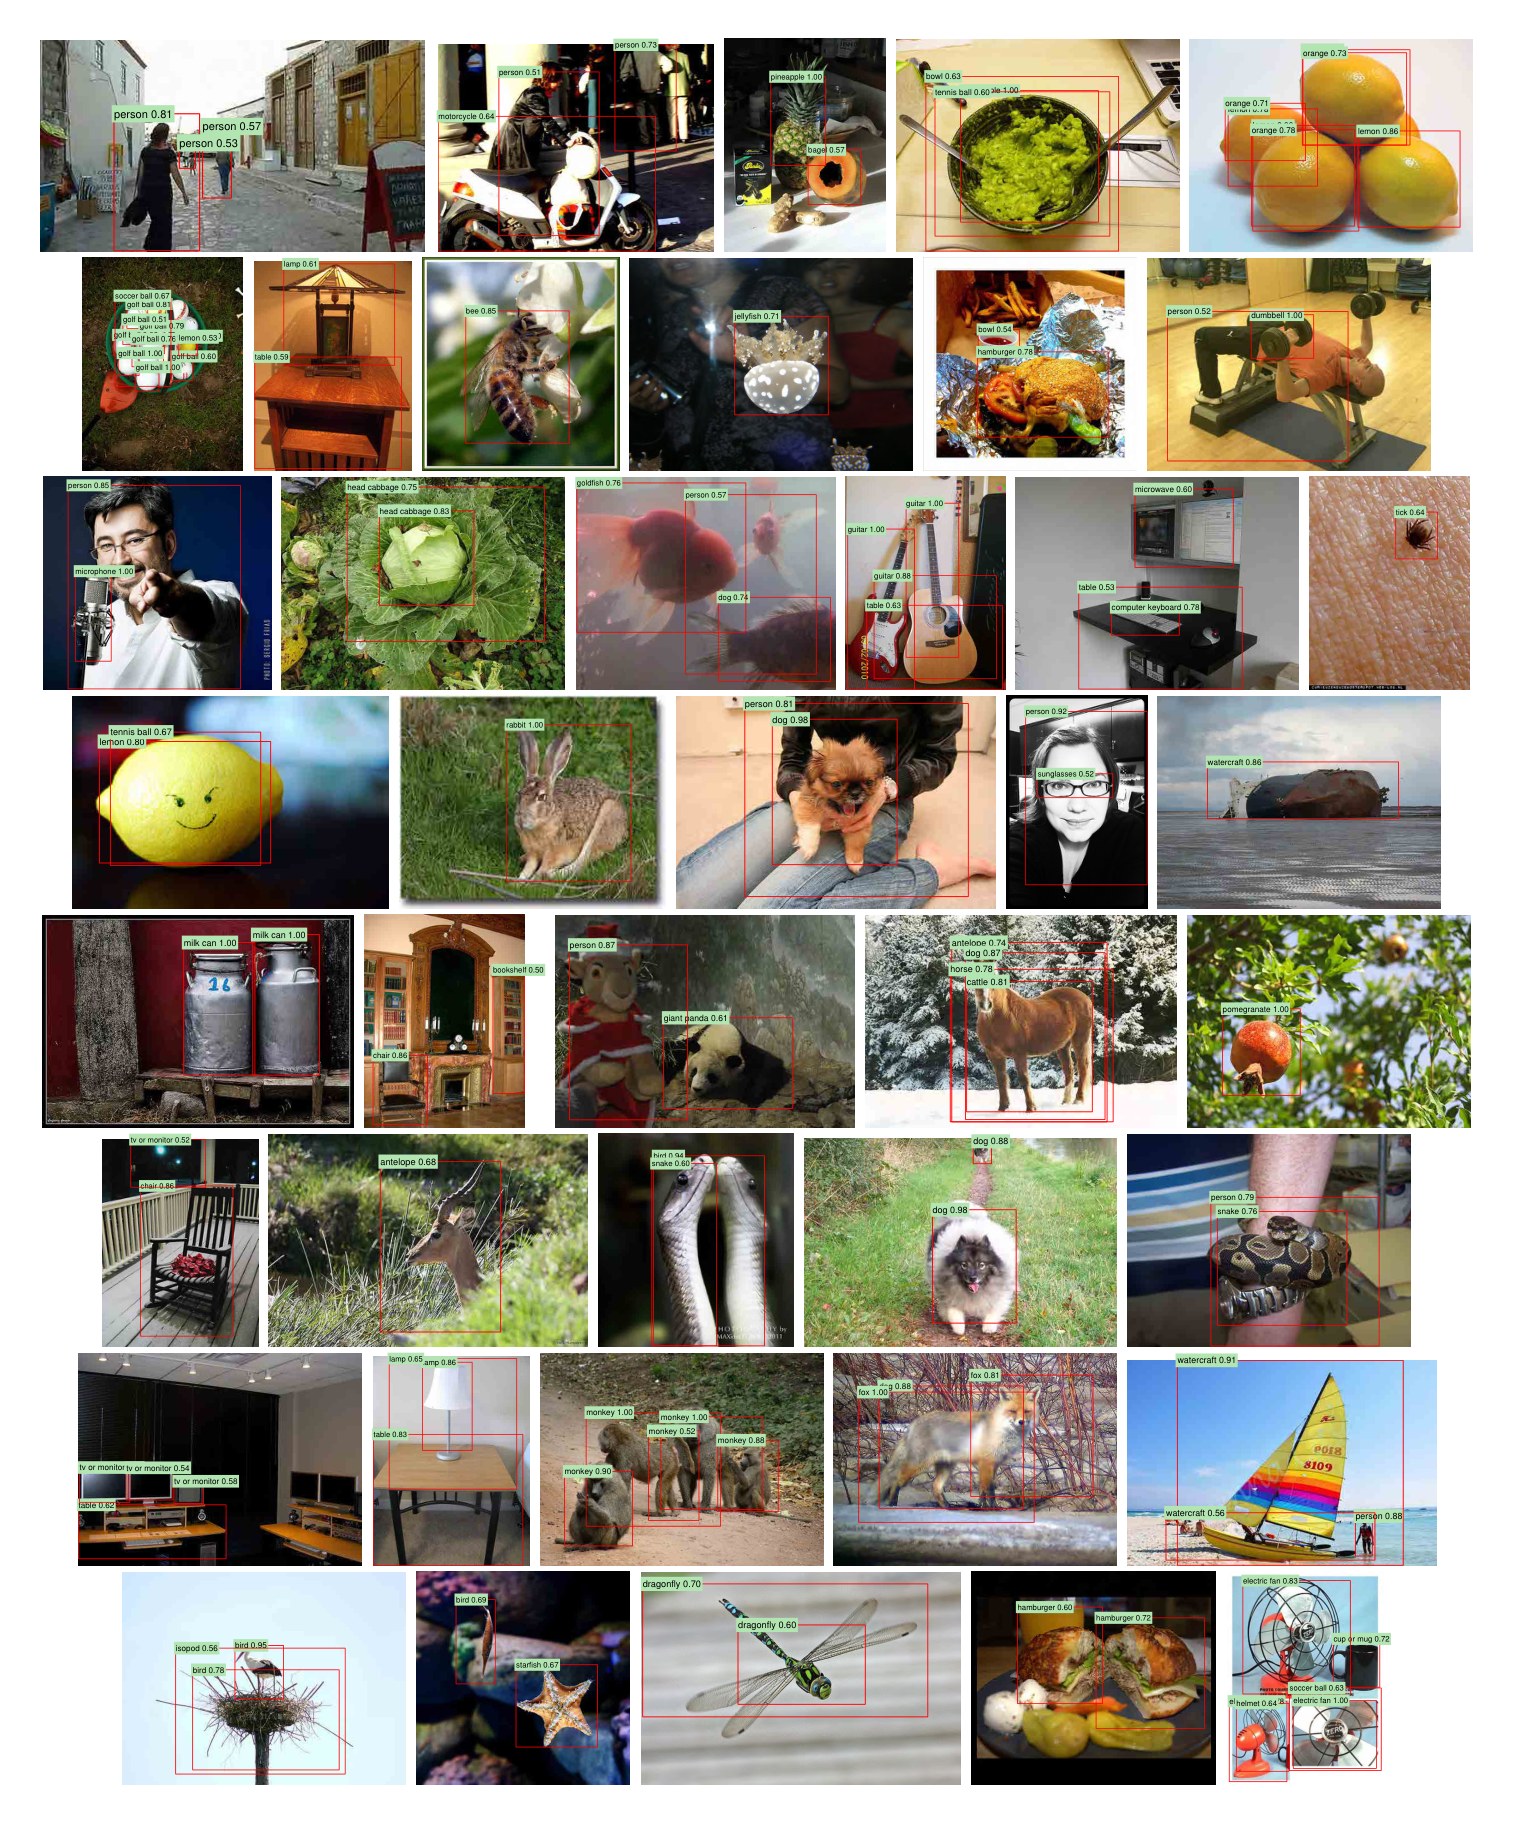
Figure 10: Curated examples. Each image was selected because we found it impressive, surprising, interesting, or amusing. Viewing digitally with zoom is recommended.
图 10:经过挑选的例子。每张图像被选中,是因为我们觉得它令人印象深刻、出人意料、有趣或好笑。建议在电子版中放大查看。
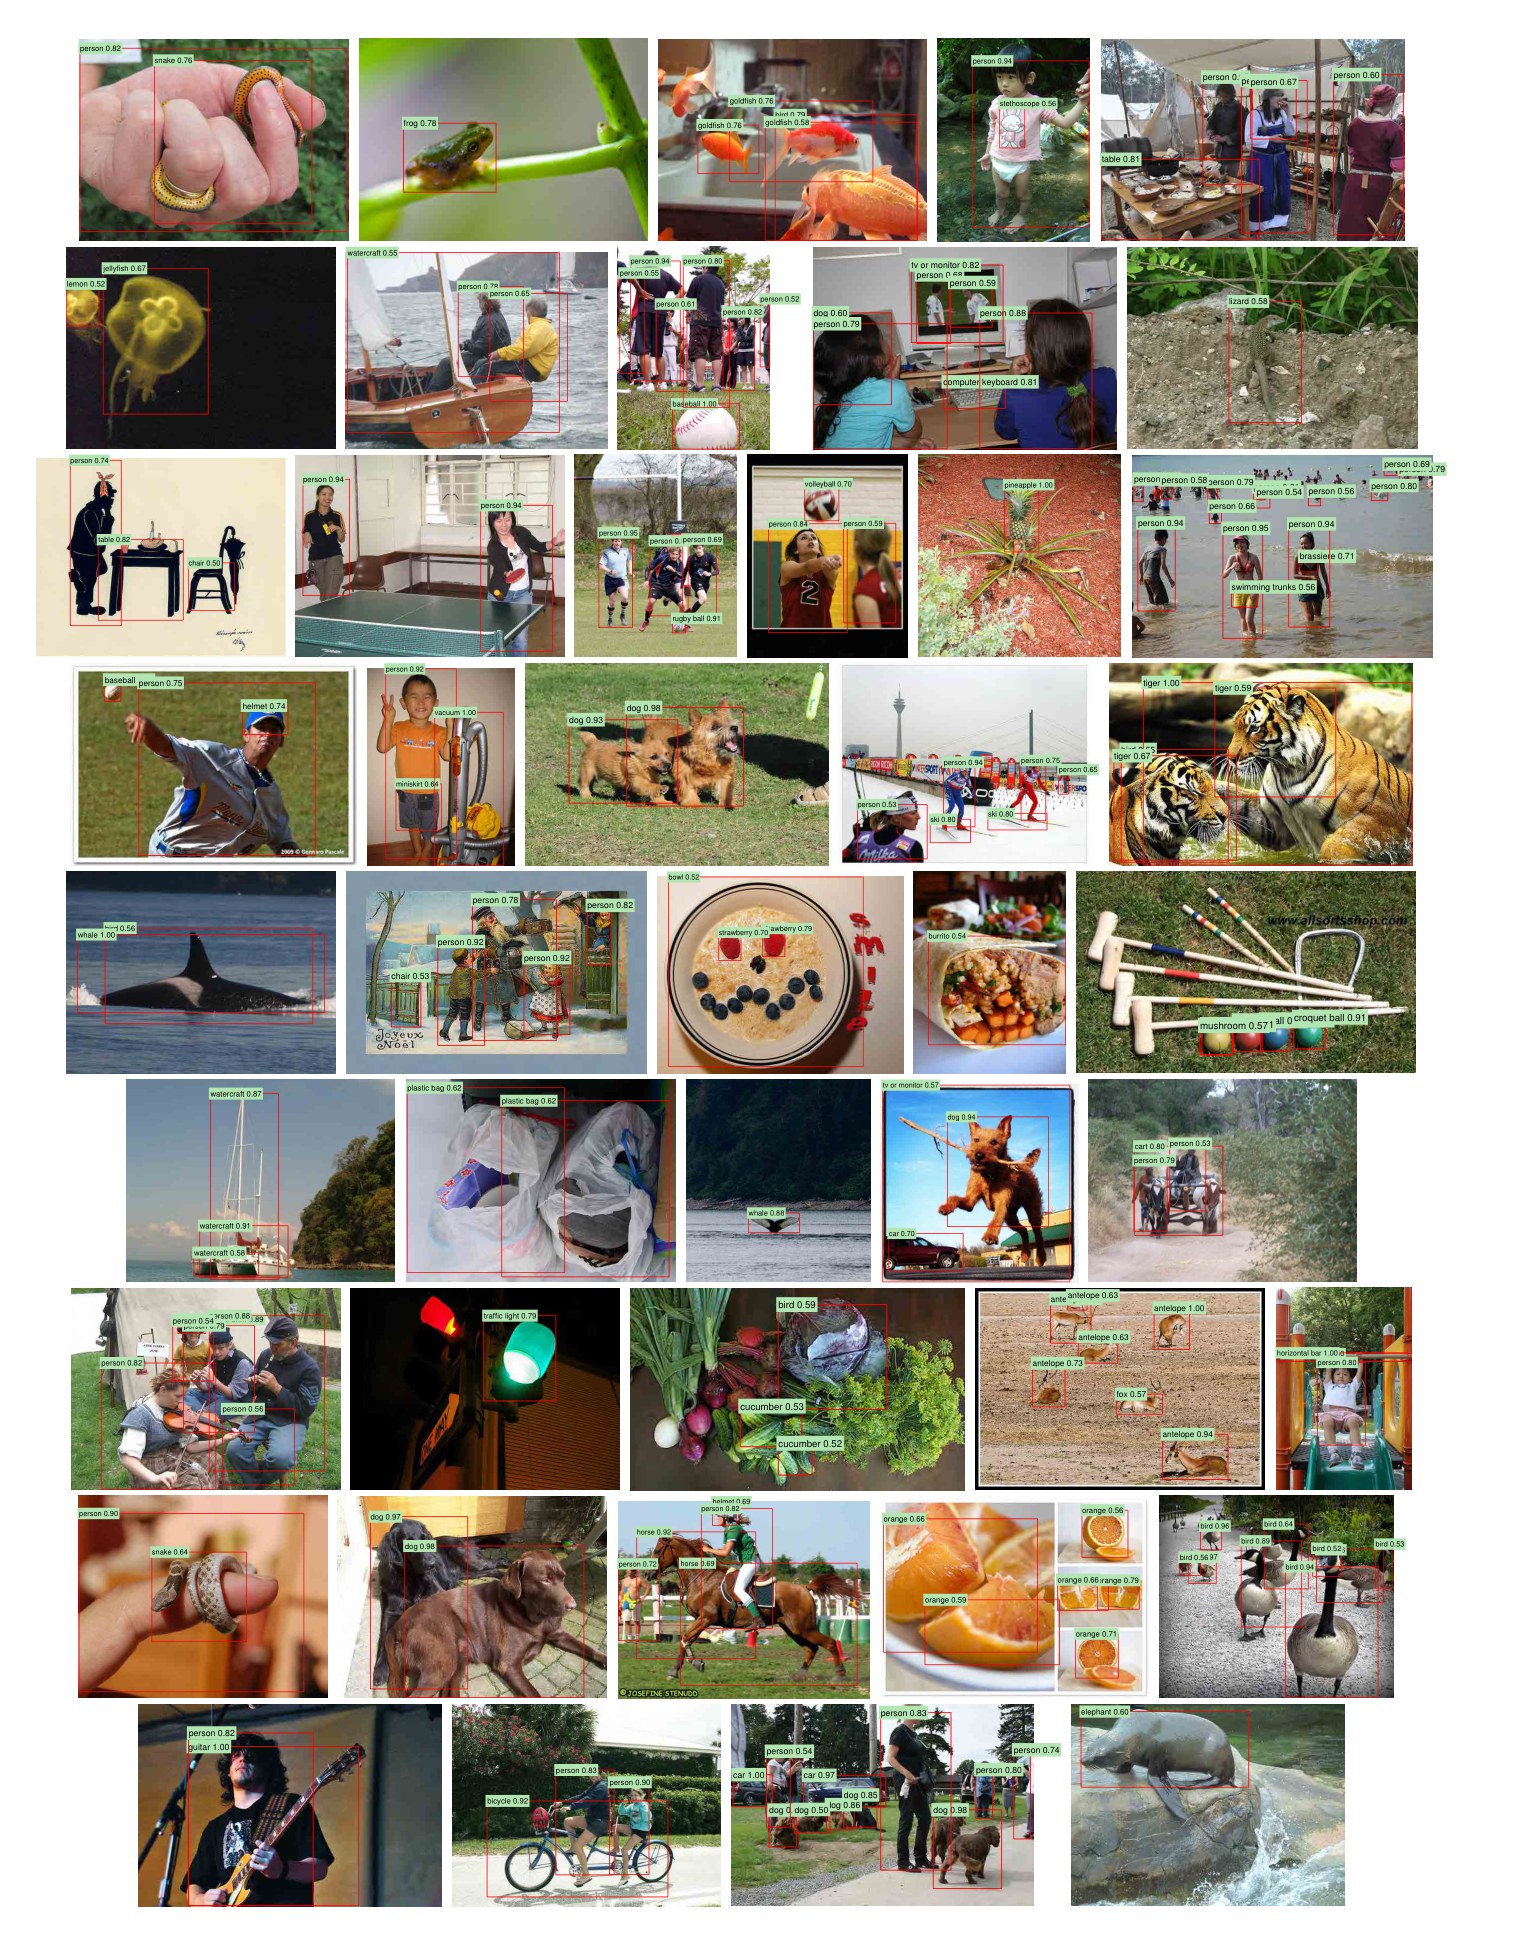
Figure 11: More curated examples. See Figure 10 caption for details. Viewing digitally with zoom is recommended.
图 11:更多经过挑选的例子。细节见图 10 的图注。建议在电子版中放大查看。
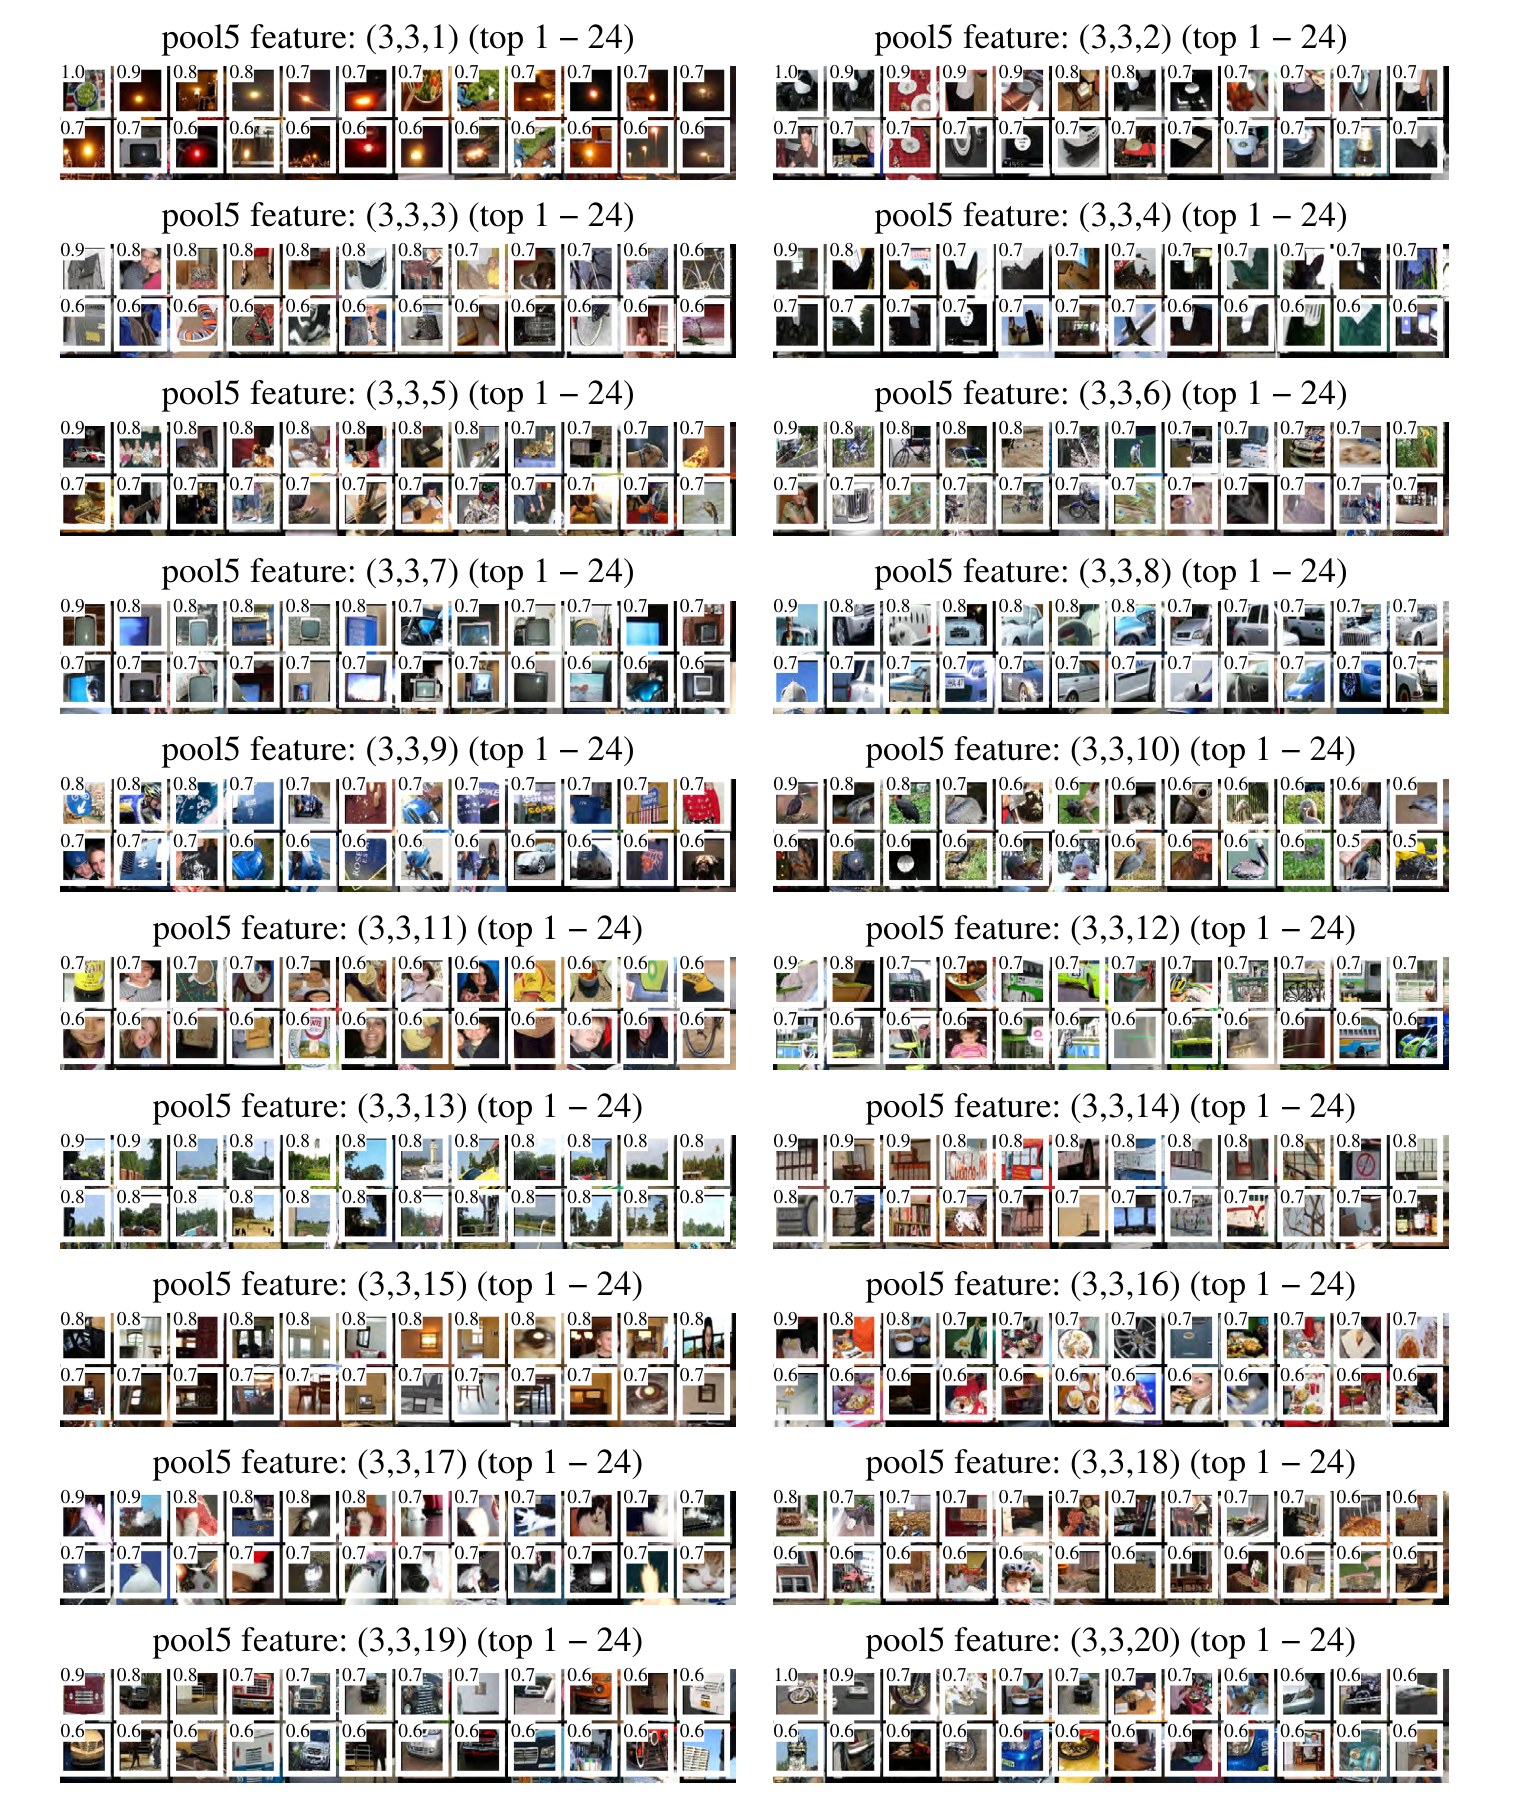
Figure 12: We show the 24 region proposals, out of the approximately 10 million regions in VOC 2007 test, that most strongly activate each of 20 units. Each montage is labeled by the unit’s (y, x, channel) position in the dimensional feature map. Each image region is drawn with an overlay of the unit’s receptive field in white. The activation value (which we normalize by dividing by the max activation value over all units in a channel) is shown in the receptive field’s upper-left corner. Best viewed digitally with zoom.
图 12:我们展示 VOC 2007 测试集大约 1000 万个区域中,最强烈激活 20 个单元中每一个的 24 个区域提议。每组拼图用该单元在 维 特征图中的 位置来标记。每个图像区域都叠加画出该单元的感受野(白色)。激活值(我们把它除以同一通道中所有单元的最大激活值来归一化)标在感受野的左上角。建议在电子版中放大查看。
Appendix G Document changelog
附录 G 文档修订记录
This document tracks the progress of R-CNN. To help readers understand how it has changed over time, here’s a brief changelog describing the revisions.
本文档跟踪 R-CNN 的进展。为帮助读者理解它如何随时间变化,这里给出一份简要的修订记录。
v1
Initial version.
第 1 版
初始版本。
v2
CVPR 2014 camera-ready revision. Includes substantial improvements in detection performance brought about by (1) starting fine-tuning from a higher learning rate (0.001 instead of 0.0001), (2) using context padding when preparing CNN inputs, and (3) bounding-box regression to fix localization errors.
第 2 版
CVPR 2014 相机就绪修订。其中包括由以下三点带来的检测表现的显著提高:(1)从更高的学习率开始微调(0.001 而不是 0.0001),(2)准备 CNN 输入时使用上下文填充,以及(3)用边界框回归来修正定位错误。
v3
Results on the ILSVRC2013 detection dataset and comparison with OverFeat were integrated into several sections (primarily Section 2 and Section 4).
第 3 版
把 ILSVRC2013 检测数据集上的结果以及与 OverFeat 的比较,整合进了若干节(主要是第 2 节和第 4 节)。
v4
The softmax vs. SVM results in Appendix B contained an error, which has been fixed. We thank Sergio Guadarrama for helping to identify this issue.
第 4 版
附录 B 中 softmax 与 SVM 的结果有一处错误,现已修正。我们感谢 Sergio Guadarrama 帮助指出这一问题。
v5
Added results using the new 16-layer network architecture from Simonyan and Zisserman [43] to Section 3.3 and Table 3.
第 5 版
把使用 Simonyan 和 Zisserman [43] 新的 16 层网络结构得到的结果,加入第 3.3 节和表 3。
References
参考文献
[1] B. Alexe, T. Deselaers, and V. Ferrari. Measuring the objectness of image windows. TPAMI , 2012.
[2] P. Arbeláez, B. Hariharan, C. Gu, S. Gupta, L. Bourdev, and J. Malik. Semantic segmentation using regions and parts. In CVPR , 2012.
[3] P. Arbeláez, J. Pont-Tuset, J. Barron, F. Marques, and J. Malik. Multiscale combinatorial grouping. In CVPR , 2014.
[4] J. Carreira, R. Caseiro, J. Batista, and C. Sminchisescu. Semantic segmentation with second-order pooling. In ECCV , 2012.
[5] J. Carreira and C. Sminchisescu. CPMC: Automatic object segmentation using constrained parametric min-cuts. TPAMI , 2012.
[6] D. Cireşan, A. Giusti, L. Gambardella, and J. Schmidhuber. Mitosis detection in breast cancer histology images with deep neural networks. In MICCAI , 2013.
[7] N. Dalal and B. Triggs. Histograms of oriented gradients for human detection. In CVPR , 2005.
[8] T. Dean, M. A. Ruzon, M. Segal, J. Shlens, S. Vijayanarasimhan, and J. Yagnik. Fast, accurate detection of 100,000 object classes on a single machine. In CVPR , 2013.
[9] J. Deng, A. Berg, S. Satheesh, H. Su, A. Khosla, and L. Fei-Fei. ImageNet Large Scale Visual Recognition Competition 2012 (ILSVRC2012). http://www.image-net.org/challenges/LSVRC/2012/ .
[10] J. Deng, W. Dong, R. Socher, L.-J. Li, K. Li, and L. Fei-Fei. ImageNet: A large-scale hierarchical image database. In CVPR , 2009.
[11] J. Deng, O. Russakovsky, J. Krause, M. Bernstein, A. C. Berg, and L. Fei-Fei. Scalable multi-label annotation. In CHI , 2014.
[12] J. Donahue, Y. Jia, O. Vinyals, J. Hoffman, N. Zhang, E. Tzeng, and T. Darrell. DeCAF: A Deep Convolutional Activation Feature for Generic Visual Recognition. In ICML , 2014.
[13] M. Douze, H. Jégou, H. Sandhawalia, L. Amsaleg, and C. Schmid. Evaluation of gist descriptors for web-scale image search. In Proc. of the ACM International Conference on Image and Video Retrieval , 2009.
[14] I. Endres and D. Hoiem. Category independent object proposals. In ECCV , 2010.
[15] M. Everingham, L. Van Gool, C. K. I. Williams, J. Winn, and A. Zisserman. The PASCAL Visual Object Classes (VOC) Challenge. IJCV , 2010.
[16] C. Farabet, C. Couprie, L. Najman, and Y. LeCun. Learning hierarchical features for scene labeling. TPAMI , 2013.
[17] P. Felzenszwalb, R. Girshick, D. McAllester, and D. Ramanan. Object detection with discriminatively trained part based models. TPAMI , 2010.
[18] S. Fidler, R. Mottaghi, A. Yuille, and R. Urtasun. Bottom-up segmentation for top-down detection. In CVPR , 2013.
[19] K. Fukushima. Neocognitron: A self-organizing neural network model for a mechanism of pattern recognition unaffected by shift in position. Biological cybernetics , 36(4):193–202, 1980.
[20] R. Girshick, P. Felzenszwalb, and D. McAllester. Discriminatively trained deformable part models, release 5. http://www.cs.berkeley.edu/~rbg/latent-v5/ .
[21] C. Gu, J. J. Lim, P. Arbeláez, and J. Malik. Recognition using regions. In CVPR , 2009.
[22] B. Hariharan, P. Arbeláez, L. Bourdev, S. Maji, and J. Malik. Semantic contours from inverse detectors. In ICCV , 2011.
[23] D. Hoiem, Y. Chodpathumwan, and Q. Dai. Diagnosing error in object detectors. In ECCV . 2012.
[24] Y. Jia. Caffe: An open source convolutional architecture for fast feature embedding. http://caffe.berkeleyvision.org/ , 2013.
[25] A. Krizhevsky, I. Sutskever, and G. Hinton. ImageNet classification with deep convolutional neural networks. In NIPS , 2012.
[26] Y. LeCun, B. Boser, J. Denker, D. Henderson, R. Howard, W. Hubbard, and L. Jackel. Backpropagation applied to handwritten zip code recognition. Neural Comp. , 1989.
[27] Y. LeCun, L. Bottou, Y. Bengio, and P. Haffner. Gradient-based learning applied to document recognition. Proc. of the IEEE , 1998.
[28] J. J. Lim, C. L. Zitnick, and P. Dollár. Sketch tokens: A learned mid-level representation for contour and object detection. In CVPR , 2013.
[29] D. Lowe. Distinctive image features from scale-invariant keypoints. IJCV , 2004.
[30] A. Oliva and A. Torralba. Modeling the shape of the scene: A holistic representation of the spatial envelope. IJCV , 2001.
[31] X. Ren and D. Ramanan. Histograms of sparse codes for object detection. In CVPR , 2013.
[32] H. A. Rowley, S. Baluja, and T. Kanade. Neural network-based face detection. TPAMI , 1998.
[33] D. E. Rumelhart, G. E. Hinton, and R. J. Williams. Learning internal representations by error propagation. Parallel Distributed Processing , 1:318–362, 1986.
[34] P. Sermanet, D. Eigen, X. Zhang, M. Mathieu, R. Fergus, and Y. LeCun. OverFeat: Integrated Recognition, Localization and Detection using Convolutional Networks. In ICLR , 2014.
[35] P. Sermanet, K. Kavukcuoglu, S. Chintala, and Y. LeCun. Pedestrian detection with unsupervised multi-stage feature learning. In CVPR , 2013.
[36] H. Su, J. Deng, and L. Fei-Fei. Crowdsourcing annotations for visual object detection. In AAAI Technical Report, 4th Human Computation Workshop , 2012.
[37] K. Sung and T. Poggio. Example-based learning for view-based human face detection. Technical Report A.I. Memo No. 1521, Massachussets Institute of Technology, 1994.
[38] C. Szegedy, A. Toshev, and D. Erhan. Deep neural networks for object detection. In NIPS , 2013.
[39] J. Uijlings, K. van de Sande, T. Gevers, and A. Smeulders. Selective search for object recognition. IJCV , 2013.
[40] R. Vaillant, C. Monrocq, and Y. LeCun. Original approach for the localisation of objects in images. IEE Proc on Vision, Image, and Signal Processing , 1994.
[41] X. Wang, M. Yang, S. Zhu, and Y. Lin. Regionlets for generic object detection. In ICCV , 2013.
[42] M. Zeiler, G. Taylor, and R. Fergus. Adaptive deconvolutional networks for mid and high level feature learning. In CVPR , 2011.
[43] K. Simonyan and A. Zisserman. Very Deep Convolutional Networks for Large-Scale Image Recognition. arXiv preprint , arXiv:1409.1556, 2014.