Progressive Growing of GANs for Improved Quality, Stability, and Variation
Progressive Growing of GANs for Improved Quality, Stability, and Variation
渐进式增长 GAN:提升质量、稳定性与多样性
Tero Karras Affiliation: NVIDIA Email: {tkarras,taila,slaine,jlehtinen}@nvidia.com Timo Aila Affiliation: NVIDIA Samuli Laine Affiliation: NVIDIA Jaakko Lehtinen Affiliation: NVIDIA and Aalto University
Abstract
摘要
We describe a new training methodology for generative adversarial networks. The key idea is to grow both the generator and discriminator progressively: starting from a low resolution, we add new layers that model increasingly fine details as training progresses. This both speeds the training up and greatly stabilizes it, allowing us to produce images of unprecedented quality, e.g., CelebA images at . We also propose a simple way to increase the variation in generated images, and achieve a record inception score of in unsupervised CIFAR10. Additionally, we describe several implementation details that are important for discouraging unhealthy competition between the generator and discriminator. Finally, we suggest a new metric for evaluating GAN results, both in terms of image quality and variation. As an additional contribution, we construct a higher-quality version of the CelebA dataset.
我们描述一种新的生成对抗网络训练方法。核心想法是让生成器与判别器渐进式增长:从低分辨率起步,随着训练推进逐步加入建模更精细细节的新层。这既加快训练,也大幅稳定训练,使我们能生成前所未有质量的图像,例如 的 CelebA 图像。我们还提出一种简单方法以增加生成图像的多样性,并在无监督 CIFAR10 上取得创纪录的 inception score 。此外,我们说明若干有助于抑制生成器与判别器之间不良竞争的实现细节。最后,我们提出一种同时从图像质量与多样性两方面评估 GAN 结果的新指标。作为额外贡献,我们构建了更高质量版本的 CelebA 数据集。
1 Introduction
1 引言
Generative methods that produce novel samples from high-dimensional data distributions, such as images, are finding widespread use, for example in speech synthesis (van den Oord et al., 2016a), image-to-image translation (Zhu et al., 2017; Liu et al., 2017; Wang et al., 2017), and image inpainting (Iizuka et al., 2017). Currently the most prominent approaches are autoregressive models (van den Oord et al., 2016b; van den Oord et al., 2016c), variational autoencoders (VAE) (Kingma & Welling, 2014), and generative adversarial networks (GAN) (Goodfellow et al., 2014). Currently they all have significant strengths and weaknesses. Autoregressive models – such as PixelCNN – produce sharp images but are slow to evaluate and do not have a latent representation as they directly model the conditional distribution over pixels, potentially limiting their applicability. VAEs are easy to train but tend to produce blurry results due to restrictions in the model, although recent work is improving this (Kingma et al., 2016). GANs produce sharp images, albeit only in fairly small resolutions and with somewhat limited variation, and the training continues to be unstable despite recent progress (Salimans et al., 2016; Gulrajani et al., 2017; Berthelot et al., 2017; Kodali et al., 2017). Hybrid methods combine various strengths of the three, but so far lag behind GANs in image quality (Makhzani & Frey, 2017; Ulyanov et al., 2017; Dumoulin et al., 2016).
从图像等高维数据分布中生成新样本的生成方法正被广泛使用,例如语音合成(van den Oord 等人,2016a)、图像到图像翻译(Zhu 等人,2017;Liu 等人,2017;Wang 等人,2017)以及图像修复(Iizuka 等人,2017)。当前最突出的路径是自回归模型(van den Oord 等人,2016b;van den Oord 等人,2016c)、变分自编码器(VAE)(Kingma & Welling,2014)以及生成对抗网络(GAN)(Goodfellow 等人,2014)。它们目前都各有显著长短。自回归模型——如 PixelCNN——能产生锐利图像,但评估慢,且因直接建模像素条件分布而没有潜表示,可能限制适用面。VAE 易于训练,但受模型限制往往结果模糊,尽管近期工作正在改善(Kingma 等人,2016)。GAN 能产生锐利图像,但分辨率仍偏小、多样性有限,且尽管近期有进展,训练仍不稳定(Salimans 等人,2016;Gulrajani 等人,2017;Berthelot 等人,2017;Kodali 等人,2017)。混合方法结合三者的多种长处,但迄今在图像质量上仍落后于 GAN(Makhzani & Frey,2017;Ulyanov 等人,2017;Dumoulin 等人,2016)。
Typically, a GAN consists of two networks: generator and discriminator (aka critic). The generator produces a sample, e.g., an image, from a latent code, and the distribution of these images should ideally be indistinguishable from the training distribution. Since it is generally infeasible to engineer a function that tells whether that is the case, a discriminator network is trained to do the assessment, and since networks are differentiable, we also get a gradient we can use to steer both networks to the right direction. Typically, the generator is of main interest – the discriminator is an adaptive loss function that gets discarded once the generator has been trained.
典型地,GAN 由两个网络组成:生成器与判别器(又称 critic)。生成器从潜码产生样本(例如图像),这些图像的分布理想上应与训练分布不可区分。由于通常难以手工设计判断是否如此的函数,便训练一个判别器网络来做评估;又因网络可微,我们还能得到梯度,用以把两个网络都推向正确方向。通常主要兴趣在生成器——判别器是自适应损失函数,生成器训练完成后即可丢弃。
There are multiple potential problems with this formulation. When we measure the distance between the training distribution and the generated distribution, the gradients can point to more or less random directions if the distributions do not have substantial overlap, i.e., are too easy to tell apart (Arjovsky & Bottou, 2017). Originally, Jensen-Shannon divergence was used as a distance metric (Goodfellow et al., 2014), and recently that formulation has been improved (Hjelm et al., 2017) and a number of more stable alternatives have been proposed, including least squares (Mao et al., 2016b), absolute deviation with margin (Zhao et al., 2017), and Wasserstein distance (Arjovsky et al., 2017; Gulrajani et al., 2017). Our contributions are largely orthogonal to this ongoing discussion, and we primarily use the improved Wasserstein loss, but also experiment with least-squares loss.
这一表述有多种潜在问题。当我们度量训练分布与生成分布之间的距离时,若两分布没有实质性重叠、即太容易区分,梯度可能指向或多或少随机的方向(Arjovsky & Bottou,2017)。最初用 Jensen-Shannon 散度作距离度量(Goodfellow 等人,2014);近期该表述得到改进(Hjelm 等人,2017),并有若干更稳定的替代被提出,包括最小二乘(Mao 等人,2016b)、带间隔的绝对偏差(Zhao 等人,2017)以及 Wasserstein 距离(Arjovsky 等人,2017;Gulrajani 等人,2017)。我们的贡献大体与这场进行中的讨论正交;我们主要使用改进的 Wasserstein 损失,也实验了最小二乘损失。
The generation of high-resolution images is difficult because higher resolution makes it easier to tell the generated images apart from training images (Odena et al., 2017), thus drastically amplifying the gradient problem. Large resolutions also necessitate using smaller minibatches due to memory constraints, further compromising training stability. Our key insight is that we can grow both the generator and discriminator progressively, starting from easier low-resolution images, and add new layers that introduce higher-resolution details as the training progresses. This greatly speeds up training and improves stability in high resolutions, as we will discuss in Section 2.
高分辨率图像生成之所以困难,是因为更高分辨率使生成图像更容易与训练图像区分(Odena 等人,2017),从而急剧放大梯度问题。大分辨率还因内存限制而必须使用更小的小批量,进一步损害训练稳定性。我们的关键洞见是:可以从更容易的低分辨率图像起步,让生成器与判别器都渐进式增长,并在训练推进时加入引入更高分辨率细节的新层。这将大幅加快训练并改善高分辨率下的稳定性,见第 2 节讨论。
The GAN formulation does not explicitly require the entire training data distribution to be represented by the resulting generative model. The conventional wisdom has been that there is a tradeoff between image quality and variation, but that view has been recently challenged (Odena et al., 2017). The degree of preserved variation is currently receiving attention and various methods have been suggested for measuring it, including inception score (Salimans et al., 2016), multi-scale structural similarity (MS-SSIM) (Odena et al., 2017; Wang et al., 2003), birthday paradox (Arora & Zhang, 2017), and explicit tests for the number of discrete modes discovered (Metz et al., 2016). We will describe our method for encouraging variation in Section 3, and propose a new metric for evaluating the quality and variation in Section 5.
GAN 表述并不显式要求最终生成模型覆盖整个训练数据分布。传统看法认为图像质量与多样性之间存在权衡,但这一观点近期受到挑战(Odena 等人,2017)。保留多样性的程度正受到关注,已有多种度量方法被提出,包括 inception score(Salimans 等人,2016)、多尺度结构相似性(MS-SSIM)(Odena 等人,2017;Wang 等人,2003)、生日悖论(Arora & Zhang,2017),以及对发现的离散模态数量的显式测试(Metz 等人,2016)。我们将在第 3 节描述鼓励多样性的方法,并在第 5 节提出评估质量与多样性的新指标。
Section 4.1 discusses a subtle modification to the initialization of networks, leading to a more balanced learning speed for different layers. Furthermore, we observe that mode collapses traditionally plaguing GANs tend to happen very quickly, over the course of a dozen minibatches. Commonly they start when the discriminator overshoots, leading to exaggerated gradients, and an unhealthy competition follows where the signal magnitudes escalate in both networks. We propose a mechanism to stop the generator from participating in such escalation, overcoming the issue (Section 4.2).
第 4.1 节讨论对网络初始化的一处细微修改,使不同层的学习速度更均衡。此外,我们观察到传统困扰 GAN 的模态崩塌往往在十几次小批量内迅速发生。它们通常始于判别器过冲,导致夸张梯度,随后双方信号幅度螺旋上升,形成不良竞争。我们提出一种机制阻止生成器参与这种升级,从而克服该问题(第 4.2 节)。
We evaluate our contributions using the CelebA, LSUN, CIFAR10 datasets. We improve the best published inception score for CIFAR10. Since the datasets commonly used in benchmarking generative methods are limited to a fairly low resolution, we have also created a higher quality version of the CelebA dataset that allows experimentation with output resolutions up to pixels. This dataset and our full implementation are available at https://github.com/tkarras/progressive_growing_of_gans, trained networks can be found at https://drive.google.com/open?id=0B4qLcYyJmiz0NHFULTdYc05lX0U along with result images, and a supplementary video illustrating the datasets, additional results, and latent space interpolations is at https://youtu.be/G06dEcZ-QTg.
我们用 CelebA、LSUN、CIFAR10 数据集评估贡献,并改进了 CIFAR10 上已发表的最佳 inception score。由于生成方法基准常用的数据集分辨率偏低,我们还创建了更高质量版本的 CelebA 数据集,支持高达 像素的输出分辨率实验。该数据集与我们的完整实现见 https://github.com/tkarras/progressive_growing_of_gans;训练好的网络与结果图像见 https://drive.google.com/open?id=0B4qLcYyJmiz0NHFULTdYc05lX0U;展示数据集、额外结果与潜空间插值的补充视频见 https://youtu.be/G06dEcZ-QTg。
2 Progressive growing of GANs
2 GAN 的渐进式增长
Our primary contribution is a training methodology for GANs where we start with low-resolution images, and then progressively increase the resolution by adding layers to the networks as visualized in Figure 1. This incremental nature allows the training to first discover large-scale structure of the image distribution and then shift attention to increasingly finer scale detail, instead of having to learn all scales simultaneously.
我们的主要贡献是一种 GAN 训练方法:从低分辨率图像起步,再如图 1 所示通过向网络加入层来渐进提高分辨率。这种增量性质使训练先发现图像分布的大尺度结构,再把注意力转向日益精细的尺度细节,而不是必须同时学习所有尺度。
We use generator and discriminator networks that are mirror images of each other and always grow in synchrony. All existing layers in both networks remain trainable throughout the training process. When new layers are added to the networks, we fade them in smoothly, as illustrated in Figure 2. This avoids sudden shocks to the already well-trained, smaller-resolution layers. Appendix A describes structure of the generator and discriminator in detail, along with other training parameters.
我们使用互为镜像的生成器与判别器网络,并始终同步增长。两个网络中所有已有层在整个训练过程中保持可训练。向网络加入新层时,我们如图 2 所示平滑淡入,以避免对已经训好的较小分辨率层造成突然冲击。附录 A 详细描述生成器与判别器结构以及其他训练参数。
We observe that the progressive training has several benefits. Early on, the generation of smaller images is substantially more stable because there is less class information and fewer modes (Odena et al., 2017). By increasing the resolution little by little we are continuously asking a much simpler question compared to the end goal of discovering a mapping from latent vectors to e.g. images. This approach has conceptual similarity to recent work by Chen & Koltun (2017). In practice it stabilizes the training sufficiently for us to reliably synthesize megapixel-scale images using WGAN-GP loss (Gulrajani et al., 2017) and even LSGAN loss (Mao et al., 2016b).
我们观察到渐进式训练有若干好处。早期生成较小图像明显更稳定,因为类别信息更少、模态更少(Odena 等人,2017)。一点点提高分辨率,等于持续提出比最终目标——发现从潜向量到例如 图像的映射——简单得多的问题。这一思路与 Chen & Koltun(2017)的近期工作有概念相似性。实践中它足以稳定训练,使我们能用 WGAN-GP 损失(Gulrajani 等人,2017)乃至 LSGAN 损失(Mao 等人,2016b)可靠地合成百万像素级图像。
Another benefit is the reduced training time. With progressively growing GANs most of the iterations are done at lower resolutions, and comparable result quality is often obtained up to 2–6 times faster, depending on the final output resolution.
另一好处是缩短训练时间。渐进式增长 GAN 中,多数迭代在较低分辨率完成;按最终输出分辨率不同,常可在相当结果质量下快约 2–6 倍。
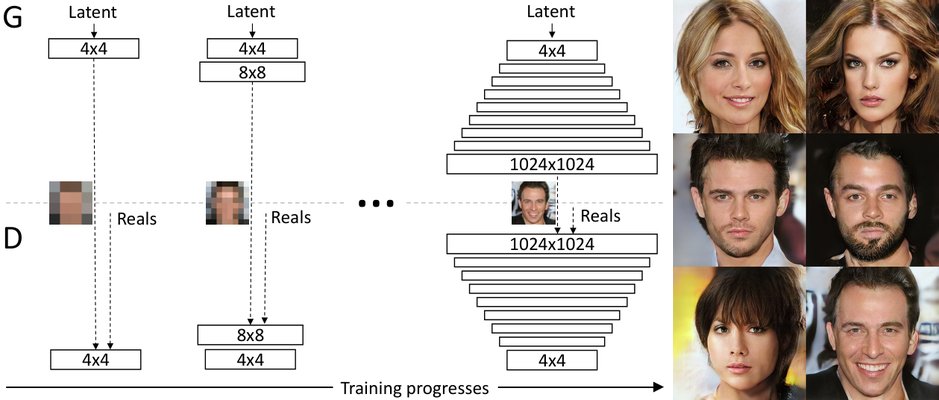
Figure 1: Our training starts with both the generator (G) and discriminator (D) having a low spatial resolution of 44 pixels. As the training advances, we incrementally add layers to G and D, thus increasing the spatial resolution of the generated images. All existing layers remain trainable throughout the process. Here refers to convolutional layers operating on spatial resolution. This allows stable synthesis in high resolutions and also speeds up training considerably. One the right we show six example images generated using progressive growing at .
图 1:训练开始时,生成器(G)与判别器(D)的空间分辨率均为 44 像素。随着训练推进,我们逐步向 G 与 D 加入层,从而提高生成图像的空间分辨率。所有已有层在整个过程中保持可训练。此处 指在 空间分辨率上运算的卷积层。这使高分辨率合成更稳定,也显著加快训练。右侧展示用渐进式增长在 生成的六张示例图像。
The idea of growing GANs progressively is related to the work of Wang et al. (2017), who use multiple discriminators that operate on different spatial resolutions. That work in turn is motivated by Durugkar et al. (2016) who use one generator and multiple discriminators concurrently, and Ghosh et al. (2017) who do the opposite with multiple generators and one discriminator. Hierarchical GANs (Denton et al., 2015; Huang et al., 2016; Zhang et al., 2017) define a generator and discriminator for each level of an image pyramid. These methods build on the same observation as our work – that the complex mapping from latents to high-resolution images is easier to learn in steps – but the crucial difference is that we have only a single GAN instead of a hierarchy of them. In contrast to early work on adaptively growing networks, e.g., growing neural gas (Fritzke, 1995) and neuro evolution of augmenting topologies (Stanley & Miikkulainen, 2002) that grow networks greedily, we simply defer the introduction of pre-configured layers. In that sense our approach resembles layer-wise training of autoencoders (Bengio et al., 2007).
渐进式增长 GAN 的想法与 Wang 等人(2017)相关:他们使用在不同空间分辨率上运作的多个判别器。该工作又受 Durugkar 等人(2016)(一个生成器与多个判别器并行)以及 Ghosh 等人(2017)(多个生成器与一个判别器)启发。分层 GAN(Denton 等人,2015;Huang 等人,2016;Zhang 等人,2017)为图像金字塔的每一级定义生成器与判别器。这些方法与我们的工作基于同一观察——从潜变量到高分辨率图像的复杂映射分步学习更容易——但关键区别是我们只有单个 GAN,而非一整套层次。相对早期自适应增长网络的工作,例如增长神经气(Fritzke,1995)与增强拓扑的神经演化(Stanley & Miikkulainen,2002)那种贪婪增长,我们只是推迟引入预先配置好的层。在此意义上,我们的方法类似自编码器的逐层训练(Bengio 等人,2007)。
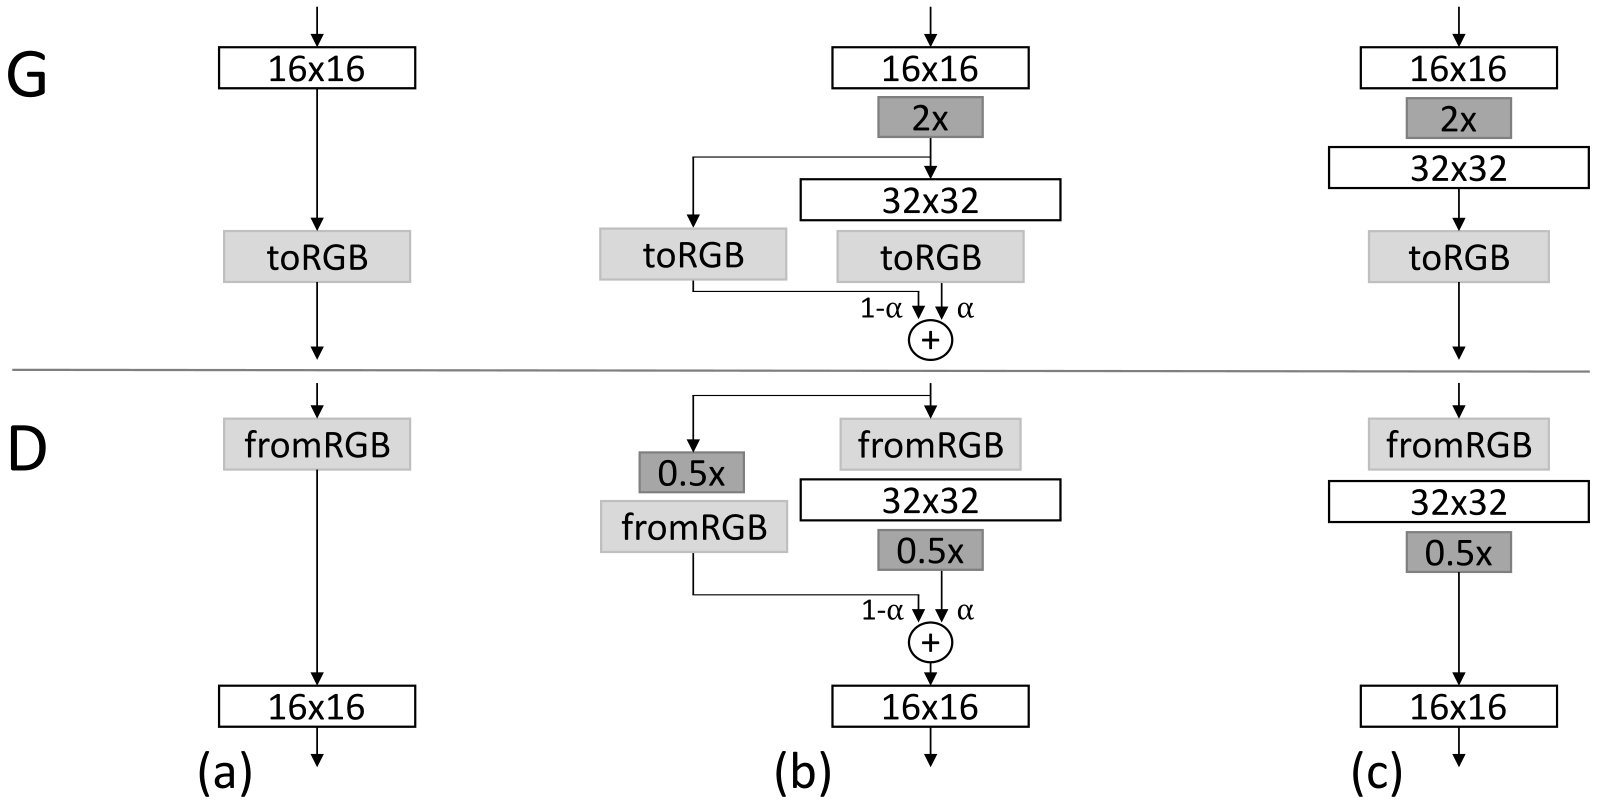
Figure 2: When doubling the resolution of the generator (G) and discriminator (D) we fade in the new layers smoothly. This example illustrates the transition from images (a) to images (c). During the transition (b) we treat the layers that operate on the higher resolution like a residual block, whose weight increases linearly from to . Here and refer to doubling and halving the image resolution using nearest neighbor filtering and average pooling, respectively. The toRGB represents a layer that projects feature vectors to RGB colors and fromRGB does the reverse; both use convolutions. When training the discriminator, we feed in real images that are downscaled to match the current resolution of the network. During a resolution transition, we interpolate between two resolutions of the real images, similarly to how the generator output combines two resolutions.
图 2:当生成器(G)与判别器(D)分辨率翻倍时,我们平滑淡入新层。本例说明从 图像(a)过渡到 图像(c)。过渡期间(b),我们把在更高分辨率上运算的层当作残差块处理,其权重 从 线性增至 。此处 与 分别指用最近邻滤波加倍分辨率、用平均池化减半分辨率。toRGB 表示把特征向量投影到 RGB 颜色的层,fromRGB 则相反;二者都用 卷积。训练判别器时,我们把真实图像下采样到与网络当前分辨率匹配。分辨率过渡期间,我们在真实图像的两种分辨率之间插值,方式类似于生成器输出如何组合两种分辨率。
3 Increasing variation using minibatch standard deviation
3 用小批量标准差增加多样性
GANs have a tendency to capture only a subset of the variation found in training data, and Salimans et al. (2016) suggest “minibatch discrimination” as a solution. They compute feature statistics not only from individual images but also across the minibatch, thus encouraging the minibatches of generated and training images to show similar statistics. This is implemented by adding a minibatch layer towards the end of the discriminator, where the layer learns a large tensor that projects the input activation to an array of statistics. A separate set of statistics is produced for each example in a minibatch and it is concatenated to the layer’s output, so that the discriminator can use the statistics internally. We simplify this approach drastically while also improving the variation.
GAN 往往只捕捉训练数据中多样性的一个子集,Salimans 等人(2016)建议用“小批量判别”作为解决办法。他们不仅从单张图像、也跨小批量计算特征统计量,从而鼓励生成图像与训练图像的小批量呈现相似统计。实现方式是在判别器靠近末端加入小批量层:该层学习一个大张量,把输入激活投影到一组统计量。小批量中每个样本产生单独一组统计量,并拼接到该层输出,使判别器能在内部使用这些统计量。我们大幅简化这一方法,同时进一步改善多样性。
Our simplified solution has neither learnable parameters nor new hyperparameters. We first compute the standard deviation for each feature in each spatial location over the minibatch. We then average these estimates over all features and spatial locations to arrive at a single value. We replicate the value and concatenate it to all spatial locations and over the minibatch, yielding one additional (constant) feature map. This layer could be inserted anywhere in the discriminator, but we have found it best to insert it towards the end (see Appendix A.1 for details). We experimented with a richer set of statistics, but were not able to improve the variation further. In parallel work, Lin et al. (2017) provide theoretical insights about the benefits of showing multiple images to the discriminator.
我们的简化方案既无可学习参数,也无新超参。我们先对小批量上每个空间位置的每个特征计算标准差,再对这些估计在所有特征与空间位置上取平均,得到单个数值。我们复制该值并拼接到所有空间位置与整个小批量,从而得到一张额外的(常数)特征图。该层可插入判别器任意位置,但我们发现靠近末端效果最好(细节见附录 A.1)。我们尝试过更丰富的统计量集合,但未能进一步提升多样性。并行工作中,Lin 等人(2017)为向判别器展示多张图像的好处提供了理论洞见。
Alternative solutions to the variation problem include unrolling the discriminator (Metz et al., 2016) to regularize its updates, and a “repelling regularizer” (Zhao et al., 2017) that adds a new loss term to the generator, trying to encourage it to orthogonalize the feature vectors in a minibatch. The multiple generators of Ghosh et al. (2017) also serve a similar goal. We acknowledge that these solutions may increase the variation even more than our solution – or possibly be orthogonal to it – but leave a detailed comparison to a later time.
多样性问题的其他解法包括:展开判别器(Metz 等人,2016)以正则其更新,以及“排斥正则”(Zhao 等人,2017)——向生成器加入新损失项,试图鼓励它正交化小批量中的特征向量。Ghosh 等人(2017)的多生成器也服务于类似目标。我们承认这些解法可能比我们的方案更能增加多样性——或者与之正交——但详细比较留待以后。
4 Normalization in generator and discriminator
4 生成器与判别器中的归一化
GANs are prone to the escalation of signal magnitudes as a result of unhealthy competition between the two networks. Most if not all earlier solutions discourage this by using a variant of batch normalization (Ioffe & Szegedy, 2015; Salimans & Kingma, 2016; Ba et al., 2016) in the generator, and often also in the discriminator. These normalization methods were originally introduced to eliminate covariate shift. However, we have not observed that to be an issue in GANs, and thus believe that the actual need in GANs is constraining signal magnitudes and competition. We use a different approach that consists of two ingredients, neither of which include learnable parameters.
GAN 容易因两网络之间的不良竞争而出现信号幅度螺旋上升。此前绝大多数解法通过在生成器(也常在判别器)中使用某种批归一化变体(Ioffe & Szegedy,2015;Salimans & Kingma,2016;Ba 等人,2016)来抑制这一点。这些归一化方法最初为消除协变量偏移而引入。但我们未观察到这是 GAN 中的问题,因而认为 GAN 真正需要的是约束信号幅度与竞争。我们采用由两样成分组成的不同方法,二者皆无可学习参数。
4.1 Equalized learning rate
4.1 均衡学习率
We deviate from the current trend of careful weight initialization, and instead use a trivial initialization and then explicitly scale the weights at runtime. To be precise, we set , where are the weights and is the per-layer normalization constant from He’s initializer (He et al., 2015). The benefit of doing this dynamically instead of during initialization is somewhat subtle, and relates to the scale-invariance in commonly used adaptive stochastic gradient descent methods such as RMSProp (Tieleman & Hinton, 2012) and Adam (Kingma & Ba, 2015). These methods normalize a gradient update by its estimated standard deviation, thus making the update independent of the scale of the parameter. As a result, if some parameters have a larger dynamic range than others, they will take longer to adjust. This is a scenario modern initializers cause, and thus it is possible that a learning rate is both too large and too small at the same time. Our approach ensures that the dynamic range, and thus the learning speed, is the same for all weights. A similar reasoning was independently used by van Laarhoven (2017).
我们偏离当前“仔细初始化权重”的潮流,改用平凡的 初始化,再在运行时显式缩放权重。精确地说,我们设 ,其中 为权重, 为来自 He 初始化器(He 等人,2015)的逐层归一化常数。动态而非在初始化时这样做的好处较为微妙,并与 RMSProp(Tieleman & Hinton,2012)和 Adam(Kingma & Ba,2015)等常用自适应随机梯度下降方法中的尺度不变性有关。这些方法用估计的标准差归一化梯度更新,从而使更新与参数尺度无关。结果是:若某些参数的动态范围大于其他参数,它们需要更长时间才能调整。这正是现代初始化器造成的情形,因而可能出现学习率同时过大又过小。我们的方法确保所有权重的动态范围——从而学习速度——相同。van Laarhoven(2017)独立使用了类似推理。
4.2 Pixelwise feature vector normalization in generator
4.2 生成器中的逐像素特征向量归一化
To disallow the scenario where the magnitudes in the generator and discriminator spiral out of control as a result of competition, we normalize the feature vector in each pixel to unit length in the generator after each convolutional layer. We do this using a variant of “local response normalization” (Krizhevsky et al., 2012), configured as , where , is the number of feature maps, and and are the original and normalized feature vector in pixel , respectively. We find it surprising that this heavy-handed constraint does not seem to harm the generator in any way, and indeed with most datasets it does not change the results much, but it prevents the escalation of signal magnitudes very effectively when needed.
为禁止生成器与判别器因竞争而幅度失控的情形,我们在生成器每个卷积层之后,把每个像素处的特征向量归一化到单位长度。我们使用“局部响应归一化”(Krizhevsky 等人,2012)的一种变体,配置为 ,其中 , 为特征图数, 与 分别为像素 处原始与归一化后的特征向量。我们惊讶地发现,这一强硬约束似乎并不以任何方式损害生成器;在多数数据集上它甚至不太改变结果,但在需要时却能非常有效地阻止信号幅度螺旋上升。
5 Multi-scale statistical similarity for assessing GAN results
5 用多尺度统计相似性评估 GAN 结果
In order to compare the results of one GAN to another, one needs to investigate a large number of images, which can be tedious, difficult, and subjective. Thus it is desirable to rely on automated methods that compute some indicative metric from large image collections. We noticed that existing methods such as MS-SSIM (Odena et al., 2017) find large-scale mode collapses reliably but fail to react to smaller effects such as loss of variation in colors or textures, and they also do not directly assess image quality in terms of similarity to the training set.
为比较一个 GAN 与另一个的结果,需要审视大量图像,这可能乏味、困难且主观。因此希望依赖自动化方法,从大型图像集合计算某种指示性指标。我们注意到,现有方法如 MS-SSIM(Odena 等人,2017)能可靠发现大尺度模态崩塌,但对颜色或纹理多样性损失等较小效应反应不足,也不直接从与训练集相似性的角度评估图像质量。
We build on the intuition that a successful generator will produce samples whose local image structure is similar to the training set over all scales. We propose to study this by considering the multi-scale statistical similarity between distributions of local image patches drawn from Laplacian pyramid (Burt & Adelson, 1987) representations of generated and target images, starting at a low-pass resolution of pixels. As per standard practice, the pyramid progressively doubles until the full resolution is reached, each successive level encoding the difference to an up-sampled version of the previous level.
我们基于如下直觉:成功的生成器会在所有尺度上产生局部图像结构与训练集相似的样本。我们提出通过考察生成图像与目标图像的拉普拉斯金字塔(Burt & Adelson,1987)表示中抽取的局部图像块分布之间的多尺度统计相似性来研究这一点,从 像素的低通分辨率起步。按标准做法,金字塔逐步加倍直至全分辨率,每一相继层级编码相对上一层级上采样版本的差分。
A single Laplacian pyramid level corresponds to a specific spatial frequency band. We randomly sample 16384 images and extract 128 descriptors from each level in the Laplacian pyramid, giving us (2.1M) descriptors per level. Each descriptor is a pixel neighborhood with 3 color channels, denoted by . We denote the patches from level of the training set and generated set as and , respectively. We first normalize and w.r.t. the mean and standard deviation of each color channel, and then estimate the statistical similarity by computing their sliced Wasserstein distance , an efficiently computable randomized approximation to earthmover�s distance, using 512 projections (Rabin et al., 2011).
单个拉普拉斯金字塔层级对应特定空间频带。我们随机采样 16384 张图像,并在拉普拉斯金字塔每一层抽取 128 个描述子,从而每层得到 (210 万)个描述子。每个描述子是带 3 个颜色通道的 像素邻域,记为 。我们把训练集与生成集在层级 的图像块分别记为 与 。我们先对 与 按每个颜色通道的均值与标准差归一化,再通过计算它们的切片 Wasserstein 距离 ——一种可高效计算的 earthmover 距离随机近似——用 512 个投影估计统计相似性(Rabin 等人,2011)。
Intuitively a small Wasserstein distance indicates that the distribution of the patches is similar, meaning that the training images and generator samples appear similar in both appearance and variation at this spatial resolution. In particular, the distance between the patch sets extracted from the lowest-resolution images indicate similarity in large-scale image structures, while the finest-level patches encode information about pixel-level attributes such as sharpness of edges and noise.
直观上,较小的 Wasserstein 距离表明图像块分布相似,意味着训练图像与生成器样本在该空间分辨率下外观与多样性都相近。特别地,从最低分辨率 图像抽取的图像块集合之间的距离指示大尺度图像结构的相似性,而最精细层级的图像块则编码边缘锐度与噪声等像素级属性信息。
6 Experiments
6 实验
In this section we discuss a set of experiments that we conducted to evaluate the quality of our results. Please refer to Appendix A for detailed description of our network structures and training configurations. We also invite the reader to consult the accompanying video (https://youtu.be/G06dEcZ-QTg) for additional result images and latent space interpolations. In this section we will distinguish between the network structure (e.g., convolutional layers, resizing), training configuration (various normalization layers, minibatch-related operations), and training loss (WGAN-GP, LSGAN).
本节讨论我们为评估结果质量所做的一系列实验。网络结构与训练配置的详细描述见附录 A。我们也邀请读者查阅配套视频(https://youtu.be/G06dEcZ-QTg)以获取额外结果图像与潜空间插值。本节将区分*网络结构*(例如卷积层、缩放)、*训练配置*(各种归一化层、与小批量相关的操作)以及*训练损失*(WGAN-GP、LSGAN)。
6.1 Importance of individual contributions in terms of statistical similarity
6.1 各项贡献在统计相似性上的重要性
We will first use the sliced Wasserstein distance (SWD) and multi-scale structural similarity (MS-SSIM) (Odena et al., 2017) to evaluate the importance our individual contributions, and also perceptually validate the metrics themselves. We will do this by building on top of a previous state-of-the-art loss function (WGAN-GP) and training configuration (Gulrajani et al., 2017) in an unsupervised setting using CelebA (Liu et al., 2015) and LSUN bedroom (Yu et al., 2015) datasets in resolution. CelebA is particularly well suited for such comparison because the training images contain noticeable artifacts (aliasing, compression, blur) that are difficult for the generator to reproduce faithfully. In this test we amplify the differences between training configurations by choosing a relatively low-capacity network structure (Appendix A.2) and terminating the training once the discriminator has been shown a total of 10M real images. As such the results are not fully converged.
我们先用切片 Wasserstein 距离(SWD)与多尺度结构相似性(MS-SSIM)(Odena 等人,2017)评估各项贡献的重要性,并在感知上验证这些指标本身。做法是在此前最优损失(WGAN-GP)与训练配置(Gulrajani 等人,2017)之上,于无监督设定下使用 分辨率的 CelebA(Liu 等人,2015)与 LSUN bedroom(Yu 等人,2015)数据集。CelebA 特别适合此类比较,因为训练图像含有生成器难以忠实复现的明显伪影(混叠、压缩、模糊)。本测试中,我们选用相对低容量的网络结构(附录 A.2),并在判别器共见到 1000 万张真实图像后终止训练,以放大训练配置之间的差异。因此这些结果并非完全收敛。
| CelebA | LSUN bedroom | ||||||||||||
|---|---|---|---|---|---|---|---|---|---|---|---|---|---|
| Training configuration | Sliced Wasserstein distance | MS-SSIM | Sliced Wasserstein distance | MS-SSIM | |||||||||
| 128 | 64 | 32 | 16 | Avg | 128 | 64 | 32 | 16 | Avg | ||||
| (a) | Gulrajani et al. (2017) | 12.99 | 7.79 | 7.62 | 8.73 | 9.28 | 0.2854 | 11.97 | 10.51 | 8.03 | 14.48 | 11.25 | 0.0587 |
| (b) | + Progressive growing | 4.62 | 2.64 | 3.78 | 6.06 | 4.28 | 0.2838 | 7.09 | 6.27 | 7.40 | 9.64 | 7.60 | 0.0615 |
| (c) | + Small minibatch | 75.42 | 41.33 | 41.62 | 26.57 | 46.23 | 0.4065 | 72.73 | 40.16 | 42.75 | 42.46 | 49.52 | 0.1061 |
| (d) | + Revised training parameters | 9.20 | 6.53 | 4.71 | 11.84 | 8.07 | 0.3027 | 7.39 | 5.51 | 3.65 | 9.63 | 6.54 | 0.0662 |
| (e∗) | + Minibatch discrimination | 10.76 | 6.28 | 6.04 | 16.29 | 9.84 | 0.3057 | 10.29 | 6.22 | 5.32 | 11.88 | 8.43 | 0.0648 |
| (e) | Minibatch stddev | 13.94 | 5.67 | 2.82 | 5.71 | 7.04 | 0.2950 | 7.77 | 5.23 | 3.27 | 9.64 | 6.48 | 0.0671 |
| (f) | + Equalized learning rate | 4.42 | 3.28 | 2.32 | 7.52 | 4.39 | 0.2902 | 3.61 | 3.32 | 2.71 | 6.44 | 4.02 | 0.0668 |
| (g) | + Pixelwise normalization | 4.06 | 3.04 | 2.02 | 5.13 | 3.56 | 0.2845 | 3.89 | 3.05 | 3.24 | 5.87 | 4.01 | 0.0640 |
| (h) | Converged | 2.42 | 2.17 | 2.24 | 4.99 | 2.96 | 0.2828 | 3.47 | 2.60 | 2.30 | 4.87 | 3.31 | 0.0636 |
Table 1: Sliced Wasserstein distance (SWD) between the generated and training images (Section 5) and multi-scale structural similarity (MS-SSIM) among the generated images for several training setups at . For SWD, each column represents one level of the Laplacian pyramid, and the last one gives an average of the four distances.
| CelebA | LSUN bedroom | ||||||||||||
|---|---|---|---|---|---|---|---|---|---|---|---|---|---|
| 训练配置 | 切片 Wasserstein 距离 | MS-SSIM | 切片 Wasserstein 距离 | MS-SSIM | |||||||||
| 128 | 64 | 32 | 16 | Avg | 128 | 64 | 32 | 16 | Avg | ||||
| (a) | Gulrajani 等人(2017) | 12.99 | 7.79 | 7.62 | 8.73 | 9.28 | 0.2854 | 11.97 | 10.51 | 8.03 | 14.48 | 11.25 | 0.0587 |
| (b) | + 渐进式增长 | 4.62 | 2.64 | 3.78 | 6.06 | 4.28 | 0.2838 | 7.09 | 6.27 | 7.40 | 9.64 | 7.60 | 0.0615 |
| (c) | + 小批量 | 75.42 | 41.33 | 41.62 | 26.57 | 46.23 | 0.4065 | 72.73 | 40.16 | 42.75 | 42.46 | 49.52 | 0.1061 |
| (d) | + 修订训练参数 | 9.20 | 6.53 | 4.71 | 11.84 | 8.07 | 0.3027 | 7.39 | 5.51 | 3.65 | 9.63 | 6.54 | 0.0662 |
| (e∗) | + 小批量判别 | 10.76 | 6.28 | 6.04 | 16.29 | 9.84 | 0.3057 | 10.29 | 6.22 | 5.32 | 11.88 | 8.43 | 0.0648 |
| (e) | 小批量标准差 | 13.94 | 5.67 | 2.82 | 5.71 | 7.04 | 0.2950 | 7.77 | 5.23 | 3.27 | 9.64 | 6.48 | 0.0671 |
| (f) | + 均衡学习率 | 4.42 | 3.28 | 2.32 | 7.52 | 4.39 | 0.2902 | 3.61 | 3.32 | 2.71 | 6.44 | 4.02 | 0.0668 |
| (g) | + 逐像素归一化 | 4.06 | 3.04 | 2.02 | 5.13 | 3.56 | 0.2845 | 3.89 | 3.05 | 3.24 | 5.87 | 4.01 | 0.0640 |
| (h) | 收敛结果 | 2.42 | 2.17 | 2.24 | 4.99 | 2.96 | 0.2828 | 3.47 | 2.60 | 2.30 | 4.87 | 3.31 | 0.0636 |
表 1: 下若干训练设定的生成图像与训练图像之间的切片 Wasserstein 距离(SWD,第 5 节)以及生成图像之间的多尺度结构相似性(MS-SSIM)。对 SWD,每列对应拉普拉斯金字塔的一层,最后一列给出四个距离的平均。
(a) (b) (c) (d) (e) (e) (f) (g) (h) Converged
Figure 3: (a) – (g) CelebA examples corresponding to rows in Table 1. These are intentionally non-converged. (h) Our converged result. Notice that some images show aliasing and some are not sharp – this is a flaw of the dataset, which the model learns to replicate faithfully.
(a) (b) (c) (d) (e) (e) (f) (g) (h) 收敛
图 3:(a)–(g) 对应表 1 各行的 CelebA 示例。这些是有意未收敛的结果。(h) 为我们的收敛结果。注意有些图像有混叠、有些不锐利——这是数据集的缺陷,模型学会忠实复现。
Table 1 lists the numerical values for SWD and MS-SSIM in several training configurations, where our individual contributions are cumulatively enabled one by one on top of the baseline (Gulrajani et al., 2017). The MS-SSIM numbers were averaged from 10000 pairs of generated images, and SWD was calculated as described in Section 5. Generated CelebA images from these configurations are shown in Figure 3. Due to space constraints, the figure shows only a small number of examples for each row of the table, but a significantly broader set is available in Appendix H. Intuitively, a good evaluation metric should reward plausible images that exhibit plenty of variation in colors, textures, and viewpoints. However, this is not captured by MS-SSIM: we can immediately see that configuration (h) generates significantly better images than configuration (a), but MS-SSIM remains approximately unchanged because it measures only the variation between outputs, not similarity to the training set. SWD, on the other hand, does indicate a clear improvement.
表 1 列出若干训练配置下 SWD 与 MS-SSIM 的数值;我们的各项贡献在基线(Gulrajani 等人,2017)之上逐项累积启用。MS-SSIM 数字由 10000 对生成图像平均得到,SWD 按第 5 节所述计算。这些配置生成的 CelebA 图像见图 3。因篇幅限制,图中每行只展示少量示例,附录 H 有显著更广的集合。直观上,好的评估指标应奖励在颜色、纹理与视角上呈现丰富多样性的可信图像。但 MS-SSIM 并未捕捉这一点:我们能立即看出配置 (h) 生成的图像显著好于配置 (a),但 MS-SSIM 几乎不变,因为它只度量输出之间的多样性,而非与训练集的相似性。SWD 则清楚指示了改进。
The first training configuration (a) corresponds to Gulrajani et al. (2017), featuring batch normalization in the generator, layer normalization in the discriminator, and minibatch size of 64. (b) enables progressive growing of the networks, which results in sharper and more believable output images. SWD correctly finds the distribution of generated images to be more similar to the training set.
第一种训练配置 (a) 对应 Gulrajani 等人(2017):生成器用批归一化,判别器用层归一化,小批量大小 64。(b) 启用网络的渐进式增长,输出图像更锐利、更可信。SWD 正确地发现生成图像分布与训练集更相似。
Our primary goal is to enable high output resolutions, and this requires reducing the size of minibatches in order to stay within the available memory budget. We illustrate the ensuing challenges in (c) where we decrease the minibatch size from 64 to 16. The generated images are unnatural, which is clearly visible in both metrics. In (d), we stabilize the training process by adjusting the hyperparameters as well as by removing batch normalization and layer normalization (Appendix A.2). As an intermediate test (e), we enable minibatch discrimination (Salimans et al., 2016), which somewhat surprisingly fails to improve any of the metrics, including MS-SSIM that measures output variation. In contrast, our minibatch standard deviation (e) improves the average SWD scores and images. We then enable our remaining contributions in (f) and (g), leading to an overall improvement in SWD and subjective visual quality. Finally, in (h) we use a non-crippled network and longer training – we feel the quality of the generated images is at least comparable to the best published results so far.
我们的主要目标是支持高输出分辨率,这需要缩小小批量以维持在可用内存预算内。我们在 (c) 中说明随之而来的挑战:把小批量从 64 减到 16。生成图像不自然,在两项指标中都清楚可见。在 (d) 中,我们通过调整超参并去掉批归一化与层归一化来稳定训练过程(附录 A.2)。作为中间测试 (e),我们启用小批量判别(Salimans 等人,2016),出乎意料地未能改善任何指标,包括度量输出多样性的 MS-SSIM。相比之下,我们的小批量标准差 (e) 改善了平均 SWD 分数与图像。我们再在 (f) 与 (g) 启用其余贡献,带来 SWD 与主观视觉质量的整体提升。最后,在 (h) 我们使用未削弱的网络与更长训练——我们觉得生成图像的质量至少可与当时已发表的最佳结果相比。
6.2 Convergence and training speed
6.2 收敛与训练速度
(a) (b) (c)
Figure 4: Effect of progressive growing on training speed and convergence. The timings were measured on a single-GPU setup using NVIDIA Tesla P100. (a) Statistical similarity with respect to wall clock time for Gulrajani et al. (2017) using CelebA at resolution. Each graph represents sliced Wasserstein distance on one level of the Laplacian pyramid, and the vertical line indicates the point where we stop the training in Table 1. (b) Same graph with progressive growing enabled. The dashed vertical lines indicate points where we double the resolution of G and D. (c) Effect of progressive growing on the raw training speed in resolution.
(a) (b) (c)
图 4:渐进式增长对训练速度与收敛的影响。计时在单 GPU 设定下用 NVIDIA Tesla P100 测量。(a) Gulrajani 等人(2017)在 CelebA 上相对墙钟时间的统计相似性。每条曲线对应拉普拉斯金字塔一层上的切片 Wasserstein 距离,竖线标出表 1 中我们停止训练的位置。(b) 启用渐进式增长后的同一曲线。虚竖线标出我们把 G 与 D 分辨率加倍的时刻。(c) 渐进式增长对 分辨率下原始训练速度的影响。
Figure 4 illustrates the effect of progressive growing in terms of the SWD metric and raw image throughput. The first two plots correspond to the training configuration of Gulrajani et al. (2017) without and with progressive growing. We observe that the progressive variant offers two main benefits: it converges to a considerably better optimum and also reduces the total training time by about a factor of two. The improved convergence is explained by an implicit form of curriculum learning that is imposed by the gradually increasing network capacity. Without progressive growing, all layers of the generator and discriminator are tasked with simultaneously finding succinct intermediate representations for both the large-scale variation and the small-scale detail. With progressive growing, however, the existing low-resolution layers are likely to have already converged early on, so the networks are only tasked with refining the representations by increasingly smaller-scale effects as new layers are introduced. Indeed, we see in Figure 4(b) that the largest-scale statistical similarity curve (16) reaches its optimal value very quickly and remains consistent throughout the rest of the training. The smaller-scale curves (32, 64, 128) level off one by one as the resolution is increased, but the convergence of each curve is equally consistent. With non-progressive training in Figure 4(a), each scale of the SWD metric converges roughly in unison, as could be expected.
图 4 从 SWD 指标与原始图像吞吐两方面说明渐进式增长的效果。前两幅图对应 Gulrajani 等人(2017)在有无渐进式增长时的训练配置。我们观察到渐进变体有两大好处:收敛到明显更好的最优点,并把总训练时间大约减半。改进的收敛可用网络容量逐渐增加所施加的隐式课程学习来解释。没有渐进式增长时,生成器与判别器的所有层必须同时为大尺度变化与小尺度细节寻找简洁的中间表示。有渐进式增长时,已有的低分辨率层很可能早已收敛,网络只需在引入新层时用日益更小尺度的效应来细化表示。的确,我们在图 4(b) 中看到最大尺度统计相似性曲线(16)很快达到最优值,并在其余训练中保持一致。较小尺度曲线(32、64、128)随分辨率提高逐条趋平,但每条曲线的收敛同样一致。在图 4(a) 的非渐进训练中,SWD 指标的每个尺度大致同步收敛,这符合预期。
The speedup from progressive growing increases as the output resolution grows. Figure 4(c) shows training progress, measured in number of real images shown to the discriminator, as a function of training time when the training progresses all the way to resolution. We see that progressive growing gains a significant head start because the networks are shallow and quick to evaluate at the beginning. Once the full resolution is reached, the image throughput is equal between the two methods. The plot shows that the progressive variant reaches approximately 6.4 million images in 96 hours, whereas it can be extrapolated that the non-progressive variant would take about 520 hours to reach the same point. In this case, the progressive growing offers roughly a speedup.
渐进式增长带来的加速随输出分辨率增大而增大。图 4(c) 显示训练一直推进到 分辨率时,以向判别器展示的真实图像数为度量的训练进度相对训练时间的关系。我们看到渐进变体因开始时网络浅、评估快而显著领先。一旦达到全分辨率,两种方法的图像吞吐相等。图显示渐进变体在 96 小时内约见到 640 万张图像,而可外推非渐进变体达到同一点约需 520 小时。此情形下,渐进式增长约带来 加速。
6.3 High-resolution image generation using CelebA-HQ dataset
6.3 用 CelebA-HQ 数据集生成高分辨率图像
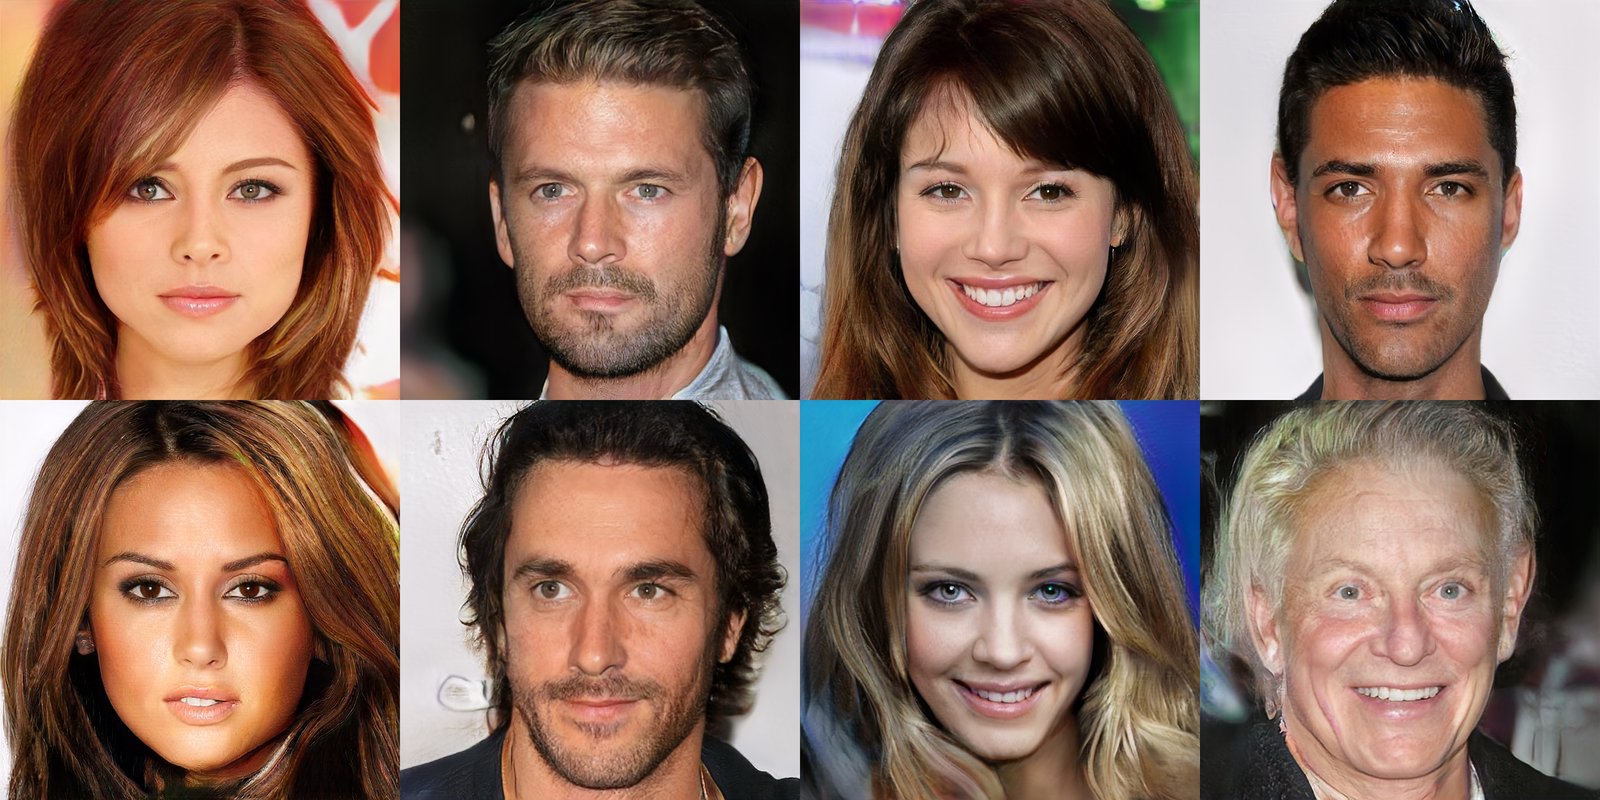
Figure 5: images generated using the CelebA-HQ dataset. See Appendix F for a larger set of results, and the accompanying video for latent space interpolations.
图 5:用 CelebA-HQ 数据集生成的 图像。更大结果集见附录 F;潜空间插值见配套视频。
To meaningfully demonstrate our results at high output resolutions, we need a sufficiently varied high-quality dataset. However, virtually all publicly available datasets previously used in GAN literature are limited to relatively low resolutions ranging from to . To this end, we created a high-quality version of the CelebA dataset consisting of 30000 of the images at resolution. We refer to Appendix C for further details about the generation of this dataset.
要有意义地展示高输出分辨率下的结果,我们需要足够多样的高质量数据集。然而,此前 GAN 文献常用的几乎所有公开数据集分辨率都相对较低,从 到 。为此,我们创建了由 30000 张 分辨率图像组成的高质量版 CelebA 数据集。该数据集的生成细节见附录 C。
Our contributions allow us to deal with high output resolutions in a robust and efficient fashion. Figure 5 shows selected images produced by our network. While megapixel GAN results have been shown before in another dataset (Marchesi, 2017), our results are vastly more varied and of higher perceptual quality. Please refer to Appendix F for a larger set of result images as well as the nearest neighbors found from the training data. The accompanying video shows latent space interpolations and visualizes the progressive training. The interpolation works so that we first randomize a latent code for each frame (512 components sampled individually from ), then blur the latents across time with a Gaussian (), and finally normalize each vector to lie on a hypersphere.
我们的贡献使我们能稳健、高效地处理高输出分辨率。图 5 展示网络生成的精选 图像。尽管此前已有在另一数据集上展示百万像素 GAN 结果(Marchesi,2017),我们的结果在多样性与感知质量上高出许多。更大结果集以及从训练数据中找到的近邻见附录 F。配套视频展示潜空间插值并可视化渐进式训练。插值做法是:先为每帧随机化潜码(512 个分量各自从 采样),再用高斯( 帧 @ 60Hz)沿时间模糊潜码,最后把每个向量归一化到超球面。
We trained the network on 8 Tesla V100 GPUs for 4 days, after which we no longer observed qualitative differences between the results of consecutive training iterations. Our implementation used an adaptive minibatch size depending on the current output resolution so that the available memory budget was optimally utilized.
我们在 8 块 Tesla V100 GPU 上训练网络 4 天,之后不再观察到连续训练迭代结果之间的定性差异。我们的实现按当前输出分辨率自适应小批量大小,以最优利用可用内存预算。
In order to demonstrate that our contributions are largely orthogonal to the choice of a loss function, we also trained the same network using LSGAN loss instead of WGAN-GP loss. Figure 1 shows six examples of images produced using our method using LSGAN. Further details of this setup are given in Appendix B.
为表明我们的贡献大体与损失函数选择正交,我们还用 LSGAN 损失而非 WGAN-GP 损失训练同一网络。图 1 展示用我们的方法与 LSGAN 生成的六张 示例。该设定的更多细节见附录 B。
6.4 LSUN results
6.4 LSUN 结果
Mao et al. (2016b) () Gulrajani et al. (2017) () Our ()
Figure 6: Visual quality comparison in LSUN bedroom; pictures copied from the cited articles.
Mao 等人(2016b)() Gulrajani 等人(2017)() 本文()
图 6:LSUN bedroom 上的视觉质量比较;图片复制自所引文章。
pottedplant horse sofa bus churchoutdoor bicycle tvmonitor
Figure 7: Selection of images generated from different LSUN categories.
盆栽 马 沙发 巴士 户外教堂 自行车 电视显示器
图 7:从不同 LSUN 类别生成的精选 图像。
Figure 6 shows a purely visual comparison between our solution and earlier results in LSUN bedroom. Figure 7 gives selected examples from seven very different LSUN categories at . A larger, non-curated set of results from all 30 LSUN categories is available in Appendix G, and the video demonstrates interpolations. We are not aware of earlier results in most of these categories, and while some categories work better than others, we feel that the overall quality is high.
图 6 给出我们的方案与先前 LSUN bedroom 结果的纯视觉比较。图 7 给出七个差异很大的 LSUN 类别在 上的精选示例。全部 30 个 LSUN 类别未经筛选的更大结果集见附录 G,视频演示插值。我们不知道这些类别中多数此前有结果;尽管有些类别效果好于其他,我们觉得总体质量很高。
6.5 CIFAR10 inception scores
6.5 CIFAR10 inception score
The best inception scores for CIFAR10 (10 categories of RGB images) we are aware of are 7.90 for unsupervised and 8.87 for label conditioned setups (Grinblat et al., 2017). The large difference between the two numbers is primarily caused by “ghosts” that necessarily appear between classes in the unsupervised setting, while label conditioning can remove many such transitions.
就我们所知,CIFAR10(10 类 RGB 图像)上最佳 inception score 在无监督设定为 7.90、标签条件设定为 8.87(Grinblat 等人,2017)。两数差距主要来自无监督设定中类别之间必然出现的“幽灵”过渡,而标签条件可消除许多此类过渡。
When all of our contributions are enabled, we get in the unsupervised setting. Appendix D shows a representative set of generated images along with a more comprehensive list of results from earlier methods. The network and training setup were the same as for CelebA, progression limited to of course. The only customization was to the WGAN-GP’s regularization term ]. Gulrajani et al. (2017) used , which corresponds to 1-Lipschitz, but we noticed that it is in fact significantly better to prefer fast transitions () to minimize the ghosts. We have not tried this trick with other datasets.
当我们的全部贡献启用时,在无监督设定下得到 。附录 D 展示一组有代表性的生成图像,并更全面地列出先前方法的结果。网络与训练设定与 CelebA 相同,当然分辨率限制在 。唯一定制是对 WGAN-GP 正则项 。Gulrajani 等人(2017)用 ,对应 1-Lipschitz;但我们注意到实际上更偏好快速过渡()以最小化幽灵。我们未在其他数据集上尝试这一技巧。
7 Discussion
7 讨论
While the quality of our results is generally high compared to earlier work on GANs, and the training is stable in large resolutions, there is a long way to true photorealism. Semantic sensibility and understanding dataset-dependent constraints, such as certain objects being straight rather than curved, leaves a lot to be desired. There is also room for improvement in the micro-structure of the images. That said, we feel that convincing realism may now be within reach, especially in CelebA-HQ.
尽管相对先前 GAN 工作我们的结果质量总体较高,且在大分辨率下训练稳定,但离真正的照片级真实感仍有很长距离。语义合理性以及对数据集依赖约束的理解——例如某些物体应为直而非弯——仍有很大不足。图像微观结构也有改进空间。尽管如此,我们觉得令人信服的真实感或许已触手可及,尤其在 CelebA-HQ 上。
8 Acknowledgements
8 致谢
We would like to thank Mikael Honkavaara, Tero Kuosmanen, and Timi Hietanen for the compute infrastructure. Dmitry Korobchenko and Richard Calderwood for efforts related to the CelebA-HQ dataset. Oskar Elek, Jacob Munkberg, and Jon Hasselgren for useful comments.
我们感谢 Mikael Honkavaara、Tero Kuosmanen 与 Timi Hietanen 提供计算基础设施;感谢 Dmitry Korobchenko 与 Richard Calderwood 在 CelebA-HQ 数据集上的努力;感谢 Oskar Elek、Jacob Munkberg 与 Jon Hasselgren 提出有用意见。
References
参考文献
Arjovsky & Bottou (2017) Martin Arjovsky and Léon Bottou. Towards principled methods for training generative adversarial networks. In ICLR , 2017.
Arjovsky et al. (2017) Martin Arjovsky, Soumith Chintala, and Léon Bottou. Wasserstein GAN. CoRR , abs/1701.07875, 2017.
Arora & Zhang (2017) Sanjeev Arora and Yi Zhang. Do GANs actually learn the distribution? an empirical study. CoRR , abs/1706.08224, 2017.
Ba et al. (2016) Jimmy Lei Ba, Jamie Ryan Kiros, and Geoffrey E. Hinton. Layer normalization. CoRR , abs/1607.06450, 2016.
Bengio et al. (2007) Yoshua Bengio, Pascal Lamblin, Dan Popovici, and Hugo Larochelle. Greedy layer-wise training of deep networks. In P. B. Schölkopf, J. C. Platt, and T. Hoffman (eds.), NIPS , pp. 153–160. 2007.
Berthelot et al. (2017) David Berthelot, Tom Schumm, and Luke Metz. BEGAN: Boundary equilibrium generative adversarial networks. CoRR , abs/1703.10717, 2017.
Burt & Adelson (1987) Peter J. Burt and Edward H. Adelson. Readings in computer vision: Issues, problems, principles, and paradigms. chapter The Laplacian Pyramid As a Compact Image Code, pp. 671–679. 1987.
Chen & Koltun (2017) Qifeng Chen and Vladlen Koltun. Photographic image synthesis with cascaded refinement networks. CoRR , abs/1707.09405, 2017.
Dai et al. (2017) Zihang Dai, Amjad Almahairi, Philip Bachman, Eduard H. Hovy, and Aaron C. Courville. Calibrating energy-based generative adversarial networks. In ICLR , 2017.
Denton et al. (2015) Emily L. Denton, Soumith Chintala, Arthur Szlam, and Robert Fergus. Deep generative image models using a Laplacian pyramid of adversarial networks. CoRR , abs/1506.05751, 2015.
Dumoulin et al. (2016) Vincent Dumoulin, Ishmael Belghazi, Ben Poole, Alex Lamb, Martin Arjovsky, Olivier Mastropietro, and Aaron Courville. Adversarially learned inference. CoRR , abs/1606.00704, 2016.
Durugkar et al. (2016) Ishan P. Durugkar, Ian Gemp, and Sridhar Mahadevan. Generative multi-adversarial networks. CoRR , abs/1611.01673, 2016.
Fritzke (1995) Bernd Fritzke. A growing neural gas network learns topologies. In G. Tesauro, D. S. Touretzky, and T. K. Leen (eds.), Advances in Neural Information Processing Systems 7 , pp. 625–632. 1995.
Ghosh et al. (2017) Arnab Ghosh, Viveka Kulharia, Vinay P. Namboodiri, Philip H. S. Torr, and Puneet Kumar Dokania. Multi-agent diverse generative adversarial networks. CoRR , abs/1704.02906, 2017.
Goodfellow et al. (2014) Ian Goodfellow, Jean Pouget-Abadie, Mehdi Mirza, Bing Xu, David Warde-Farley, Sherjil Ozair, Aaron Courville, and Yoshua Bengio. Generative Adversarial Networks. In NIPS , 2014.
Grinblat et al. (2017) Guillermo L. Grinblat, Lucas C. Uzal, and Pablo M. Granitto. Class-splitting generative adversarial networks. CoRR , abs/1709.07359, 2017.
Gulrajani et al. (2017) Ishaan Gulrajani, Faruk Ahmed, Martín Arjovsky, Vincent Dumoulin, and Aaron C. Courville. Improved training of Wasserstein GANs. CoRR , abs/1704.00028, 2017.
He et al. (2015) Kaiming He, Xiangyu Zhang, Shaoqing Ren, and Jian Sun. Delving deep into rectifiers: Surpassing human-level performance on imagenet classification. CoRR , abs/1502.01852, 2015.
Heusel et al. (2017) Martin Heusel, Hubert Ramsauer, Thomas Unterthiner, Bernhard Nessler, and Sepp Hochreiter. GANs trained by a two time-scale update rule converge to a local Nash equilibrium. In NIPS , pp. 6626–6637. 2017.
Hjelm et al. (2017) R Devon Hjelm, Athul Paul Jacob, Tong Che, Kyunghyun Cho, and Yoshua Bengio. Boundary-Seeking Generative Adversarial Networks. CoRR , abs/1702.08431, 2017.
Huang et al. (2016) Xun Huang, Yixuan Li, Omid Poursaeed, John E. Hopcroft, and Serge J. Belongie. Stacked generative adversarial networks. CoRR , abs/1612.04357, 2016.
Iizuka et al. (2017) Satoshi Iizuka, Edgar Simo-Serra, and Hiroshi Ishikawa. Globally and locally consistent image completion. ACM Trans. Graph. , 36(4):107:1–107:14, 2017.
Ioffe & Szegedy (2015) Sergey Ioffe and Christian Szegedy. Batch normalization: Accelerating deep network training by reducing internal covariate shift. CoRR , abs/1502.03167, 2015.
Kingma & Ba (2015) Diederik P. Kingma and Jimmy Ba. Adam: A method for stochastic optimization. In ICLR , 2015.
Kingma & Welling (2014) Diederik P. Kingma and Max Welling. Auto-encoding variational bayes. In ICLR , 2014.
Kingma et al. (2016) Diederik P Kingma, Tim Salimans, Rafal Jozefowicz, Xi Chen, Ilya Sutskever, and Max Welling. Improved variational inference with inverse autoregressive flow. In NIPS , volume 29, pp. 4743–4751. 2016.
Kodali et al. (2017) Naveen Kodali, Jacob D. Abernethy, James Hays, and Zsolt Kira. How to train your DRAGAN. CoRR , abs/1705.07215, 2017.
Korobchenko & Foco (2017) Dmitry Korobchenko and Marco Foco. Single image super-resolution using deep learning, 2017. URL https://gwmt.nvidia.com/super-res/about . Machines Can See summit.
Krizhevsky et al. (2012) Alex Krizhevsky, Ilya Sutskever, and Geoffrey E. Hinton. Imagenet classification with deep convolutional neural networks. In NIPS , pp. 1097–1105. 2012.
Ledig et al. (2016) Christian Ledig, Lucas Theis, Ferenc Huszar, Jose Caballero, Andrew P. Aitken, Alykhan Tejani, Johannes Totz, Zehan Wang, and Wenzhe Shi. Photo-realistic single image super-resolution using a generative adversarial network. CoRR , abs/1609.04802, 2016.
Lin et al. (2017) Zinan Lin, Ashish Khetan, Giulia Fanti, and Sewoong Oh. PacGAN: The power of two samples in generative adversarial networks. CoRR , abs/1712.04086, 2017.
Liu et al. (2017) Ming-Yu Liu, Thomas Breuel, and Jan Kautz. Unsupervised image-to-image translation networks. CoRR , abs/1703.00848, 2017.
Liu et al. (2015) Ziwei Liu, Ping Luo, Xiaogang Wang, and Xiaoou Tang. Deep learning face attributes in the wild. In ICCV , 2015.
Makhzani & Frey (2017) Alireza Makhzani and Brendan J. Frey. PixelGAN autoencoders. CoRR , abs/1706.00531, 2017.
Mao et al. (2016a) Xiao-Jiao Mao, Chunhua Shen, and Yu-Bin Yang. Image restoration using convolutional auto-encoders with symmetric skip connections. CoRR , abs/1606.08921, 2016a.
Mao et al. (2016b) Xudong Mao, Qing Li, Haoran Xie, Raymond Y. K. Lau, and Zhen Wang. Least squares generative adversarial networks. CoRR , abs/1611.04076, 2016b.
Marchesi (2017) Marco Marchesi. Megapixel size image creation using generative adversarial networks. CoRR , abs/1706.00082, 2017.
Metz et al. (2016) Luke Metz, Ben Poole, David Pfau, and Jascha Sohl-Dickstein. Unrolled generative adversarial networks. CoRR , abs/1611.02163, 2016.
Odena et al. (2017) Augustus Odena, Christopher Olah, and Jonathon Shlens. Conditional image synthesis with auxiliary classifier GANs. In ICML , 2017.
Rabin et al. (2011) Julien Rabin, Gabriel Peyr�, Julie Delon, and Marc Bernot. Wasserstein barycenter and its application to texture mixing. In Scale Space and Variational Methods in Computer Vision (SSVM) , pp. 435–446, 2011.
Radford et al. (2015) Alec Radford, Luke Metz, and Soumith Chintala. Unsupervised representation learning with deep convolutional generative adversarial networks. CoRR , abs/1511.06434, 2015.
Salimans & Kingma (2016) Tim Salimans and Diederik P. Kingma. Weight normalization: A simple reparameterization to accelerate training of deep neural networks. CoRR , abs/1602.07868, 2016.
Salimans et al. (2016) Tim Salimans, Ian J. Goodfellow, Wojciech Zaremba, Vicki Cheung, Alec Radford, and Xi Chen. Improved techniques for training GANs. In NIPS , 2016.
Stanley & Miikkulainen (2002) Kenneth O. Stanley and Risto Miikkulainen. Evolving neural networks through augmenting topologies. Evolutionary Computation , 10(2):99–127, 2002.
Tieleman & Hinton (2012) Tijmen Tieleman and Geoffrey E. Hinton. Lecture 6.5 - RMSProp. Technical report, COURSERA: Neural Networks for Machine Learning, 2012.
Ulyanov et al. (2017) Dmitry Ulyanov, Andrea Vedaldi, and Victor S. Lempitsky. Adversarial generator-encoder networks. CoRR , abs/1704.02304, 2017.
van den Oord et al. (2016a) Aäron van den Oord, Sander Dieleman, Heiga Zen, Karen Simonyan, Oriol Vinyals, Alex Graves, Nal Kalchbrenner, Andrew W. Senior, and Koray Kavukcuoglu. WaveNet: A generative model for raw audio. CoRR , abs/1609.03499, 2016a.
van den Oord et al. (2016b) Aäron van den Oord, Nal Kalchbrenner, and Koray Kavukcuoglu. Pixel recurrent neural networks. In ICML , pp. 1747–1756, 2016b.
van den Oord et al. (2016c) Aäron van den Oord, Nal Kalchbrenner, Oriol Vinyals, Lasse Espeholt, Alex Graves, and Koray Kavukcuoglu. Conditional image generation with PixelCNN decoders. CoRR , abs/1606.05328, 2016c.
van Laarhoven (2017) Twan van Laarhoven. L2 regularization versus batch and weight normalization. CoRR , abs/1706.05350, 2017.
Wang et al. (2017) Ting-Chun Wang, Ming-Yu Liu, Jun-Yan Zhu, Andrew Tao, Jan Kautz, and Bryan Catanzaro. High-resolution image synthesis and semantic manipulation with conditional GANs. CoRR , abs/1711.11585, 2017.
Wang et al. (2003) Zhou Wang, Eero P. Simoncelli, and Alan C. Bovik. Multi-scale structural similarity for image quality assessment. In Proc. IEEE Asilomar Conf. on Signals, Systems, and Computers , pp. 1398–1402, 2003.
Warde-Farley & Bengio (2017) David Warde-Farley and Yoshua Bengio. Improving generative adversarial networks with denoising feature matching. In ICLR , 2017.
Yang et al. (2017) Jianwei Yang, Anitha Kannan, Dhruv Batra, and Devi Parikh. LR-GAN: layered recursive generative adversarial networks for image generation. In ICLR , 2017.
Yu et al. (2015) Fisher Yu, Yinda Zhang, Shuran Song, Ari Seff, and Jianxiong Xiao. LSUN: Construction of a large-scale image dataset using deep learning with humans in the loop. CoRR , abs/1506.03365, 2015.
Zhang et al. (2017) Han Zhang, Tao Xu, Hongsheng Li, Shaoting Zhang, Xiaolei Huang, Xiaogang Wang, and Dimitris N. Metaxas. StackGAN: text to photo-realistic image synthesis with stacked generative adversarial networks. In ICCV , 2017.
Zhao et al. (2017) Junbo Jake Zhao, Michaël Mathieu, and Yann LeCun. Energy-based generative adversarial network. In ICLR , 2017.
Zhu et al. (2017) Jun-Yan Zhu, Taesung Park, Phillip Isola, and Alexei A. Efros. Unpaired image-to-image translation using cycle-consistent adversarial networks. CoRR , abs/1703.10593, 2017.
Appendix A Network structure and training configuration
附录 A 网络结构与训练配置
A.1 networks used for CelebA-HQ
A.1 用于 CelebA-HQ 的 网络
| Generator | Act. | Output shape | Params |
|---|---|---|---|
| Latent vector | – | – | |
| Conv | LReLU | 4.2M | |
| Conv | LReLU | 2.4M | |
| Upsample | – | – | |
| Conv | LReLU | 2.4M | |
| Conv | LReLU | 2.4M | |
| Upsample | – | – | |
| Conv | LReLU | 2.4M | |
| Conv | LReLU | 2.4M | |
| Upsample | – | – | |
| Conv | LReLU | 2.4M | |
| Conv | LReLU | 2.4M | |
| Upsample | – | – | |
| Conv | LReLU | 1.2M | |
| Conv | LReLU | 590k | |
| Upsample | – | – | |
| Conv | LReLU | 295k | |
| Conv | LReLU | 148k | |
| Upsample | – | – | |
| Conv | LReLU | 74k | |
| Conv | LReLU | 37k | |
| Upsample | – | – | |
| Conv | LReLU | 18k | |
| Conv | LReLU | 9.2k | |
| Upsample | – | – | |
| Conv | LReLU | 4.6k | |
| Conv | LReLU | 2.3k | |
| Conv | linear | 51 | |
| Total trainable parameters | 23.1M |
| Discriminator | Act. | Output shape | Params |
|---|---|---|---|
| Input image | – | – | |
| Conv | LReLU | 64 | |
| Conv | LReLU | 2.3k | |
| Conv | LReLU | 4.6k | |
| Downsample | – | – | |
| Conv | LReLU | 9.2k | |
| Conv | LReLU | 18k | |
| Downsample | – | – | |
| Conv | LReLU | 37k | |
| Conv | LReLU | 74k | |
| Downsample | – | – | |
| Conv | LReLU | 148k | |
| Conv | LReLU | 295k | |
| Downsample | – | – | |
| Conv | LReLU | 590k | |
| Conv | LReLU | 1.2M | |
| Downsample | – | – | |
| Conv | LReLU | 2.4M | |
| Conv | LReLU | 2.4M | |
| Downsample | – | – | |
| Conv | LReLU | 2.4M | |
| Conv | LReLU | 2.4M | |
| Downsample | – | – | |
| Conv | LReLU | 2.4M | |
| Conv | LReLU | 2.4M | |
| Downsample | – | – | |
| Minibatch stddev | – | – | |
| Conv | LReLU | 2.4M | |
| Conv | LReLU | 4.2M | |
| Fully-connected | linear | 513 | |
| Total trainable parameters | 23.1M |
Table 2: Generator and discriminator that we use with CelebA-HQ to generate images.
| 生成器 | 激活 | 输出形状 | 参数量 |
|---|---|---|---|
| 潜向量 | – | – | |
| Conv | LReLU | 4.2M | |
| Conv | LReLU | 2.4M | |
| 上采样 | – | – | |
| Conv | LReLU | 2.4M | |
| Conv | LReLU | 2.4M | |
| 上采样 | – | – | |
| Conv | LReLU | 2.4M | |
| Conv | LReLU | 2.4M | |
| 上采样 | – | – | |
| Conv | LReLU | 2.4M | |
| Conv | LReLU | 2.4M | |
| 上采样 | – | – | |
| Conv | LReLU | 1.2M | |
| Conv | LReLU | 590k | |
| 上采样 | – | – | |
| Conv | LReLU | 295k | |
| Conv | LReLU | 148k | |
| 上采样 | – | – | |
| Conv | LReLU | 74k | |
| Conv | LReLU | 37k | |
| 上采样 | – | – | |
| Conv | LReLU | 18k | |
| Conv | LReLU | 9.2k | |
| 上采样 | – | – | |
| Conv | LReLU | 4.6k | |
| Conv | LReLU | 2.3k | |
| Conv | linear | 51 | |
| 可训练参数总计 | 23.1M |
| 判别器 | 激活 | 输出形状 | 参数量 |
|---|---|---|---|
| 输入图像 | – | – | |
| Conv | LReLU | 64 | |
| Conv | LReLU | 2.3k | |
| Conv | LReLU | 4.6k | |
| 下采样 | – | – | |
| Conv | LReLU | 9.2k | |
| Conv | LReLU | 18k | |
| 下采样 | – | – | |
| Conv | LReLU | 37k | |
| Conv | LReLU | 74k | |
| 下采样 | – | – | |
| Conv | LReLU | 148k | |
| Conv | LReLU | 295k | |
| 下采样 | – | – | |
| Conv | LReLU | 590k | |
| Conv | LReLU | 1.2M | |
| 下采样 | – | – | |
| Conv | LReLU | 2.4M | |
| Conv | LReLU | 2.4M | |
| 下采样 | – | – | |
| Conv | LReLU | 2.4M | |
| Conv | LReLU | 2.4M | |
| 下采样 | – | – | |
| Conv | LReLU | 2.4M | |
| Conv | LReLU | 2.4M | |
| 下采样 | – | – | |
| 小批量标准差 | – | – | |
| Conv | LReLU | 2.4M | |
| Conv | LReLU | 4.2M | |
| 全连接 | linear | 513 | |
| 可训练参数总计 | 23.1M |
表 2:我们在 CelebA-HQ 上用于生成 图像的生成器与判别器。
Table 2 shows network architectures of the full-resolution generator and discriminator that we use with the CelebA-HQ dataset. Both networks consist mainly of replicated 3-layer blocks that we introduce one by one during the course of the training. The last Conv layer of the generator corresponds to the toRGB block in Figure 2, and the first Conv layer of the discriminator similarly corresponds to fromRGB. We start with resolution and train the networks until we have shown the discriminator 800k real images in total. We then alternate between two phases: fade in the first 3-layer block during the next 800k images, stabilize the networks for 800k images, fade in the next 3-layer block during 800k images, etc.
表 2 展示我们在 CelebA-HQ 数据集上使用的全分辨率生成器与判别器网络结构。两个网络主要由复制的 3 层块组成,我们在训练过程中逐个引入。生成器的最后一个 Conv 层对应图 2 中的 toRGB 块,判别器的第一个 Conv 层类似地对应 fromRGB。我们从 分辨率起步,训练网络直到判别器总共见到 80 万张真实图像。然后交替两个阶段:在接下来的 80 万张图像中淡入第一个 3 层块,再稳定网络 80 万张图像,再在 80 万张图像中淡入下一个 3 层块,依此类推。
Our latent vectors correspond to random points on a 512-dimensional hypersphere, and we represent training and generated images in [-1,1]. We use leaky ReLU with leakiness 0.2 in all layers of both networks, except for the last layer that uses linear activation. We do not employ batch normalization, layer normalization, or weight normalization in either network, but we perform pixelwise normalization of the feature vectors after each Conv layer in the generator as described in Section 4.2. We initialize all bias parameters to zero and all weights according to the normal distribution with unit variance. However, we scale the weights with a layer-specific constant at runtime as described in Section 4.1. We inject the across-minibatch standard deviation as an additional feature map at resolution toward the end of the discriminator as described in Section 3. The upsampling and downsampling operations in Table 2 correspond to element replication and average pooling, respectively.
我们的潜向量对应 512 维超球面上的随机点,训练与生成图像表示在 [-1,1]。两个网络除最后一层用线性激活外,所有层使用泄漏 0.2 的 leaky ReLU。两个网络都不使用批归一化、层归一化或权重归一化,但按第 4.2 节所述,在生成器每个 Conv 层之后做特征向量的逐像素归一化。所有偏置参数初始化为零,所有权重按单位方差正态分布初始化。不过,我们按第 4.1 节所述在运行时用逐层常数缩放权重。我们按第 3 节所述,在判别器靠近末端的 分辨率处注入跨小批量标准差作为额外特征图。表 2 中的上采样与下采样操作分别对应 元素复制与平均池化。
We train the networks using Adam (Kingma & Ba, 2015) with , , , and . We do not use any learning rate decay or rampdown, but for visualizing generator output at any given point during the training, we use an exponential running average for the weights of the generator with decay 0.999. We use a minibatch size 16 for resolutions – and then gradually decrease the size according to , , and to avoid exceeding the available memory budget. We use the WGAN-GP loss, but unlike Gulrajani et al. (2017), we alternate between optimizing the generator and discriminator on a per-minibatch basis, i.e., we set . Additionally, we introduce a fourth term into the discriminator loss with an extremely small weight to keep the discriminator output from drifting too far away from zero. To be precise, we set , where .
我们用 Adam(Kingma & Ba,2015)训练网络,取 ,,,。我们不做任何学习率衰减或斜降,但为在训练任意时刻可视化生成器输出,对生成器权重使用衰减 0.999 的指数滑动平均。分辨率 – 用小批量大小 16,随后按 、、 逐渐减小,以免超出可用内存预算。我们使用 WGAN-GP 损失,但与 Gulrajani 等人(2017)不同,我们按每个小批量交替优化生成器与判别器,即设 。此外,我们向判别器损失引入权重极小的第四项,以防判别器输出偏离零太远。精确地说,设 ,其中 。
A.2 Other networks
A.2 其他网络
Whenever we need to operate on a spatial resolution lower than , we do that by leaving out an appropriate number copies of the replicated 3-layer block in both networks.
每当需要在低于 的空间分辨率上运作时,我们通过在两个网络中省略适当数量的复制 3 层块副本来实现。
Furthermore, Section 6.1 uses a slightly lower-capacity version, where we halve the number of feature maps in Conv layers at the resolution, and divide by 4 in the subsequent resolutions. This leaves 32 feature maps to the last Conv layers. In Table 1 and Figure 4 we train each resolution for a total 600k images instead of 800k, and also fade in new layers for the duration of 600k images.
此外,第 6.1 节使用略低容量的版本:我们在 分辨率把 Conv 层的特征图数减半,后续分辨率再除以 4。这使最后的 Conv 层留下 32 个特征图。在表 1 与图 4 中,我们每个分辨率共训练 60 万张图像而非 80 万,淡入新层也持续 60 万张图像。
For the “Gulrajani et al. (2017)” case in Table 1, we follow their training configuration as closely as possible. In particular, we set , , , , and minibatch size 64. We disable progressive resolution, minibatch stddev, as well as weight scaling at runtime, and initialize all weights using He’s initializer (He et al., 2015). Furthermore, we modify the generator by replacing LReLU with ReLU, linear activation with tanh in the last layer, and pixelwise normalization with batch normalization. In the discriminator, we add layer normalization to all Conv and Conv layers. For the latent vectors, we use 128 components sampled independently from the normal distribution.
对表 1 中的“Gulrajani 等人(2017)”情形,我们尽可能贴近他们的训练配置。具体地,设 ,,,,小批量大小 64。我们关闭渐进分辨率、小批量标准差以及运行时权重缩放,并用 He 初始化器(He 等人,2015)初始化所有权重。此外,我们修改生成器:用 ReLU 替换 LReLU,最后一层用 tanh 替换线性激活,用批归一化替换逐像素归一化。在判别器中,我们向所有 Conv 与 Conv 层加入层归一化。潜向量使用从正态分布独立采样的 128 个分量。
Appendix B Least-squares GAN (LSGAN) at
附录 B 上的最小二乘 GAN(LSGAN)
We find that LSGAN is generally a less stable loss function than WGAN-GP, and it also has a tendency to lose some of the variation towards the end of long runs. Thus we prefer WGAN-GP, but have also produced high-resolution images by building on top of LSGAN. For example, the images in Figure 1 are LSGAN-based.
我们发现 LSGAN 总体比 WGAN-GP 更不稳定,在长程训练末尾也倾向于丢失部分多样性。因此我们更偏好 WGAN-GP,但也在 LSGAN 之上生成过高分辨率图像。例如,图 1 中的 图像基于 LSGAN。
On top of the techniques described in Sections 2–4, we need one additional hack with LSGAN that prevents the training from spiraling out of control when the dataset is too easy for the discriminator, and the discriminator gradients are at risk of becoming meaningless as a result. We adaptively increase the magnitude of multiplicative Gaussian noise in discriminator as a function of the discriminator’s output. The noise is applied to the input of each Conv and Conv layer. There is a long history of adding noise to the discriminator, and it is generally detrimental for the image quality (Arjovsky et al., 2017) and ideally one would never have to do that, which according to our tests is the case for WGAN-GP (Gulrajani et al., 2017). The magnitude of noise is determined as , where is an exponential moving average of the discriminator output . The motivation behind this hack is that LSGAN is seriously unstable when approaches (or exceeds) .
在第 2–4 节所述技术之外,对 LSGAN 我们还需要一个额外技巧:当数据集对判别器过于容易、判别器梯度有因此变得无意义的风险时,防止训练失控螺旋。我们按判别器输出自适应增大判别器中乘性高斯噪声的幅度。噪声施加于每个 Conv 与 Conv 层的输入。向判别器加噪声有很长历史,通常对图像质量有害(Arjovsky 等人,2017),理想情况下永远不必这样做——按我们的测试,对 WGAN-GP 就是如此(Gulrajani 等人,2017)。噪声幅度定为 ,其中 是判别器输出 的指数滑动平均。该技巧的动机是:当 接近(或超过) 时,LSGAN 严重不稳定。
Appendix C CelebA-HQ dataset
附录 C CelebA-HQ 数据集
In this section we describe the process we used to create the high-quality version of the CelebA dataset, consisting of 30000 images in resolution. As a starting point, we took the collection of in-the-wild images included as a part of the original CelebA dataset. These images are extremely varied in terms of resolution and visual quality, ranging all the way from to . Some of them show crowds of several people whereas others focus on the face of a single person – often only a part of the face. Thus, we found it necessary to apply several image processing steps to ensure consistent quality and to center the images on the facial region.
本节描述我们用于创建高质量版 CelebA 数据集的过程,该数据集由 30000 张 分辨率图像组成。起点是原始 CelebA 数据集中包含的野外图像集合。这些图像在分辨率与视觉质量上差异极大,从 到 。有些展示多人人群,有些聚焦单人面部——常常只有部分面部。因此,我们发现有必要施加若干图像处理步骤,以确保质量一致并把图像居中到面部区域。
(a) (b) (c) (d) (e) (f)
Figure 8: Creating the CelebA-HQ dataset. We start with a JPEG image (a) from the CelebA in-the-wild dataset. We improve the visual quality (b,top) through JPEG artifact removal (b,middle) and 4x super-resolution (b,bottom). We then extend the image through mirror padding (c) and Gaussian filtering (d) to produce a visually pleasing depth-of-field effect. Finally, we use the facial landmark locations to select an appropriate crop region (e) and perform high-quality resampling to obtain the final image at resolution (f).
(a) (b) (c) (d) (e) (f)
图 8:创建 CelebA-HQ 数据集。我们从 CelebA 野外数据集的 JPEG 图像(a)起步。通过 JPEG 伪影去除(b,中)与 4 倍超分辨率(b,下)提升视觉质量(b,上)。再通过镜像填充(c)与高斯滤波(d)扩展图像,以产生视觉上悦目的景深效果。最后,用面部关键点位置选择合适裁剪区域(e),并做高质量重采样得到最终 分辨率图像(f)。
Our processing pipeline is illustrated in Figure 8. To improve the overall image quality, we pre-process each JPEG image using two pre-trained neural networks: a convolutional autoencoder trained to remove JPEG artifacts in natural images, similar in structure to the proposed by Mao et al. (2016a), and an adversarially-trained 4x super-resolution network (Korobchenko & Foco, 2017) similar to Ledig et al. (2016). To handle cases where the facial region extends outside the image, we employ padding and filtering to extend the dimensions of the image as illustrated in Fig.8(c–d). We then select an oriented crop rectangle based on the facial landmark annotations included in the original CelebA dataset as follows:
我们的处理流水线如图 8 所示。为提升整体图像质量,我们用两个预训练神经网络预处理每张 JPEG 图像:一个在结构上类似 Mao 等人(2016a)所提、训练用于去除自然图像 JPEG 伪影的卷积自编码器,以及一个对抗训练的 4 倍超分辨率网络(Korobchenko & Foco,2017),类似 Ledig 等人(2016)。为处理面部区域超出图像的情形,我们用填充与滤波扩展图像尺寸,如图 8(c–d) 所示。然后基于原始 CelebA 数据集所含面部关键点标注选择有向裁剪矩形,如下:
, , , and represent the 2D pixel locations of the two eye landmarks and two mouth landmarks, respectively, and indicate the center and size of the desired crop rectangle, and and indicate its orientation. We constructed the above formulas empirically to ensure that the crop rectangle stays consistent in cases where the face is viewed from different angles. Once we have calculated the crop rectangle, we transform the rectangle to pixels using bilinear filtering, and then scale it to resolution using a box filter.
、、 与 分别表示两个眼部关键点与两个嘴部关键点的 2D 像素位置, 与 表示期望裁剪矩形的中心与大小, 与 表示其朝向。我们凭经验构造上述公式,以确保在面部从不同角度观察时裁剪矩形保持一致。算出裁剪矩形后,我们用双线性滤波把它变换到 像素,再用盒式滤波器缩放到 分辨率。
We perform the above processing for all 202599 images in the dataset, analyze the resulting images further to estimate the final image quality, sort the images accordingly, and discard all but the best 30000 images. We use a frequency-based quality metric that favors images whose power spectrum contains a broad range of frequencies and is approximately radially symmetric. This penalizes blurry images as well as images that have conspicuous directional features due to, e.g., visible halftoning patterns. We selected the cutoff point of 30000 images as a practical sweet spot between variation and image quality, because it appeared to yield the best results.
我们对数据集中全部 202599 张图像执行上述处理,进一步分析所得 图像以估计最终图像质量,按此排序,并只保留最好的 30000 张。我们使用基于频率的质量指标,偏好功率谱包含宽广频率范围且近似径向对称的图像。这会惩罚模糊图像,以及因可见半色调图案等而有显著方向性特征的图像。我们选取 30000 张作为多样性与图像质量之间的实际甜点,因为它似乎能给出最佳结果。
Appendix D CIFAR10 results
附录 D CIFAR10 结果
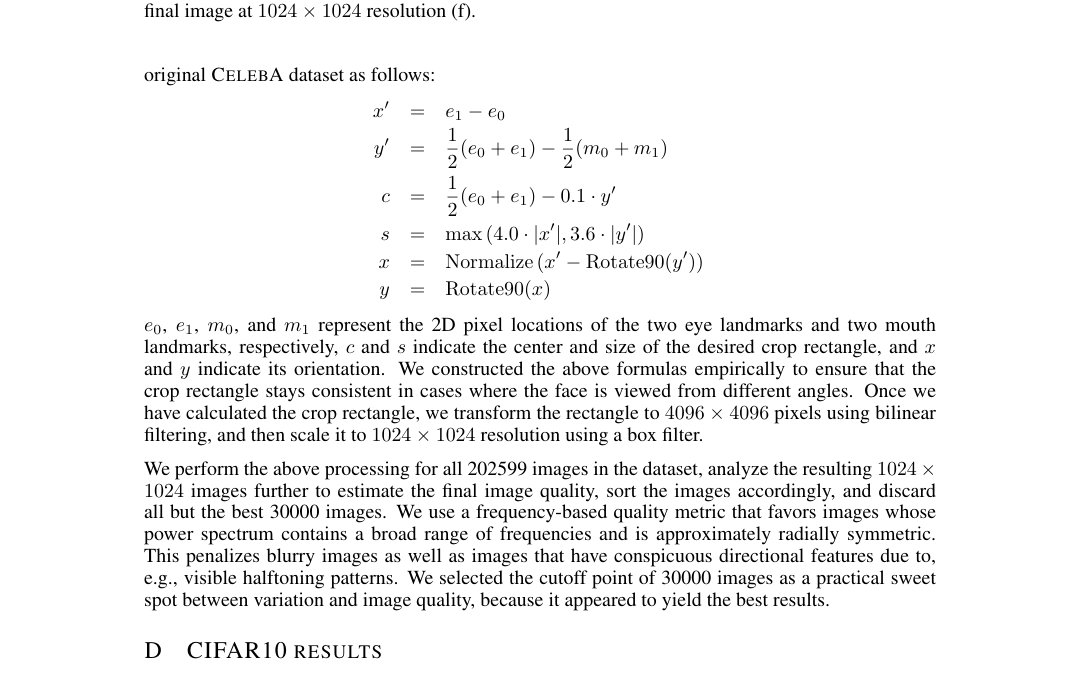
Figure 9: CIFAR10 images generated using a network that was trained unsupervised (no label conditioning), and achieves a record inception score.
图 9:用无监督(无标签条件)训练的网络生成的 CIFAR10 图像,取得创纪录的 inception score 。
Unsupervised Label conditioned Method Inception score ALI (Dumoulin et al., 2016) GMAN (Durugkar et al., 2016) Improved GAN (Salimans et al., 2016) CEGAN-Ent-VI (Dai et al., 2017) LR-AGN (Yang et al., 2017) DFM (Warde-Farley & Bengio, 2017) WGAN-GP (Gulrajani et al., 2017) Splitting GAN (Grinblat et al., 2017) Our (best run) Our (computed from 10 runs) Method Inception score DCGAN (Radford et al., 2015) Improved GAN (Salimans et al., 2016) AC-GAN (Odena et al., 2017) SGAN (Huang et al., 2016) WGAN-GP (Gulrajani et al., 2017) Splitting GAN (Grinblat et al., 2017)
Table 3: CIFAR10 inception scores, higher is better.
无监督 标签条件 方法 Inception score ALI (Dumoulin et al., 2016) GMAN (Durugkar et al., 2016) Improved GAN (Salimans et al., 2016) CEGAN-Ent-VI (Dai et al., 2017) LR-AGN (Yang et al., 2017) DFM (Warde-Farley & Bengio, 2017) WGAN-GP (Gulrajani et al., 2017) Splitting GAN (Grinblat et al., 2017) 本文(最佳一次) 本文(10 次运行统计) 方法 Inception score DCGAN (Radford et al., 2015) Improved GAN (Salimans et al., 2016) AC-GAN (Odena et al., 2017) SGAN (Huang et al., 2016) WGAN-GP (Gulrajani et al., 2017) Splitting GAN (Grinblat et al., 2017)
表 3:CIFAR10 inception score,越高越好。
Figure 9 shows non-curated images generated in the unsupervised setting, and Table 3 compares against prior art in terms of inception scores. We report our scores in two different ways: 1) the highest score observed during training runs (here refers to the standard deviation returned by the inception score calculator) and 2) the mean and standard deviation computed from the highest scores seen during training, starting from ten random initializations. Arguably the latter methodology is much more meaningful as one can be lucky with individual runs (as we were). We did not use any kind of augmentation with this dataset.
图 9 展示无监督设定下未经筛选的生成图像,表 3 按 inception score 与先前工作比较。我们以两种方式报告分数:1) 训练过程中观察到的最高分(此处 指 inception score 计算器返回的标准差);2) 从十个随机初始化起步,取各次训练中见到的最高分再计算均值与标准差。可以说后一种方法有意义得多,因为单次运行可能走运(我们就是如此)。该数据集上我们未使用任何增强。
Appendix E MNIST-1K discrete mode test with crippled discriminator
附录 E 削弱判别器下的 MNIST-1K 离散模态测试
| Arch | GAN | + unrolling | WGAN-GP | + our norm | + mb stddev | + progression | |
|---|---|---|---|---|---|---|---|
| K/4 | # | ||||||
| KL | 0.19 | ||||||
| K/2 | # | ||||||
| KL |
Table 4: Results for MNIST discrete mode test using two tiny discriminators (K/4, K/2) defined by Metz et al. (2016). The number of covered modes (#) and KL divergence from a uniform distribution are given as an average standard deviation over 8 random initializations. Higher is better for the number of modes, and lower is better for KL divergence.
| 结构 | GAN | + 展开 | WGAN-GP | + 我们的归一化 | + 小批量标准差 | + 渐进 | |
|---|---|---|---|---|---|---|---|
| K/4 | # | ||||||
| KL | 0.19 | ||||||
| K/2 | # | ||||||
| KL |
表 4:用 Metz 等人(2016)定义的两个极小判别器(K/4、K/2)做 MNIST 离散模态测试的结果。覆盖模态数(#)以及相对均匀分布的 KL 散度,以 8 次随机初始化的平均 标准差给出。模态数越高越好,KL 散度越低越好。
Metz et al. (2016) describe a setup where a generator synthesizes MNIST digits simultaneously to 3 color channels, the digits are classified using a pre-trained classifier ( error rate in our case), and concatenated to form a number in . They generate a total of 25,600 images and count how many of the discrete modes are covered. They also compute KL divergence as KL(histogram uniform). Modern GAN implementations can trivially cover all modes at very low divergence (0.05 in our case), and thus Metz et al. specify a fairly low-capacity generator and two severely crippled discriminators (“K/2” has params and “K/4” only about ) to tease out differences between training methodologies. Both of these networks use batch normalization.
Metz 等人(2016)描述如下设定:生成器同时向 3 个颜色通道合成 MNIST 数字,用预训练分类器分类这些数字(我们的情形错误率 0.4%),再拼接形成 中的数。他们共生成 25600 张图像,并统计覆盖了多少离散模态。他们还计算 KL(直方图 均匀)。现代 GAN 实现能轻易以极低散度覆盖全部模态(我们的情形为 0.05),因此 Metz 等人指定相当低容量的生成器与两个严重削弱的判别器(“K/2”约 参数,“K/4”仅约 )以拉出训练方法之间的差异。这两个网络都使用批归一化。
As shown in Table 4, using WGAN-GP loss with the networks specified by Metz et al. covers much more modes than the original GAN loss, and even more than the unrolled original GAN with the smaller (K/4) discriminator. The KL divergence, which is arguably a more accurate metric than the raw count, acts even more favorably.
如表 4 所示,对 Metz 等人指定的网络使用 WGAN-GP 损失比原始 GAN 损失覆盖多得多的模态,在更小的(K/4)判别器上甚至超过展开的原始 GAN。可以说比原始计数更准确的 KL 散度表现得更有利。
Replacing batch normalization with our normalization (equalized learning rate, pixelwise normalization) improves the result considerably, while also removing a few trainable parameters from the discriminators. The addition of a minibatch stddev layer further improves the scores, while restoring the discriminator capacity to within of the original. Progression does not help much with these tiny images, but it does not hurt either.
用我们的归一化(均衡学习率、逐像素归一化)替换批归一化后结果显著改善,同时从判别器去掉若干可训练参数。加入小批量标准差层进一步改善分数,同时把判别器容量恢复到原始的 以内。渐进对这类极小图像帮助不大,但也不造成损害。
Appendix F Additional CelebA-HQ results
附录 F 额外的 CelebA-HQ 结果
Figure 10 shows the nearest neighbors found for our generated images. Figure 11 gives additional generated examples from CelebA-HQ. We enabled mirror augmentation for all tests using CelebA and CelebA-HQ. In addition to the sliced Wasserstein distance (SWD), we also quote the recently introduced Fréchet Inception Distance (FID) (Heusel et al., 2017) computed from 50K images.
图 10 展示为我们生成图像找到的近邻。图 11 给出 CelebA-HQ 的额外生成示例。所有使用 CelebA 与 CelebA-HQ 的测试都启用了镜像增强。除切片 Wasserstein 距离(SWD)外,我们还引用最近提出的 Fréchet Inception Distance(FID)(Heusel 等人,2017),由 5 万张图像计算。

Figure 10: Top: Our CelebA-HQ results. Next five rows: Nearest neighbors found from the training data, based on feature-space distance. We used activations from five VGG layers, as suggested by Chen & Koltun (2017). Only the crop highlighted in bottom right image was used for comparison in order to exclude image background and focus the search on matching facial features.
图 10:上:我们的 CelebA-HQ 结果。接下来五行:基于特征空间距离从训练数据中找到的近邻。我们按 Chen & Koltun(2017)的建议使用五个 VGG 层的激活。比较时仅使用右下角图像中高亮的裁剪区域,以排除图像背景并聚焦于匹配面部特征。
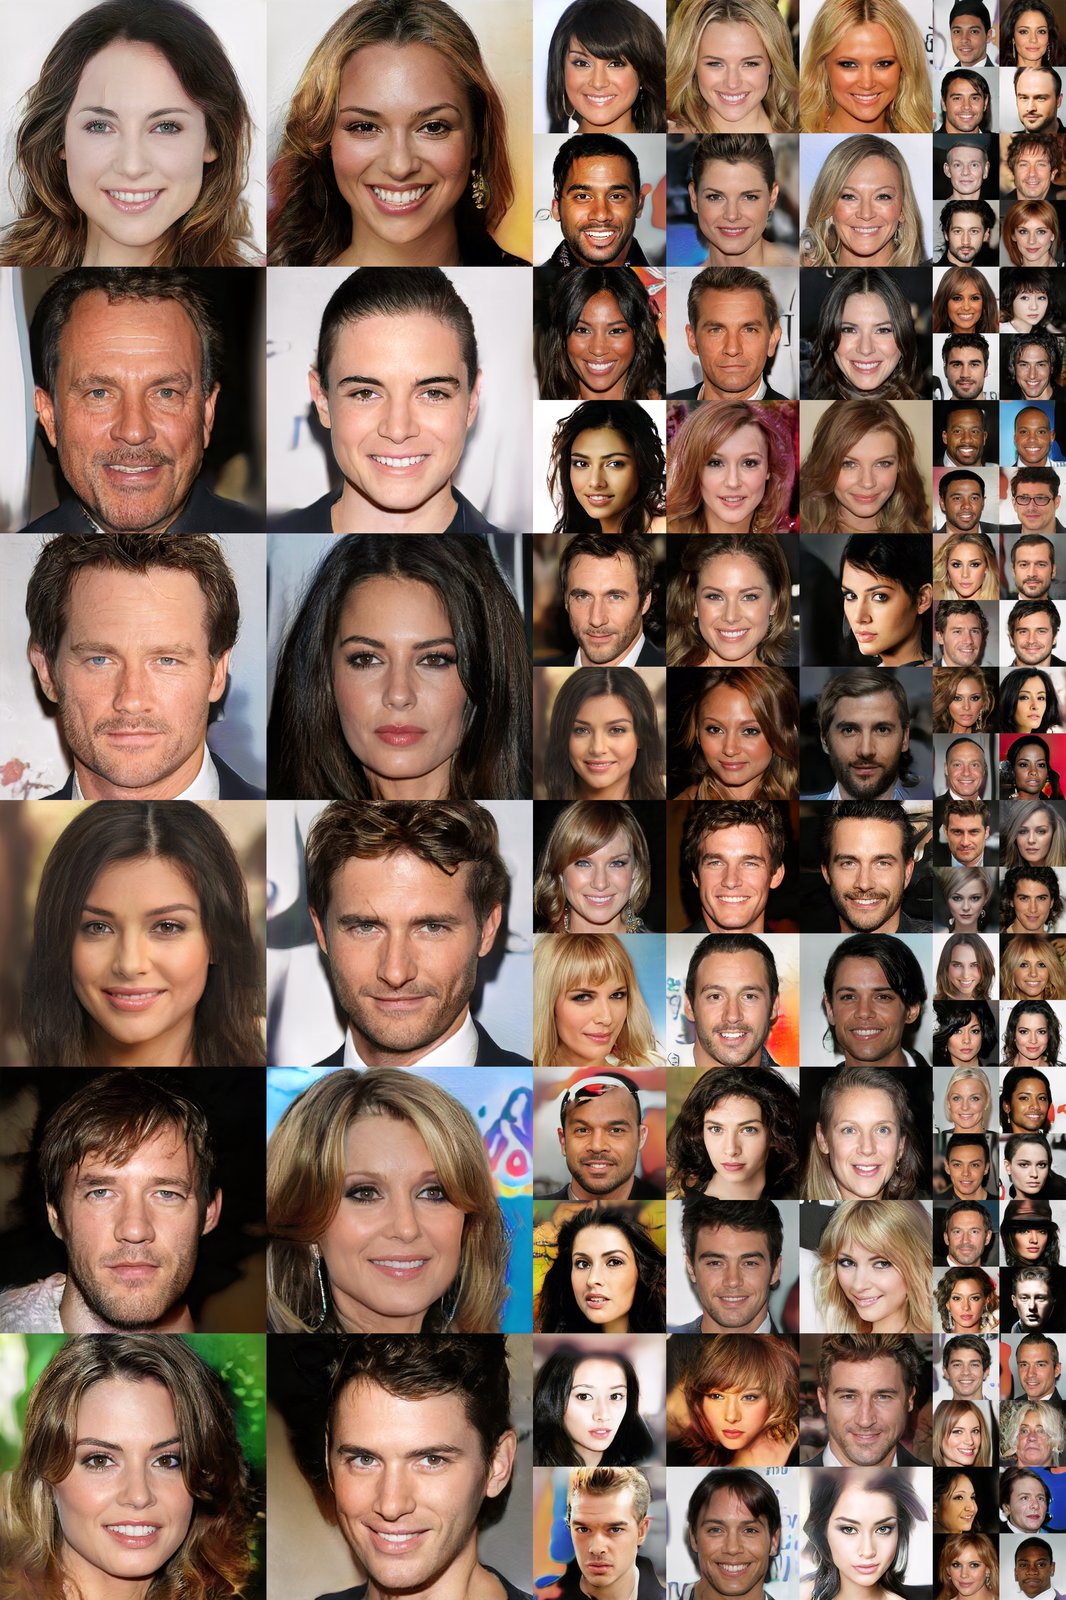
Figure 11: Additional images generated using the CelebA-HQ dataset. Sliced Wasserstein Distance (SWD) for levels 1024, …, 16: 7.48, 7.24, 6.08, 3.51, 3.55, 3.02, 7.22, for which the average is 5.44. Fréchet Inception Distance (FID) computed from 50K images was 7.30. See the video for latent space interpolations.
图 11:用 CelebA-HQ 数据集生成的额外 图像。层级 1024, …, 16 的切片 Wasserstein 距离(SWD):7.48, 7.24, 6.08, 3.51, 3.55, 3.02, 7.22,平均为 5.44。由 5 万张图像计算的 Fréchet Inception Distance(FID)为 7.30。潜空间插值见视频。
Appendix G LSUN results
附录 G LSUN 结果
Figures 12–17 show representative images generated for all 30 LSUN categories. A separate network was trained for each category using identical parameters. All categories were trained using 100k images, except for bedroom and dog that used all the available data. Since 100k images is a very limited amount of training data for most categories, we enabled mirror augmentation in these tests (but not for bedroom or dog).
图 12–17 展示全部 30 个 LSUN 类别的代表性生成图像。每个类别用相同参数单独训练一个网络。除 bedroom 与 dog 使用全部可用数据外,其余类别均用 10 万张图像训练。由于对多数类别 10 万张是非常有限的训练数据,这些测试启用了镜像增强(但 bedroom 与 dog 未启用)。
airplane
FID 13.97
SWD 4.05, 3.27, 3.50, 3.08, 7.54, 4.29
bedroom
FID 8.34
SWD 2.72, 2.45, 2.34, 2.90, 9.08, 3.90
bicycle
FID 16.12
SWD 5.45, 3.33, 2.25, 3.27, 10.20, 4.90
bird
FID 29.91
SWD 4.58, 2.72, 2.65, 2.56, 8.86, 4.28
boat
FID 10.85
SWD 5.75, 3.41, 2.83, 2.67, 4.94, 3.92
Figure 12: Example images generated at from LSUN categories. Sliced Wasserstein Distance (SWD) is given for levels 256, 128, 64, 32 and 16, and the average is bolded. We also quote the Fréchet Inception Distance (FID) computed from 50K images.
airplane
FID 13.97
SWD 4.05, 3.27, 3.50, 3.08, 7.54, 4.29
bedroom
FID 8.34
SWD 2.72, 2.45, 2.34, 2.90, 9.08, 3.90
bicycle
FID 16.12
SWD 5.45, 3.33, 2.25, 3.27, 10.20, 4.90
bird
FID 29.91
SWD 4.58, 2.72, 2.65, 2.56, 8.86, 4.28
boat
FID 10.85
SWD 5.75, 3.41, 2.83, 2.67, 4.94, 3.92
图 12:从 LSUN 类别生成的 示例图像。给出层级 256、128、64、32 与 16 的切片 Wasserstein 距离(SWD),平均加粗。我们也引用由 5 万张图像计算的 Fréchet Inception Distance(FID)。
bottle
FID 22.68
SWD 4.30, 3.17, 2.91, 3.23, 6.06, 3.93
bridge
FID 11.14
SWD 4.39, 4.04, 3.31, 2.55, 7.71, 4.40
bus
FID 6.99
SWD 5.59, 2.90, 2.52, 3.48, 7.89, 4.47
car
FID 8.36
SWD 4.39, 2.26, 2.17, 2.29, 6.39, 3.50
cat
FID 37.52
SWD 12.19, 11.14, 7.47, 5.12, 7.86, 8.76
Figure 13: Example images generated at from LSUN categories. Sliced Wasserstein Distance (SWD) is given for levels 256, 128, 64, 32 and 16, and the average is bolded. We also quote the Fréchet Inception Distance (FID) computed from 50K images.
bottle
FID 22.68
SWD 4.30, 3.17, 2.91, 3.23, 6.06, 3.93
bridge
FID 11.14
SWD 4.39, 4.04, 3.31, 2.55, 7.71, 4.40
bus
FID 6.99
SWD 5.59, 2.90, 2.52, 3.48, 7.89, 4.47
car
FID 8.36
SWD 4.39, 2.26, 2.17, 2.29, 6.39, 3.50
cat
FID 37.52
SWD 12.19, 11.14, 7.47, 5.12, 7.86, 8.76
图 13:从 LSUN 类别生成的 示例图像。给出层级 256、128、64、32 与 16 的切片 Wasserstein 距离(SWD),平均加粗。我们也引用由 5 万张图像计算的 Fréchet Inception Distance(FID)。
chair
FID 19.55
SWD 4.93, 3.70, 3.52, 3.67, 11.43, 5.45
churchoutdoor
FID 6.42
SWD 3.81, 3.63, 3.08, 2.66, 5.55, 3.75
classroom
FID 20.36
SWD 4.11, 3.42, 2.73, 3.01, 6.83, 4.02
conferenceroom
FID 8.31
SWD 3.68, 4.10, 3.15, 2.63, 9.91, 4.70
cow
FID 17.26
SWD 5.57, 2.69, 2.11, 2.24, 6.75, 3.87
Figure 14: Example images generated at from LSUN categories. Sliced Wasserstein Distance (SWD) is given for levels 256, 128, 64, 32 and 16, and the average is bolded. We also quote the Fréchet Inception Distance (FID) computed from 50K images.
chair
FID 19.55
SWD 4.93, 3.70, 3.52, 3.67, 11.43, 5.45
churchoutdoor
FID 6.42
SWD 3.81, 3.63, 3.08, 2.66, 5.55, 3.75
classroom
FID 20.36
SWD 4.11, 3.42, 2.73, 3.01, 6.83, 4.02
conferenceroom
FID 8.31
SWD 3.68, 4.10, 3.15, 2.63, 9.91, 4.70
cow
FID 17.26
SWD 5.57, 2.69, 2.11, 2.24, 6.75, 3.87
图 14:从 LSUN 类别生成的 示例图像。给出层级 256、128、64、32 与 16 的切片 Wasserstein 距离(SWD),平均加粗。我们也引用由 5 万张图像计算的 Fréchet Inception Distance(FID)。
diningroom
FID 6.40
SWD 2.47, 2.94, 2.73, 3.13, 6.32, 3.52
diningtable
FID 10.28
SWD 2.41, 2.51, 2.34, 2.03, 6.82, 3.22
dog
FID 47.63
SWD 9.56, 5.36, 3.06, 2.32, 8.83, 5.83
horse
FID 16.11
SWD 4.78, 2.15, 2.00, 2.03, 6.94, 3.58
kitchen
FID 7.45
SWD 3.89, 3.54, 2.95, 2.72, 6.31, 3.88
Figure 15: Example images generated at from LSUN categories. Sliced Wasserstein Distance (SWD) is given for levels 256, 128, 64, 32 and 16, and the average is bolded. We also quote the Fréchet Inception Distance (FID) computed from 50K images.
diningroom
FID 6.40
SWD 2.47, 2.94, 2.73, 3.13, 6.32, 3.52
diningtable
FID 10.28
SWD 2.41, 2.51, 2.34, 2.03, 6.82, 3.22
dog
FID 47.63
SWD 9.56, 5.36, 3.06, 2.32, 8.83, 5.83
horse
FID 16.11
SWD 4.78, 2.15, 2.00, 2.03, 6.94, 3.58
kitchen
FID 7.45
SWD 3.89, 3.54, 2.95, 2.72, 6.31, 3.88
图 15:从 LSUN 类别生成的 示例图像。给出层级 256、128、64、32 与 16 的切片 Wasserstein 距离(SWD),平均加粗。我们也引用由 5 万张图像计算的 Fréchet Inception Distance(FID)。
livingroom
FID 10.46
SWD 4.55, 3.37, 2.69, 3.22, 5.83, 3.94
motorbike
FID 9.61
SWD 5.80, 2.33, 1.99, 2.04, 10.04, 4.44
person
FID 30.01
SWD 4.20, 2.58, 2.37, 2.31, 7.14, 3.72
pottedplant
FID 13.50
SWD 7.46, 4.13, 3.85, 2.85, 10.90, 5.84
restaurant
FID 16.39
SWD 3.37, 2.16, 2.63, 4.44, 5.55, 3.63
Figure 16: Example images generated at from LSUN categories. Sliced Wasserstein Distance (SWD) is given for levels 256, 128, 64, 32 and 16, and the average is bolded. We also quote the Fréchet Inception Distance (FID) computed from 50K images.
livingroom
FID 10.46
SWD 4.55, 3.37, 2.69, 3.22, 5.83, 3.94
motorbike
FID 9.61
SWD 5.80, 2.33, 1.99, 2.04, 10.04, 4.44
person
FID 30.01
SWD 4.20, 2.58, 2.37, 2.31, 7.14, 3.72
pottedplant
FID 13.50
SWD 7.46, 4.13, 3.85, 2.85, 10.90, 5.84
restaurant
FID 16.39
SWD 3.37, 2.16, 2.63, 4.44, 5.55, 3.63
图 16:从 LSUN 类别生成的 示例图像。给出层级 256、128、64、32 与 16 的切片 Wasserstein 距离(SWD),平均加粗。我们也引用由 5 万张图像计算的 Fréchet Inception Distance(FID)。
sheep
FID 18.18
SWD 5.45, 2.17, 2.10, 2.95, 6.08, 3.75
sofa
FID 8.59
SWD 2.88, 3.37, 3.08, 2.39, 8.96, 4.14
tower
FID 10.29
SWD 3.80, 4.22, 3.49, 2.67, 6.79, 4.19
train
FID 8.90
SWD 5.26, 3.08, 2.98, 3.65, 8.13, 4.62
tvmonitor
FID 22.47
SWD 5.02, 4.53, 3.75, 3.00, 9.37, 5.13
Figure 17: Example images generated at from LSUN categories. Sliced Wasserstein Distance (SWD) is given for levels 256, 128, 64, 32 and 16, and the average is bolded. We also quote the Fréchet Inception Distance (FID) computed from 50K images.
sheep
FID 18.18
SWD 5.45, 2.17, 2.10, 2.95, 6.08, 3.75
sofa
FID 8.59
SWD 2.88, 3.37, 3.08, 2.39, 8.96, 4.14
tower
FID 10.29
SWD 3.80, 4.22, 3.49, 2.67, 6.79, 4.19
train
FID 8.90
SWD 5.26, 3.08, 2.98, 3.65, 8.13, 4.62
tvmonitor
FID 22.47
SWD 5.02, 4.53, 3.75, 3.00, 9.37, 5.13
图 17:从 LSUN 类别生成的 示例图像。给出层级 256、128、64、32 与 16 的切片 Wasserstein 距离(SWD),平均加粗。我们也引用由 5 万张图像计算的 Fréchet Inception Distance(FID)。
Appendix H Additional images for Table 1
附录 H 表 1 的额外图像
Figure 18 shows larger collections of images corresponding to the non-converged setups in Table 1. The training time was intentionally limited to make the differences between various methods more visible.
图 18 展示对应表 1 中未收敛设定的更大图像集合。训练时间被有意限制,以使各种方法之间的差异更可见。
(a) Gulrajani et al. (2017)
(b) Progressive growing
(c) Small minibatch
(d) Revised training parameters
(e) Minibatch discrimination
(e) Minibatch stddev
(f) Equalized learning rate
(g) Pixelwise normalization
Figure 18: A larger set of generated images corresponding to the non-converged setups in Table 1.
(a) Gulrajani 等人(2017)
(b) 渐进式增长
(c) 小批量
(d) 修订训练参数
(e) 小批量判别
(e) 小批量标准差
(f) 均衡学习率
(g) 逐像素归一化
图 18:对应表 1 中未收敛设定的更大生成图像集合。