PointNet++: Deep Hierarchical Feature Learning on Point Sets in a Metric Space
PointNet++: Deep Hierarchical Feature Learning on Point Sets in a Metric Space
PointNet++:度量空间中点集的深度层次特征学习
Charles R. Qi Li Yi Hao Su Leonidas J. Guibas Affiliation: Stanford University
Abstract
摘要
Few prior works study deep learning on point sets. PointNet [20] is a pioneer in this direction. However, by design PointNet does not capture local structures induced by the metric space points live in, limiting its ability to recognize fine-grained patterns and generalizability to complex scenes. In this work, we introduce a hierarchical neural network that applies PointNet recursively on a nested partitioning of the input point set. By exploiting metric space distances, our network is able to learn local features with increasing contextual scales. With further observation that point sets are usually sampled with varying densities, which results in greatly decreased performance for networks trained on uniform densities, we propose novel set learning layers to adaptively combine features from multiple scales. Experiments show that our network called PointNet++ is able to learn deep point set features efficiently and robustly. In particular, results significantly better than state-of-the-art have been obtained on challenging benchmarks of 3D point clouds.
直接在点集上做深度学习的工作此前很少。PointNet [20] 是这一方向的先驱,但按设计并不刻画点所在度量空间诱导的局部结构,因而难以识别细粒度模式,也难以泛化到复杂场景。本文提出一种层次神经网络:在输入点集的嵌套划分上递归地应用 PointNet。借助度量空间中的距离,网络能以逐渐增大的上下文尺度学习局部特征。进一步观察到,点集采样密度往往不均匀,这会显著损害在均匀密度上训练的网络;为此我们提出新的集合学习层,自适应地融合多尺度特征。实验表明,名为 PointNet++ 的网络能够高效、稳健地学习深度点集特征,并在具有挑战性的三维点云基准上显著优于当时最优方法。
1 Introduction
1 引言
We are interested in analyzing geometric point sets which are collections of points in a Euclidean space. A particularly important type of geometric point set is point cloud captured by 3D scanners, e.g., from appropriately equipped autonomous vehicles. As a set, such data has to be invariant to permutations of its members. In addition, the distance metric defines local neighborhoods that may exhibit different properties. For example, the density and other attributes of points may not be uniform across different locations — in 3D scanning the density variability can come from perspective effects, radial density variations, motion, etc.
我们关注欧氏空间中的几何点集,即点的集合。一类特别重要的数据是三维扫描仪采集的点云,例如配备相应传感器的自动驾驶车辆。作为集合,这类数据应对成员置换保持不变;同时距离度量定义了可能具有不同性质的局部邻域。例如,不同位置的密度与其他属性可以不均匀——三维扫描中,密度变化可来自透视效应、径向密度变化、运动等。
Few prior works study deep learning on point sets. PointNet [20] is a pioneering effort that directly processes point sets. The basic idea of PointNet is to learn a spatial encoding of each point and then aggregate all individual point features to a global point cloud signature. By its design, PointNet does not capture local structure induced by the metric. However, exploiting local structure has proven to be important for the success of convolutional architectures. A CNN takes data defined on regular grids as the input and is able to progressively capture features at increasingly larger scales along a multi-resolution hierarchy. At lower levels neurons have smaller receptive fields whereas at higher levels they have larger receptive fields. The ability to abstract local patterns along the hierarchy allows better generalizability to unseen cases.
直接在点集上做深度学习的工作此前很少。PointNet [20] 是直接处理点集的开创性尝试:先学习每个点的空间编码,再把各点特征聚合成全局点云签名。按设计,PointNet 并不刻画度量诱导的局部结构。然而利用局部结构已被证明对卷积架构的成功至关重要:CNN 以规则网格上的数据为输入,并沿多分辨率层次逐步捕获越来越大尺度的特征;低层神经元感受野较小,高层较大。沿层次抽象局部模式,有助于更好地泛化到未见情形。
We introduce a hierarchical neural network, named as PointNet++, to process a set of points sampled in a metric space in a hierarchical fashion. The general idea of PointNet++ is simple. We first partition the set of points into overlapping local regions by the distance metric of the underlying space. Similar to CNNs, we extract local features capturing fine geometric structures from small neighborhoods; such local features are further grouped into larger units and processed to produce higher level features. This process is repeated until we obtain the features of the whole point set.
我们提出名为 PointNet++ 的层次神经网络,以层次方式处理度量空间中采样的点集。基本想法很简单:先按底层空间的距离度量把点集划分为重叠的局部区域;类似 CNN,从小邻域提取刻画精细几何结构的局部特征;再把这些局部特征组成更大单元并处理,得到更高层特征。重复这一过程,直到得到整个点集的特征。
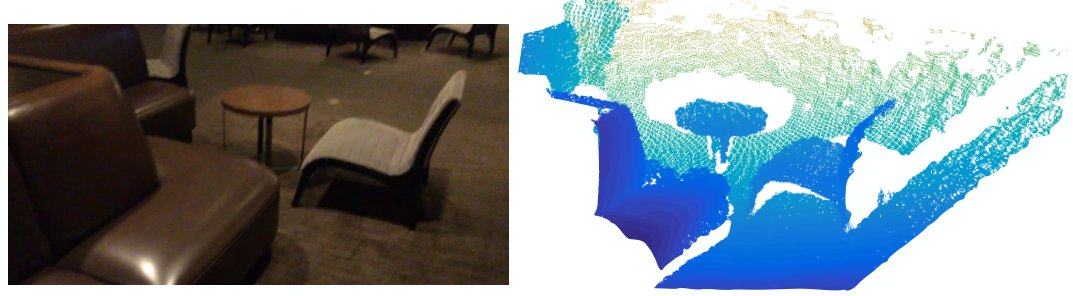
Figure 1: Visualization of a scan captured from a Structure Sensor (left: RGB; right: point cloud).
图 1:Structure Sensor 扫描可视化(左:RGB;右:点云)。
The design of PointNet++ has to address two issues: how to generate the partitioning of the point set, and how to abstract sets of points or local features through a local feature learner. The two issues are correlated because the partitioning of the point set has to produce common structures across partitions, so that weights of local feature learners can be shared, as in the convolutional setting. We choose our local feature learner to be PointNet. As demonstrated in that work, PointNet is an effective architecture to process an unordered set of points for semantic feature extraction. In addition, this architecture is robust to input data corruption. As a basic building block, PointNet abstracts sets of local points or features into higher level representations. In this view, PointNet++ applies PointNet recursively on a nested partitioning of the input set.
PointNet++ 的设计需回答两个问题:如何生成点集的划分,以及如何通过局部特征学习器抽象点集或局部特征。二者相互关联,因为划分须在各分区间产生可共享的结构,才能像卷积设定那样共享局部特征学习器的权重。我们选择 PointNet 作为局部特征学习器:该工作已表明,PointNet 能有效处理无序点集以抽取语义特征,并对输入损坏稳健。作为基本构件,PointNet 把局部点或特征集合抽象成更高层表示。在此视角下,PointNet++ 是在输入集合的嵌套划分上递归地应用 PointNet。
One issue that still remains is how to generate overlapping partitioning of a point set. Each partition is defined as a neighborhood ball in the underlying Euclidean space, whose parameters include centroid location and scale. To evenly cover the whole set, the centroids are selected among input point set by a farthest point sampling (FPS) algorithm. Compared with volumetric CNNs that scan the space with fixed strides, our local receptive fields are dependent on both the input data and the metric, and thus more efficient and effective.
仍待解决的是如何生成点集的重叠划分。每个分区定义为底层欧氏空间中的邻域球,参数包括中心位置与尺度。为均匀覆盖整个集合,中心从输入点中由最远点采样(FPS)算法选出。相对以固定步长扫描空间的体素 CNN,我们的局部感受野同时依赖输入数据与度量,因而更高效、更有效。
Deciding the appropriate scale of local neighborhood balls, however, is a more challenging yet intriguing problem, due to the entanglement of feature scale and non-uniformity of input point set. We assume that the input point set may have variable density at different areas, which is quite common in real data such as Structure Sensor scanning [18] (see Fig. 1). Our input point set is thus very different from CNN inputs which can be viewed as data defined on regular grids with uniform constant density. In CNNs, the counterpart to local partition scale is the size of kernels. [25] shows that using smaller kernels helps to improve the ability of CNNs. Our experiments on point set data, however, give counter evidence to this rule. Small neighborhood may consist of too few points due to sampling deficiency, which might be insufficient to allow PointNets to capture patterns robustly.
然而,确定局部邻域球的合适尺度更具挑战也更有意思,因为特征尺度与输入点集的非均匀性纠缠在一起。我们假定输入点集在不同区域可有可变密度,这在 Structure Sensor 扫描等真实数据中很常见 [18](见图 1)。因此输入点集与可视为规则网格上均匀恒定密度的 CNN 输入很不相同。在 CNN 中,与局部分区尺度对应的是卷积核大小。[25] 表明使用更小的核有助于提升 CNN;但我们在点集数据上的实验给出了相反证据:因采样不足,小邻域可能只含很少的点,不足以让 PointNet 稳健地捕获模式。
A significant contribution of our paper is that PointNet++ leverages neighborhoods at multiple scales to achieve both robustness and detail capture. Assisted with random input dropout during training, the network learns to adaptively weight patterns detected at different scales and combine multi-scale features according to the input data. Experiments show that our PointNet++ is able to process point sets efficiently and robustly. In particular, results that are significantly better than state-of-the-art have been obtained on challenging benchmarks of 3D point clouds.
本文的一项重要贡献是:PointNet++ 利用多尺度邻域,兼顾稳健性与细节刻画。再配合训练时的随机输入丢弃,网络学会自适应地对不同尺度检测到的模式加权,并按输入数据融合多尺度特征。实验表明 PointNet++ 能高效、稳健地处理点集,并在具有挑战性的三维点云基准上显著优于当时最优方法。
2 Problem Statement
2 问题陈述
Suppose that is a discrete metric space whose metric is inherited from a Euclidean space , where is the set of points and is the distance metric. In addition, the density of in the ambient Euclidean space may not be uniform everywhere. We are interested in learning set functions that take such as the input (along with additional features for each point) and produce information of semantic interest regrading . In practice, such can be classification function that assigns a label to or a segmentation function that assigns a per point label to each member of .
设 为离散度量空间,其度量继承自欧氏空间 ,其中 为点集, 为距离度量。此外, 在外围欧氏空间中的密度未必处处均匀。我们希望学习集合函数 ,以这样的 (以及每个点的附加特征)为输入,产出关于 的语义信息。实践中, 可以是给 赋标签的分类函数,或给 中每个成员赋逐点标签的分割函数。
3 Method
3 方法
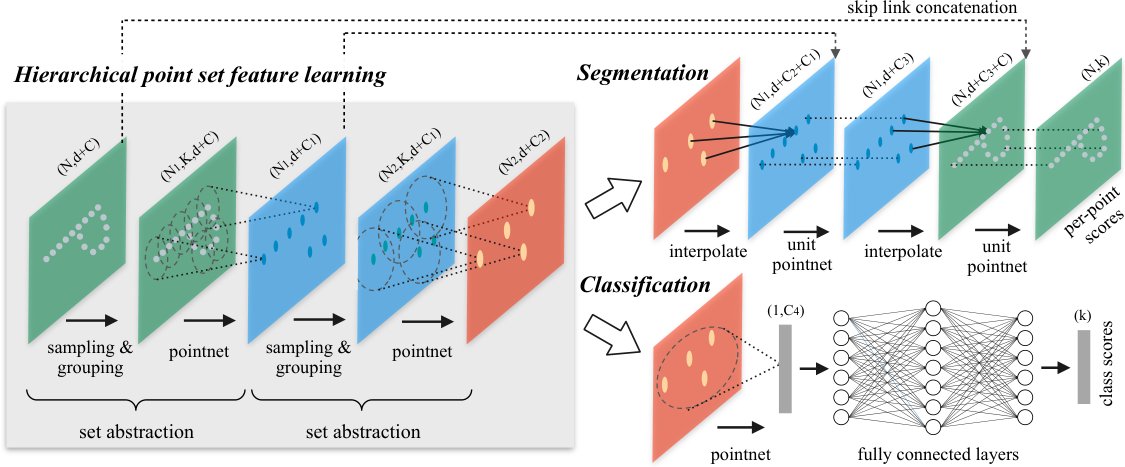
Figure 2: Illustration of our hierarchical feature learning architecture and its application for set segmentation and classification using points in 2D Euclidean space as an example. Single scale point grouping is visualized here. For details on density adaptive grouping, see Fig. 3
图 2:层次特征学习架构示意,及其在集合分割与分类上的应用(以二维欧氏空间中的点为例)。此处可视化单尺度点分组;密度自适应分组细节见图 3。
Our work can be viewed as an extension of PointNet [20] with added hierarchical structure. We first review PointNet (Sec. 3.1) and then introduce a basic extension of PointNet with hierarchical structure (Sec. 3.2). Finally, we propose our PointNet++ that is able to robustly learn features even in non-uniformly sampled point sets (Sec. 3.3).
本文可视为在 PointNet [20] 上增加层次结构的扩展。我们先回顾 PointNet(第 3.1 节),再给出带层次结构的基本扩展(第 3.2 节),最后提出即便在非均匀采样点集上也能稳健学习特征的 PointNet++(第 3.3 节)。
3.1 Review of PointNet [20]: A Universal Continuous Set Function Approximator
3.1 回顾 PointNet [20]:通用连续集合函数逼近器
Given an unordered point set with , one can define a set function that maps a set of points to a vector:
给定无序点集 ,其中 ,可定义把点集映到向量的集合函数 :
where and are usually multi-layer perceptron (MLP) networks.
其中 与 通常为多层感知机(MLP)网络。
The set function in Eq. 1 is invariant to input point permutations and can arbitrarily approximate any continuous set function [20]. Note that the response of can be interpreted as the spatial encoding of a point (see [20] for details).
式 1 中的集合函数 对输入点置换不变,并可任意逼近任意连续集合函数 [20]。注意 的响应可解释为点的空间编码(细节见 [20])。
PointNet achieved impressive performance on a few benchmarks. However, it lacks the ability to capture local context at different scales. We will introduce a hierarchical feature learning framework in the next section to resolve the limitation.
PointNet 在若干基准上取得了出色表现,但缺乏在不同尺度捕获局部上下文的能力。下一节将引入层次特征学习框架以弥补这一局限。
3.2 Hierarchical Point Set Feature Learning
3.2 层次点集特征学习
While PointNet uses a single max pooling operation to aggregate the whole point set, our new architecture builds a hierarchical grouping of points and progressively abstract larger and larger local regions along the hierarchy.
PointNet 用单次最大池化聚合整个点集;我们的新架构则构建点的层次分组,并沿层次逐步抽象越来越大的局部区域。
Our hierarchical structure is composed by a number of set abstraction levels (Fig. 2). At each level, a set of points is processed and abstracted to produce a new set with fewer elements. The set abstraction level is made of three key layers: Sampling layer, Grouping layer and PointNet layer. The Sampling layer selects a set of points from input points, which defines the centroids of local regions. Grouping layer then constructs local region sets by finding “neighboring” points around the centroids. PointNet layer uses a mini-PointNet to encode local region patterns into feature vectors.
层次结构由若干集合抽象层组成(图 2)。每一层处理一组点并加以抽象,产出元素更少的新集合。集合抽象层由三个关键层构成:采样层、分组层与 PointNet 层。采样层从输入点中选出一组点,定义为局部区域的中心;分组层再在中心周围寻找「邻近」点,构造局部区域集合;PointNet 层用一个迷你 PointNet 把局部区域模式编码成特征向量。
A set abstraction level takes an matrix as input that is from points with -dim coordinates and -dim point feature. It outputs an matrix of subsampled points with -dim coordinates and new -dim feature vectors summarizing local context. We introduce the layers of a set abstraction level in the following paragraphs.
一个集合抽象层的输入是 矩阵,来自带 维坐标与 维点特征的 个点;输出是 矩阵,由 个下采样点及其总结局部上下文的新 维特征向量组成。下文介绍集合抽象层中的各层。
Sampling layer.
Given input points , we use iterative farthest point sampling (FPS) to choose a subset of points , such that is the most distant point (in metric distance) from the set with regard to the rest points. Compared with random sampling, it has better coverage of the entire point set given the same number of centroids. In contrast to CNNs that scan the vector space agnostic of data distribution, our sampling strategy generates receptive fields in a data dependent manner.
采样层。
给定输入点 ,我们用迭代最远点采样(FPS)选出子集 ,使得 是相对集合 在度量距离下最远的点。相对随机采样,在中心数量相同的情况下,FPS 对整个点集的覆盖更好。与不依赖数据分布、在向量空间中扫描的 CNN 不同,我们的采样策略以数据依赖的方式生成感受野。
Grouping layer.
The input to this layer is a point set of size and the coordinates of a set of centroids of size . The output are groups of point sets of size , where each group corresponds to a local region and is the number of points in the neighborhood of centroid points. Note that varies across groups but the succeeding PointNet layer is able to convert flexible number of points into a fixed length local region feature vector.
分组层。
该层输入是大小为 的点集,以及大小为 的一组中心坐标;输出是大小为 的点集组,每组对应一个局部区域, 为中心点邻域中的点数。注意各组的 可变,但后续 PointNet 层能把可变数量的点转换成固定长度的局部区域特征向量。
In convolutional neural networks, a local region of a pixel consists of pixels with array indices within certain Manhattan distance (kernel size) of the pixel. In a point set sampled from a metric space, the neighborhood of a point is defined by metric distance.
在卷积神经网络中,像素的局部区域由数组索引落在该像素一定曼哈顿距离(核大小)内的像素组成。在度量空间采样的点集中,点的邻域由度量距离定义。
Ball query finds all points that are within a radius to the query point (an upper limit of is set in implementation). An alternative range query is nearest neighbor (kNN) search which finds a fixed number of neighboring points. Compared with kNN, ball query’s local neighborhood guarantees a fixed region scale thus making local region feature more generalizable across space, which is preferred for tasks requiring local pattern recognition (e.g. semantic point labeling).
球查询找出与查询点距离在半径内的所有点(实现中对 设上限)。另一种范围查询是 近邻(kNN)搜索,固定邻近点数。相对 kNN,球查询的局部邻域保证固定区域尺度,从而使局部区域特征更易跨空间泛化,这对需要识别局部模式的任务(如语义点标注)更有利。
PointNet layer.
In this layer, the input are local regions of points with data size . Each local region in the output is abstracted by its centroid and local feature that encodes the centroid’s neighborhood. Output data size is .
PointNet 层。
该层输入为 个局部区域,数据大小 。输出中每个局部区域由其重心与编码该重心邻域的局部特征抽象;输出数据大小为 。
The coordinates of points in a local region are firstly translated into a local frame relative to the centroid point: for and where is the coordinate of the centroid. We use PointNet [20] as described in Sec. 3.1 as the basic building block for local pattern learning. By using relative coordinates together with point features we can capture point-to-point relations in the local region.
局部区域内点的坐标先平移到相对重心的局部坐标系:,其中 ,, 为重心坐标。我们以第 3.1 节所述的 PointNet [20] 作为学习局部模式的基本构件。结合相对坐标与点特征,即可刻画局部区域内的点到点关系。
3.3 Robust Feature Learning under Non-Uniform Sampling Density
3.3 非均匀采样密度下的稳健特征学习
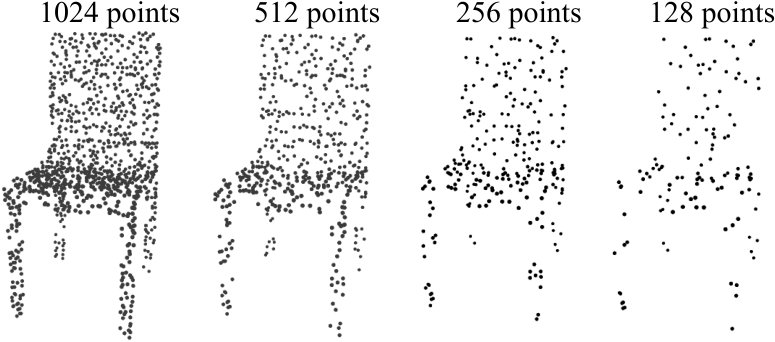
Figure 3: (a) Multi-scale grouping (MSG); (b) Multi-resolution grouping (MRG).
图 3:(a) 多尺度分组(MSG);(b) 多分辨率分组(MRG)。
As discussed earlier, it is common that a point set comes with non-uniform density in different areas. Such non-uniformity introduces a significant challenge for point set feature learning. Features learned in dense data may not generalize to sparsely sampled regions. Consequently, models trained for sparse point cloud may not recognize fine-grained local structures.
如前所述,点集在不同区域密度不均很常见。这种非均匀性给点集特征学习带来显著挑战:在稠密数据上学到的特征未必泛化到稀疏采样区域;为稀疏点云训练的模型也可能识别不出细粒度局部结构。
Ideally, we want to inspect as closely as possible into a point set to capture finest details in densely sampled regions. However, such close inspect is prohibited at low density areas because local patterns may be corrupted by the sampling deficiency. In this case, we should look for larger scale patterns in greater vicinity. To achieve this goal we propose density adaptive PointNet layers (Fig. 3) that learn to combine features from regions of different scales when the input sampling density changes. We call our hierarchical network with density adaptive PointNet layers as PointNet++.
理想情况下,我们希望在稠密采样区域尽可能近距离观察点集以捕获最细细节;但在低密度区域,这种近距离观察会因采样不足而破坏局部模式,此时应在更大邻域寻找更粗尺度的模式。为此我们提出密度自适应的 PointNet 层(图 3),在输入采样密度变化时学会融合不同尺度区域的特征。我们把带密度自适应 PointNet 层的层次网络称为 PointNet++。
Previously in Sec. 3.2, each abstraction level contains grouping and feature extraction of a single scale. In PointNet++, each abstraction level extracts multiple scales of local patterns and combine them intelligently according to local point densities. In terms of grouping local regions and combining features from different scales, we propose two types of density adaptive layers as listed below.
在第 3.2 节中,每个抽象层只做单尺度的分组与特征提取。在 PointNet++ 中,每个抽象层提取多尺度局部模式,并按局部点密度智能融合。关于局部区域分组与跨尺度特征融合,我们提出以下两类密度自适应层。
Multi-scale grouping (MSG).
As shown in Fig. 3 (a), a simple but effective way to capture multi-scale patterns is to apply grouping layers with different scales followed by according PointNets to extract features of each scale. Features at different scales are concatenated to form a multi-scale feature.
多尺度分组(MSG)。
如图 3 (a) 所示,捕获多尺度模式的一种简单而有效的方式,是用不同尺度的分组层,再接相应的 PointNet 提取各尺度特征,最后拼接成多尺度特征。
We train the network to learn an optimized strategy to combine the multi-scale features. This is done by randomly dropping out input points with a randomized probability for each instance, which we call random input dropout. Specifically, for each training point set, we choose a dropout ratio uniformly sampled from where . For each point, we randomly drop a point with probability . In practice we set to avoid generating empty point sets. In doing so we present the network with training sets of various sparsity (induced by ) and varying uniformity (induced by randomness in dropout). During test, we keep all available points.
我们训练网络学习优化的多尺度特征融合策略:对每个训练实例以随机概率丢弃输入点,称为随机输入丢弃。具体地,对每个训练点集,从 ()均匀采样丢弃比例 ,再对每个点以概率 随机丢弃。实践中取 ,以避免空点集。由此网络见到由 诱导的不同稀疏度、以及由随机丢弃诱导的不同均匀性。测试时保留全部可用点。
Multi-resolution grouping (MRG).
The MSG approach above is computationally expensive since it runs local PointNet at large scale neighborhoods for every centroid point. In particular, since the number of centroid points is usually quite large at the lowest level, the time cost is significant.
多分辨率分组(MRG)。
上述 MSG 计算代价较高,因为要对每个中心点在大尺度邻域上跑局部 PointNet;尤其在最低层中心点数量通常很大时,时间开销显著。
Here we propose an alternative approach that avoids such expensive computation but still preserves the ability to adaptively aggregate information according to the distributional properties of points. In Fig. 3 (b), features of a region at some level is a concatenation of two vectors. One vector (left in figure) is obtained by summarizing the features at each subregion from the lower level using the set abstraction level. The other vector (right) is the feature that is obtained by directly processing all raw points in the local region using a single PointNet.
这里提出一种替代方案:避免上述昂贵计算,同时仍能按点的分布性质自适应聚合信息。在图 3 (b) 中,某层 的区域特征是两个向量的拼接。一个向量(图左)通过对下层 各子区域特征做集合抽象得到;另一个向量(图右)则直接用单个 PointNet 处理该局部区域内的全部原始点得到。
When the density of a local region is low, the first vector may be less reliable than the second vector, since the subregion in computing the first vector contains even sparser points and suffers more from sampling deficiency. In such a case, the second vector should be weighted higher. On the other hand, when the density of a local region is high, the first vector provides information of finer details since it possesses the ability to inspect at higher resolutions recursively in lower levels.
当局部区域密度较低时,第一个向量可能不如第二个可靠,因为计算第一个向量时子区域点更稀疏、更易受采样不足影响,此时应提高第二个向量的权重。反之,当局部区域密度高时,第一个向量能提供更细的细节,因为它具备在下层递归地以更高分辨率观察的能力。
Compared with MSG, this method is computationally more efficient since we avoids the feature extraction in large scale neighborhoods at lowest levels.
相对 MSG,该方法计算更高效,因为避免了在最低层对大尺度邻域做特征提取。
3.4 Point Feature Propagation for Set Segmentation
3.4 面向集合分割的点特征传播
In set abstraction layer, the original point set is subsampled. However in set segmentation task such as semantic point labeling, we want to obtain point features for all the original points. One solution is to always sample all points as centroids in all set abstraction levels, which however results in high computation cost. Another way is to propagate features from subsampled points to the original points.
在集合抽象层中,原始点集被下采样。但在语义点标注等集合分割任务中,我们希望得到全部原始点的点特征。一种办法是在所有集合抽象层始终把所有点当作中心采样,但计算代价很高;另一种办法是把特征从下采样点传播回原始点。
We adopt a hierarchical propagation strategy with distance based interpolation and across level skip links (as shown in Fig. 2). In a feature propagation level, we propagate point features from points to points where and (with ) are point set size of input and output of set abstraction level . We achieve feature propagation by interpolating feature values of points at coordinates of the points. Among the many choices for interpolation, we use inverse distance weighted average based on nearest neighbors (as in Eq. 2, in default we use , ). The interpolated features on points are then concatenated with skip linked point features from the set abstraction level. Then the concatenated features are passed through a “unit pointnet”, which is similar to one-by-one convolution in CNNs. A few shared fully connected and ReLU layers are applied to update each point’s feature vector. The process is repeated until we have propagated features to the original set of points.
我们采用基于距离插值与跨层跳跃连接的层次传播策略(见图 2)。在特征传播层中,把 个点的特征传播到 个点,其中 、()分别为集合抽象层 输入与输出的点集大小。做法是:在 个点的坐标处,对 个点的特征值 做插值。诸多插值方案中,我们使用基于 近邻的反距离加权平均(式 2,默认 ,)。插值得到的 点特征再与集合抽象层经跳跃连接传来的点特征拼接,然后送入类似 CNN 中逐点卷积的「单位 PointNet」:若干共享全连接与 ReLU 层更新每个点的特征向量。重复该过程,直到特征传播到原始点集。
4 Experiments
4 实验
Datasets
We evaluate on four datasets ranging from 2D objects (MNIST [11]), 3D objects (ModelNet40 [31] rigid object, SHREC15 [12] non-rigid object) to real 3D scenes (ScanNet [5]). Object classification is evaluated by accuracy. Semantic scene labeling is evaluated by average voxel classification accuracy following [5]. We list below the experiment setting for each dataset:
数据集
我们在四类数据集上评测:二维物体(MNIST [11])、三维物体(ModelNet40 [31] 刚体、SHREC15 [12] 非刚体)以及真实三维场景(ScanNet [5])。物体分类以准确率为指标;语义场景标注按 [5] 报告平均体素分类准确率。各数据集设定如下:
- • MNIST: Images of handwritten digits with 60k training and 10k testing samples.
- • MNIST:手写数字图像,训练 6 万、测试 1 万。
- • ModelNet40: CAD models of 40 categories (mostly man-made). We use the official split with 9,843 shapes for training and 2,468 for testing.
- • ModelNet40:40 类 CAD 模型(多为人造物体)。采用官方划分:训练 9843、测试 2468。
- • SHREC15: 1200 shapes from 50 categories. Each category contains 24 shapes which are mostly organic ones with various poses such as horses, cats, etc. We use five fold cross validation to acquire classification accuracy on this dataset.
- • SHREC15:50 类共 1200 个形状。每类 24 个形状,多为马、猫等不同姿态的有机形体。用五折交叉验证得到分类准确率。
- • ScanNet: 1513 scanned and reconstructed indoor scenes. We follow the experiment setting in [5] and use 1201 scenes for training, 312 scenes for test.
- • ScanNet:1513 个扫描并重建的室内场景。按 [5] 设定,训练 1201、测试 312。
4.1 Point Set Classification in Euclidean Metric Space
4.1 欧氏度量空间中的点集分类
We evaluate our network on classifying point clouds sampled from both 2D (MNIST) and 3D (ModleNet40) Euclidean spaces. MNIST images are converted to 2D point clouds of digit pixel locations. 3D point clouds are sampled from mesh surfaces from ModelNet40 shapes. In default we use 512 points for MNIST and 1024 points for ModelNet40. In last row (ours normal) in Table 2, we use face normals as additional point features, where we also use more points () to further boost performance. All point sets are normalized to be zero mean and within a unit ball. We use a three-level hierarchical network with three fully connected layers [^1]
我们在二维(MNIST)与三维(ModelNet40)欧氏空间采样的点云分类上评测。MNIST 图像转为数字像素位置构成的二维点云;三维点云从 ModelNet40 形状的网格表面采样。默认 MNIST 用 512 点,ModelNet40 用 1024 点。表 2 最后一行(ours normal)把面法向作为附加点特征,并用更多点()进一步提升表现。所有点集归一化为零均值并落在单位球内。我们使用三层层次网络加三个全连接层 [^1]
Results.
In Table 2 and Table 2, we compare our method with a representative set of previous state of the arts. Note that PointNet (vanilla) in Table 2 is the the version in [20] that does not use transformation networks, which is equivalent to our hierarchical net with only one level.
结果。
在表 2 与表 2 中,我们与一组代表性的先前最优方法比较。注意表 2 中的 PointNet (vanilla) 是 [20] 中不使用变换网络的版本,等价于我们层次网络只保留一层的情形。
Firstly, our hierarchical learning architecture achieves significantly better performance than the non-hierarchical PointNet [20]. In MNIST, we see a relative 60.8% and 34.6% error rate reduction from PointNet (vanilla) and PointNet to our method. In ModelNet40 classification, we also see that using same input data size (1024 points) and features (coordinates only), ours is remarkably stronger than PointNet. Secondly, we observe that point set based method can even achieve better or similar performance as mature image CNNs. In MNIST, our method (based on 2D point set) is achieving an accuracy close to the Network in Network CNN. In ModelNet40, ours with normal information significantly outperforms previous state-of-the-art method MVCNN [26].
首先,层次学习架构显著优于非层次的 PointNet [20]。在 MNIST 上,相对 PointNet (vanilla) 与 PointNet,我们的方法分别相对降低 60.8% 与 34.6% 的错误率。在 ModelNet40 分类上,使用相同输入规模(1024 点)与特征(仅坐标)时,我们也明显强于 PointNet。其次,基于点集的方法甚至可达到与成熟图像 CNN 相当或更好的表现:MNIST 上我们的方法(基于二维点集)准确率接近 Network in Network CNN;ModelNet40 上带法向信息的版本显著超过先前最优的 MVCNN [26]。
| Method | Error rate (%) |
|---|---|
| Multi-layer perceptron [24] | 1.60 |
| LeNet5 [11] | 0.80 |
| Network in Network [13] | 0.47 |
| PointNet (vanilla) [20] | 1.30 |
| PointNet [20] | 0.78 |
| Ours | 0.51 |
| Method | Input | Accuracy (%) |
|---|---|---|
| Subvolume [21] | vox | 89.2 |
| MVCNN [26] | img | 90.1 |
| PointNet (vanilla) [20] | pc | 87.2 |
| PointNet [20] | pc | 89.2 |
| Ours | pc | 90.7 |
| Ours (with normal) | pc | 91.9 |
Table 1: MNIST digit classification.
| 方法 | 错误率 (%) |
|---|---|
| Multi-layer perceptron [24] | 1.60 |
| LeNet5 [11] | 0.80 |
| Network in Network [13] | 0.47 |
| PointNet (vanilla) [20] | 1.30 |
| PointNet [20] | 0.78 |
| Ours | 0.51 |
| 方法 | 输入 | 准确率 (%) |
|---|---|---|
| Subvolume [21] | vox | 89.2 |
| MVCNN [26] | img | 90.1 |
| PointNet (vanilla) [20] | pc | 87.2 |
| PointNet [20] | pc | 89.2 |
| Ours | pc | 90.7 |
| Ours (with normal) | pc | 91.9 |
表 1:MNIST 数字分类。
Robustness to Sampling Density Variation.
Sensor data directly captured from real world usually suffers from severe irregular sampling issues (Fig. 1). Our approach selects point neighborhood of multiple scales and learns to balance the descriptiveness and robustness by properly weighting them.
对采样密度变化的稳健性。
直接来自真实世界的传感器数据通常存在严重的不规则采样问题(图 1)。我们的方法选择多尺度点邻域,并通过恰当加权在描述力与稳健性之间取得平衡。
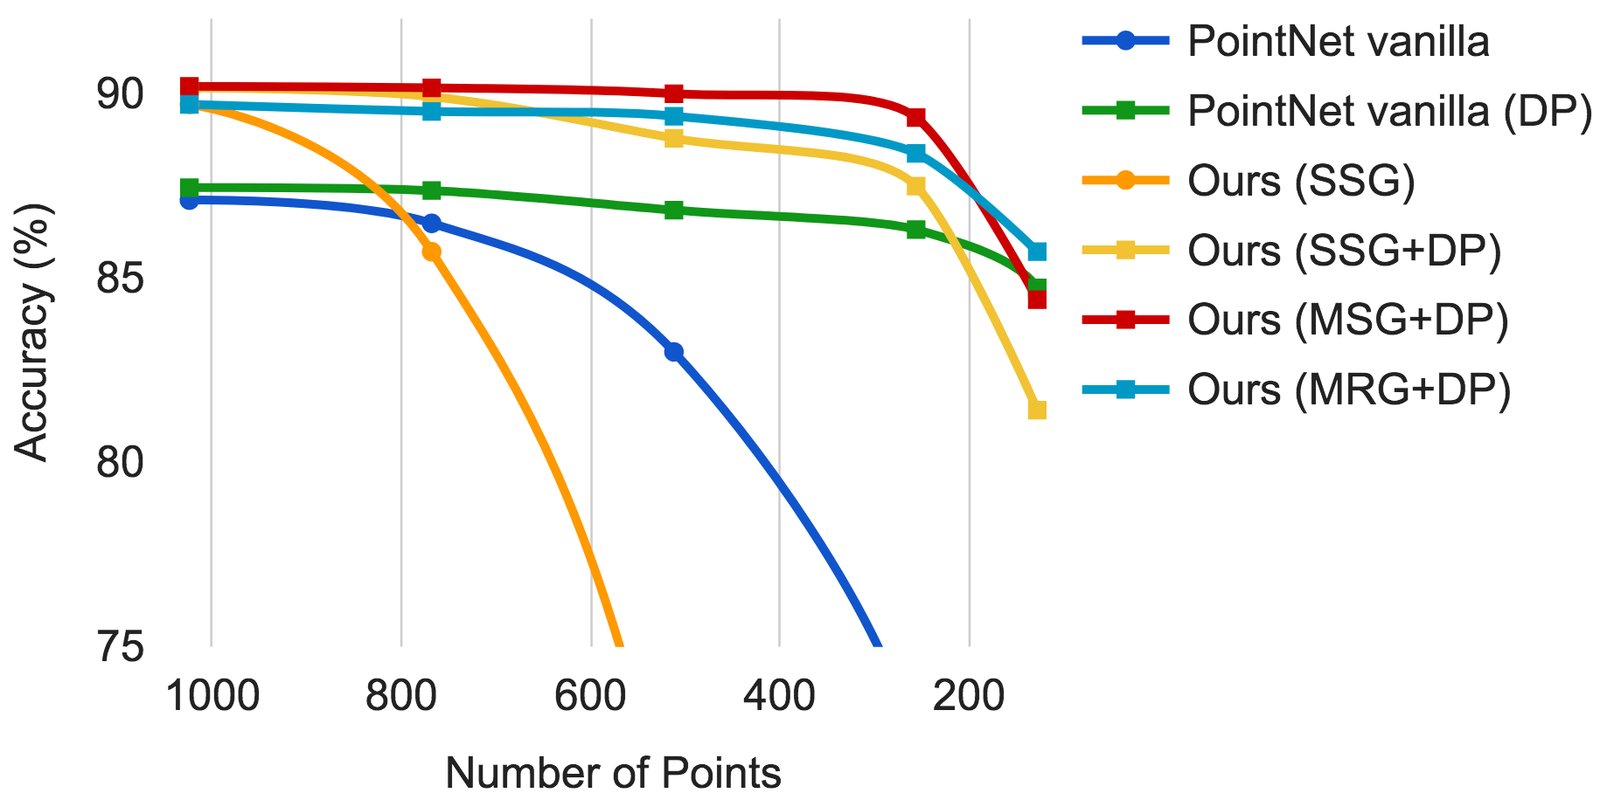
Figure 4: Left: Point cloud with random point dropout. Right: Curve showing advantage of our density adaptive strategy in dealing with non-uniform density. DP means random input dropout during training; otherwise training is on uniformly dense points. See Sec.3.3 for details.
图 4:左:随机丢点后的点云。右:曲线显示密度自适应策略在处理非均匀密度时的优势。DP 表示训练时随机输入丢弃;否则在均匀稠密点上训练。细节见第 3.3 节。
We randomly drop points (see Fig. 4 left) during test time to validate our network’s robustness to non-uniform and sparse data. In Fig. 4 right, we see MSG+DP (multi-scale grouping with random input dropout during training) and MRG+DP (multi-resolution grouping with random input dropout during training) are very robust to sampling density variation. MSG+DP performance drops by less than from to test points. Moreover, it achieves the best performance on almost all sampling densities compared with alternatives. PointNet vanilla [20] is fairly robust under density variation due to its focus on global abstraction rather than fine details. However loss of details also makes it less powerful compared to our approach. SSG (ablated PointNet++ with single scale grouping in each level) fails to generalize to sparse sampling density while SSG+DP amends the problem by randomly dropping out points in training time.
我们在测试时随机丢点(见图 4 左),以验证网络对非均匀与稀疏数据的稳健性。图 4 右显示:MSG+DP(训练时带随机输入丢弃的多尺度分组)与 MRG+DP(训练时带随机输入丢弃的多分辨率分组)对采样密度变化非常稳健。MSG+DP 从 1024 测点降到 256 测点时性能下降不到 ,且在几乎所有采样密度上相对其他方案表现最佳。PointNet vanilla [20] 因侧重全局抽象而非细细节,对密度变化也较稳健,但细节损失也使其相对我们的方法更弱。SSG(每层仅单尺度分组的消融版 PointNet++)难以泛化到稀疏采样;SSG+DP 则通过训练时随机丢点缓解了这一问题。
4.2 Point Set Segmentation for Semantic Scene Labeling
4.2 面向语义场景标注的点集分割
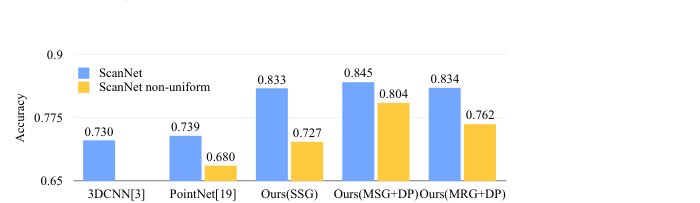
Figure 5: Scannet labeling accuracy.
图 5:ScanNet 标注准确率。
To validate that our approach is suitable for large scale point cloud analysis, we also evaluate on semantic scene labeling task. The goal is to predict semantic object label for points in indoor scans. [5] provides a baseline using fully convolutional neural network on voxelized scans. They purely rely on scanning geometry instead of RGB information and report the accuracy on a per-voxel basis. To make a fair comparison, we remove RGB information in all our experiments and convert point cloud label prediction into voxel labeling following [5]. We also compare with [20]. The accuracy is reported on a per-voxel basis in Fig. 5 (blue bar).
为验证方法适用于大规模点云分析,我们还在语义场景标注任务上评测:目标是预测室内扫描中各点的语义物体标签。[5] 提供了在体素化扫描上使用全卷积网络的基线,仅依赖扫描几何、不使用 RGB,并按体素报告准确率。为公平比较,我们所有实验均去掉 RGB,并按 [5] 把点云标签预测转成体素标注。我们也与 [20] 比较。准确率按体素报告于图 5(蓝色柱)。
Our approach outperforms all the baseline methods by a large margin. In comparison with [5], which learns on voxelized scans, we directly learn on point clouds to avoid additional quantization error, and conduct data dependent sampling to allow more effective learning. Compared with [20], our approach introduces hierarchical feature learning and captures geometry features at different scales. This is very important for understanding scenes at multiple levels and labeling objects with various sizes. We visualize example scene labeling results in Fig. 6.
我们的方法大幅超过所有基线。相对在体素化扫描上学习的 [5],我们直接在点云上学习以避免额外量化误差,并做数据依赖采样以实现更有效的学习。相对 [20],我们引入层次特征学习,在不同尺度捕获几何特征,这对在多层理解场景、标注不同尺寸物体非常重要。图 6 可视化了示例场景标注结果。
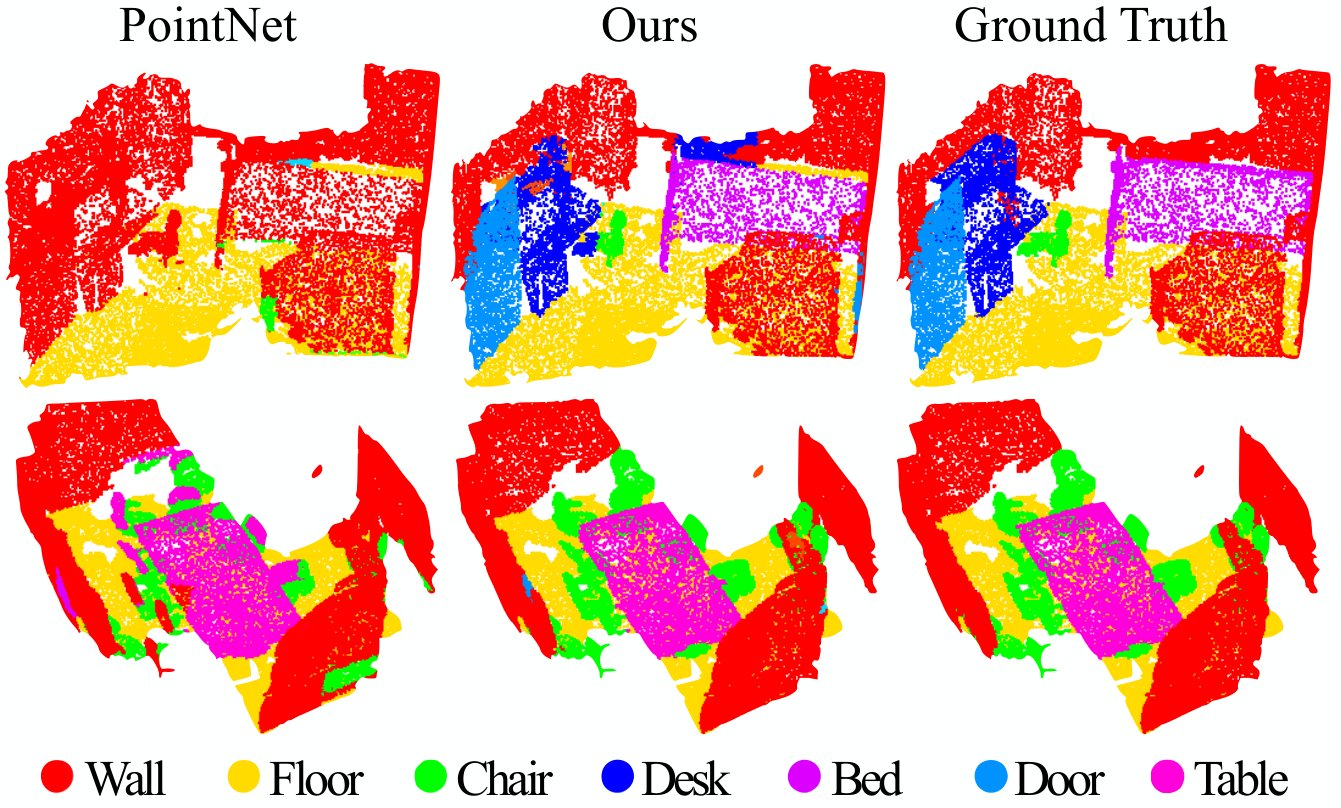
Figure 6: Scannet labeling results. [20] captures the overall layout of the room correctly but fails to discover the furniture. Our approach, in contrast, is much better at segmenting objects besides the room layout.
图 6:ScanNet 标注结果。[20] 能正确抓住房间整体布局,但难以发现家具;我们的方法在分割家具等物体方面明显更好,同时仍能把握布局。
Robustness to Sampling Density Variation
To test how our trained model performs on scans with non-uniform sampling density, we synthesize virtual scans of Scannet scenes similar to that in Fig. 1 and evaluate our network on this data. We refer readers to supplementary material for how we generate the virtual scans. We evaluate our framework in three settings (SSG, MSG+DP, MRG+DP) and compare with a baseline approach [20].
对采样密度变化的稳健性
为检验训练模型在非均匀采样密度扫描上的表现,我们合成与图 1 类似的 ScanNet 场景虚拟扫描,并在该数据上评测。虚拟扫描生成方式见补充材料。我们在三种设定(SSG、MSG+DP、MRG+DP)下评测,并与基线 [20] 比较。
Performance comparison is shown in Fig. 5 (yellow bar). We see that SSG performance greatly falls due to the sampling density shift from uniform point cloud to virtually scanned scenes. MRG network, on the other hand, is more robust to the sampling density shift since it is able to automatically switch to features depicting coarser granularity when the sampling is sparse. Even though there is a domain gap between training data (uniform points with random dropout) and scanned data with non-uniform density, our MSG network is only slightly affected and achieves the best accuracy among methods in comparison. These prove the effectiveness of our density adaptive layer design.
性能对比见图 5(黄色柱)。可见 SSG 因采样密度从均匀点云转到虚拟扫描场景而大幅下降;MRG 网络对采样密度偏移更稳健,因其能在采样稀疏时自动切向刻画更粗粒度的特征。即便训练数据(带随机丢弃的均匀点)与非均匀密度扫描数据存在域差距,MSG 网络也仅受轻微影响,并在对比方法中取得最高准确率。这些结果证明了密度自适应层设计的有效性。
4.3 Point Set Classification in Non-Euclidean Metric Space
4.3 非欧度量空间中的点集分类
In this section, we show generalizability of our approach to non-Euclidean space. In non-rigid shape classification (Fig. 7), a good classifier should be able to classify and in Fig. 7 correctly as the same category even given their difference in pose, which requires knowledge of intrinsic structure. Shapes in SHREC15 are 2D surfaces embedded in 3D space. Geodesic distances along the surfaces naturally induce a metric space. We show through experiments that adopting PointNet++ in this metric space is an effective way to capture intrinsic structure of the underlying point set.
本节展示方法向非欧空间的可推广性。在非刚性形状分类中(图 7),好的分类器即使姿态不同也应把图 7 中的 (a) 与 (c) 判为同类,这需要内蕴结构知识。SHREC15 中的形状是嵌入三维空间的二维曲面,沿曲面的测地距离自然诱导度量空间。实验表明,在该度量空间中采用 PointNet++ 是捕获底层点集内蕴结构的有效途径。
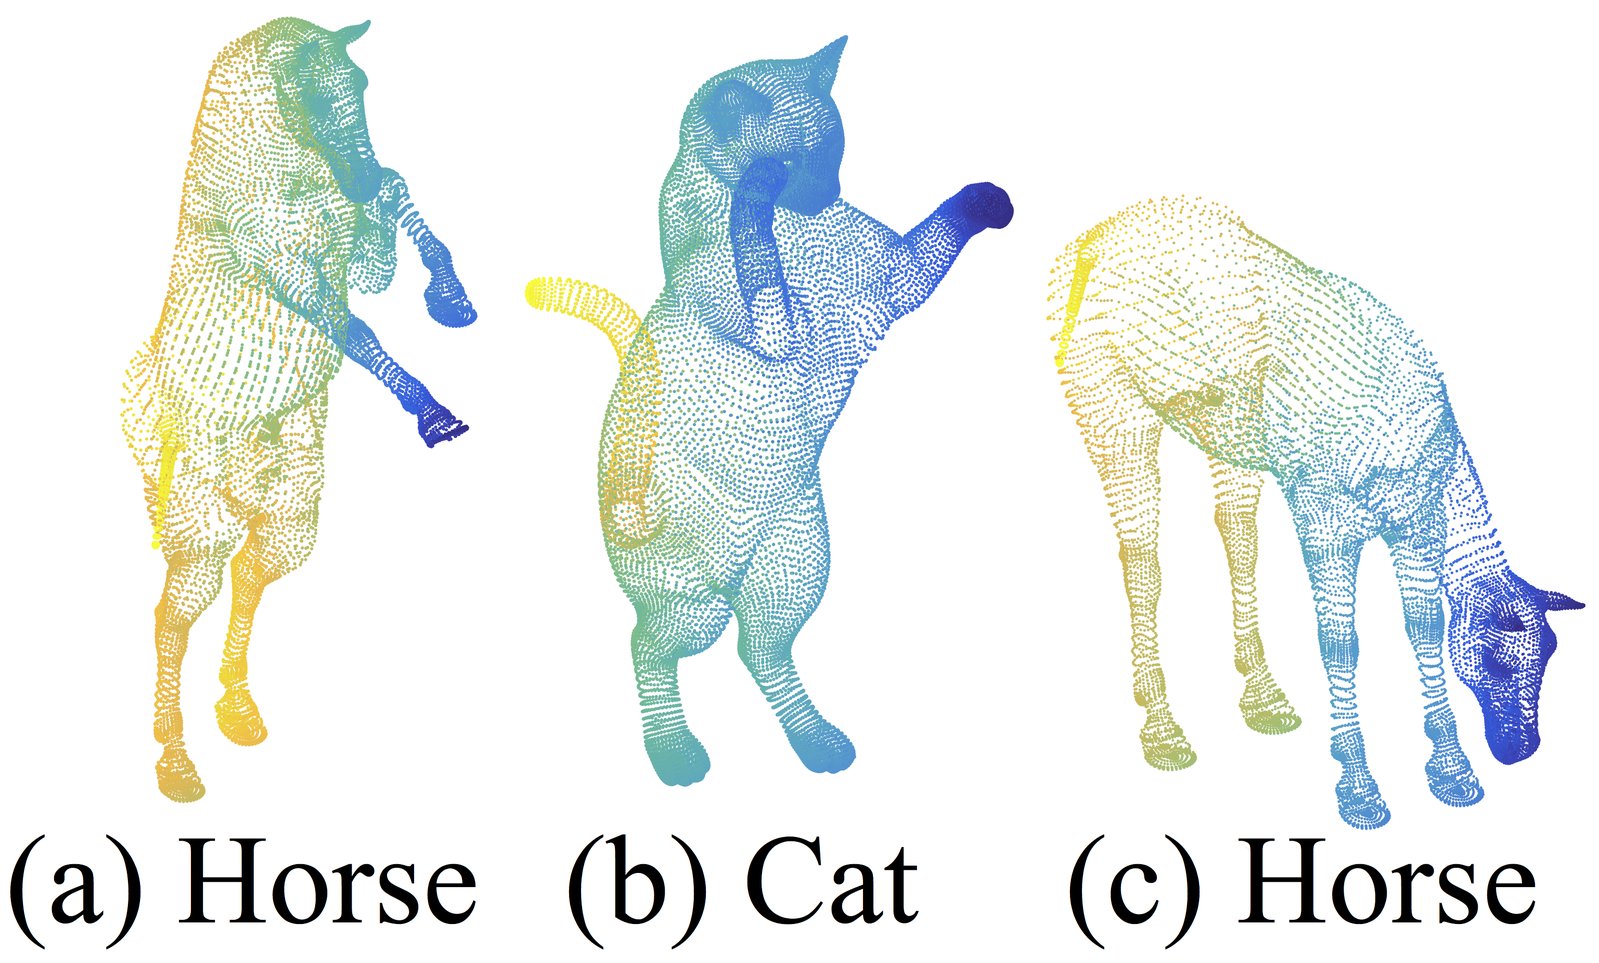
Figure 7: An example of non-rigid shape classification.
图 7:非刚性形状分类示例。
For each shape in [12], we firstly construct the metric space induced by pairwise geodesic distances. We follow [23] to obtain an embedding metric that mimics geodesic distance. Next we extract intrinsic point features in this metric space including WKS [1], HKS [27] and multi-scale Gaussian curvature [16]. We use these features as input and then sample and group points according to the underlying metric space. In this way, our network learns to capture multi-scale intrinsic structure that is not influenced by the specific pose of a shape. Alternative design choices include using coordinates as points feature or use Euclidean space as the underlying metric space. We show below these are not optimal choices.
对 [12] 中每个形状,我们先构造由成对测地距离诱导的度量空间,并按 [23] 得到模仿测地距离的嵌入度量。接着在该度量空间中提取内蕴点特征,包括 WKS [1]、HKS [27] 与多尺度高斯曲率 [16]。以这些特征为输入,再按底层度量空间采样与分组点。由此网络学会捕获不受具体姿态影响的多尺度内蕴结构。备选设计包括用 坐标作点特征,或以欧氏空间 为底层度量空间;下文表明这些并非最优选择。
Results.
We compare our methods with previous state-of-the-art method [14] in Table 3. [14] extracts geodesic moments as shape features and use a stacked sparse autoencoder to digest these features to predict shape category. Our approach using non-Euclidean metric space and intrinsic features achieves the best performance in all settings and outperforms [14] by a large margin.
结果。
我们在表 3 中与先前最优方法 [14] 比较。[14] 提取测地矩作为形状特征,再用堆叠稀疏自编码器消化这些特征以预测类别。我们的方法在非欧度量空间与内蕴特征设定下,在所有设定中表现最佳,并大幅超过 [14]。
Comparing the first and second setting of our approach, we see intrinsic features are very important for non-rigid shape classification. feature fails to reveal intrinsic structures and is greatly influenced by pose variation. Comparing the second and third setting of our approach, we see using geodesic neighborhood is beneficial compared with Euclidean neighborhood. Euclidean neighborhood might include points far away on surfaces and this neighborhood could change dramatically when shape affords non-rigid deformation. This introduces difficulty for effective weight sharing since the local structure could become combinatorially complicated. Geodesic neighborhood on surfaces, on the other hand, gets rid of this issue and improves the learning effectiveness.
比较我们方法的第一与第二设定可见,内蕴特征对非刚性形状分类非常重要: 特征难以揭示内蕴结构,且受姿态变化影响很大。比较第二与第三设定可见,相对欧氏邻域,测地邻域更有益。欧氏邻域可能包含曲面上相距很远的点,且在形状发生非刚性形变时邻域会剧烈变化,这使局部结构组合上极为复杂,不利于有效权重共享;曲面上的测地邻域则消除了这一问题,提升了学习效果。
| Metric space | Input feature | Accuracy (%) | |
|---|---|---|---|
| DeepGM [14] | - | Intrinsic features | 93.03 |
| Ours | Euclidean | XYZ | 60.18 |
| Euclidean | Intrinsic features | 94.49 | |
| Non-Euclidean | Intrinsic features | 96.09 |
Table 3: SHREC15 Non-rigid shape classification.
| 度量空间 | 输入特征 | 准确率 (%) | |
|---|---|---|---|
| DeepGM [14] | - | Intrinsic features | 93.03 |
| Ours | Euclidean | XYZ | 60.18 |
| Euclidean | Intrinsic features | 94.49 | |
| Non-Euclidean | Intrinsic features | 96.09 |
表 3:SHREC15 非刚性形状分类。
4.4 Feature Visualization.
4.4 特征可视化。
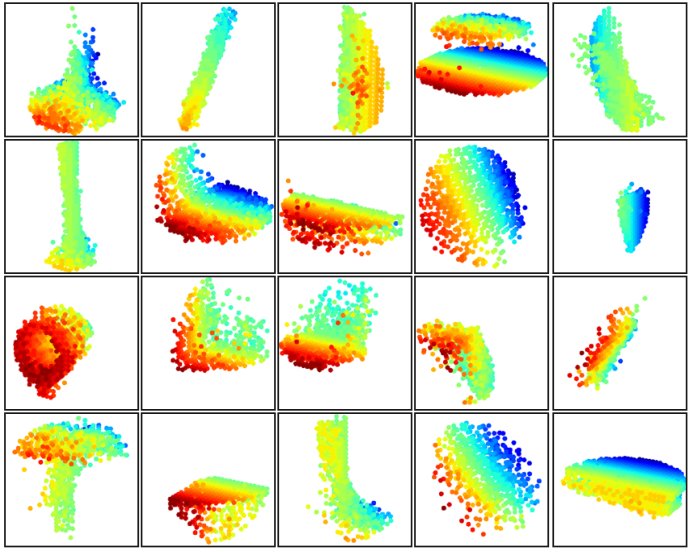
Figure 8: 3D point cloud patterns learned from the first layer kernels. The model is trained for ModelNet40 shape classification (20 out of the 128 kernels are randomly selected). Color indicates point depth (red is near, blue is far).
图 8:第一层卷积核学到的三维点云模式。模型在 ModelNet40 形状分类上训练(从 128 个核中随机选出 20 个)。颜色表示点深度(红近、蓝远)。
In Fig. 8 we visualize what has been learned by the first level kernels of our hierarchical network. We created a voxel grid in space and aggregate local point sets that activate certain neurons the most in grid cells (highest 100 examples are used). Grid cells with high votes are kept and converted back to 3D point clouds, which represents the pattern that neuron recognizes. Since the model is trained on ModelNet40 which is mostly consisted of furniture, we see structures of planes, double planes, lines, corners etc. in the visualization.
图 8 可视化层次网络第一层核学到了什么。我们在空间中建立体素网格,把最能激活某些神经元的局部点集聚合到网格单元中(取最高的 100 个例子)。得票高的网格单元保留并转回三维点云,代表该神经元识别的模式。由于模型在以家具为主的 ModelNet40 上训练,可视化中可见平面、双平面、直线、角落等结构。
5 Related Work
5 相关工作
The idea of hierarchical feature learning has been very successful. Among all the learning models, convolutional neural network [10, 25, 8] is one of the most prominent ones. However, convolution does not apply to unordered point sets with distance metrics, which is the focus of our work.
层次特征学习的思想非常成功。在各类学习模型中,卷积神经网络 [10, 25, 8] 尤为突出。然而卷积并不适用于带距离度量的无序点集,而这正是本文的焦点。
A few very recent works [20, 28] have studied how to apply deep learning to unordered sets. They ignore the underlying distance metric even if the point set does possess one. As a result, they are unable to capture local context of points and are sensitive to global set translation and normalization. In this work, we target at points sampled from a metric space and tackle these issues by explicitly considering the underlying distance metric in our design.
最近若干工作 [20, 28] 研究了如何把深度学习用于无序集合。即便点集本身具备底层距离度量,它们也忽略了该度量,因而无法捕获点的局部上下文,并对全局集合平移与归一化敏感。本文面向度量空间中采样的点,在设计中显式考虑底层距离度量,以应对这些问题。
Point sampled from a metric space are usually noisy and with non-uniform sampling density. This affects effective point feature extraction and causes difficulty for learning. One of the key issue is to select proper scale for point feature design. Previously several approaches have been developed regarding this [19, 17, 2, 6, 7, 30] either in geometry processing community or photogrammetry and remote sensing community. In contrast to all these works, our approach learns to extract point features and balance multiple feature scales in an end-to-end fashion.
度量空间中采样的点通常带噪声且采样密度不均,影响有效点特征提取并增加学习难度。关键问题之一是为点特征设计选择合适尺度。几何处理、摄影测量与遥感等领域此前已有若干方法 [19, 17, 2, 6, 7, 30]。与之不同,我们的方法以端到端方式学习提取点特征并平衡多个特征尺度。
In 3D metric space, other than point set, there are several popular representations for deep learning, including volumetric grids [21, 22, 29], and geometric graphs [3, 15, 33]. However, in none of these works, the problem of non-uniform sampling density has been explicitly considered.
在三维度量空间中,除点集外,深度学习还有体素网格 [21, 22, 29] 与几何图 [3, 15, 33] 等流行表示。但这些工作都未显式考虑非均匀采样密度问题。
6 Conclusion
6 结论
In this work, we propose PointNet++, a powerful neural network architecture for processing point sets sampled in a metric space. PointNet++ recursively functions on a nested partitioning of the input point set, and is effective in learning hierarchical features with respect to the distance metric. To handle the non uniform point sampling issue, we propose two novel set abstraction layers that intelligently aggregate multi-scale information according to local point densities. These contributions enable us to achieve state-of-the-art performance on challenging benchmarks of 3D point clouds.
本文提出 PointNet++:一种面向度量空间中采样点集的强力神经网络架构。PointNet++ 在输入点集的嵌套划分上递归运行,能有效学习相对于距离度量的层次特征。为处理非均匀点采样,我们提出两种新型集合抽象层,按局部点密度智能聚合多尺度信息。这些贡献使我们在具有挑战性的三维点云基准上达到当时最优表现。
In the future, it’s worthwhile thinking how to accelerate inference speed of our proposed network especially for MSG and MRG layers by sharing more computation in each local regions. It’s also interesting to find applications in higher dimensional metric spaces where CNN based method would be computationally unfeasible while our method can scale well.
未来值得思考如何加速所提网络的推理速度,尤其是通过在各局部区域共享更多计算来加速 MSG 与 MRG 层。在更高维度量空间中寻找应用也很有意思:那里基于 CNN 的方法在计算上往往不可行,而我们的方法可以良好扩展。
References
参考文献
[1] M. Aubry, U. Schlickewei, and D. Cremers. The wave kernel signature: A quantum mechanical approach to shape analysis. In Computer Vision Workshops (ICCV Workshops), 2011 IEEE International Conference on , pages 1626–1633. IEEE, 2011.
[2] D. Belton and D. D. Lichti. Classification and segmentation of terrestrial laser scanner point clouds using local variance information. Iaprs, Xxxvi , 5:44–49, 2006.
[3] J. Bruna, W. Zaremba, A. Szlam, and Y. LeCun. Spectral networks and locally connected networks on graphs. arXiv preprint arXiv:1312.6203 , 2013.
[4] A. X. Chang, T. Funkhouser, L. Guibas, P. Hanrahan, Q. Huang, Z. Li, S. Savarese, M. Savva, S. Song, H. Su, J. Xiao, L. Yi, and F. Yu. ShapeNet: An Information-Rich 3D Model Repository. Technical Report arXiv:1512.03012 [cs.GR], 2015.
[5] A. Dai, A. X. Chang, M. Savva, M. Halber, T. Funkhouser, and M. Nießner. Scannet: Richly-annotated 3d reconstructions of indoor scenes. arXiv preprint arXiv:1702.04405 , 2017.
[6] J. Demantké, C. Mallet, N. David, and B. Vallet. Dimensionality based scale selection in 3d lidar point clouds. The International Archives of the Photogrammetry, Remote Sensing and Spatial Information Sciences , 38(Part 5):W12, 2011.
[7] A. Gressin, C. Mallet, J. Demantké, and N. David. Towards 3d lidar point cloud registration improvement using optimal neighborhood knowledge. ISPRS journal of photogrammetry and remote sensing , 79:240–251, 2013.
[8] K. He, X. Zhang, S. Ren, and J. Sun. Deep residual learning for image recognition. In Proceedings of the IEEE Conference on Computer Vision and Pattern Recognition , pages 770–778, 2016.
[9] D. Kingma and J. Ba. Adam: A method for stochastic optimization. arXiv preprint arXiv:1412.6980 .
[10] A. Krizhevsky, I. Sutskever, and G. E. Hinton. Imagenet classification with deep convolutional neural networks. In Advances in neural information processing systems , pages 1097–1105, 2012.
[11] Y. LeCun, L. Bottou, Y. Bengio, and P. Haffner. Gradient-based learning applied to document recognition. Proceedings of the IEEE , 86(11):2278–2324, 1998.
[12] Z. Lian, J. Zhang, S. Choi, H. ElNaghy, J. El-Sana, T. Furuya, A. Giachetti, R. A. Guler, L. Lai, C. Li, H. Li, F. A. Limberger, R. Martin, R. U. Nakanishi, A. P. Neto, L. G. Nonato, R. Ohbuchi, K. Pevzner, D. Pickup, P. Rosin, A. Sharf, L. Sun, X. Sun, S. Tari, G. Unal, and R. C. Wilson. Non-rigid 3D Shape Retrieval. In I. Pratikakis, M. Spagnuolo, T. Theoharis, L. V. Gool, and R. Veltkamp, editors, Eurographics Workshop on 3D Object Retrieval . The Eurographics Association, 2015.
[13] M. Lin, Q. Chen, and S. Yan. Network in network. arXiv preprint arXiv:1312.4400 , 2013.
[14] L. Luciano and A. B. Hamza. Deep learning with geodesic moments for 3d shape classification. Pattern Recognition Letters , 2017.
[15] J. Masci, D. Boscaini, M. Bronstein, and P. Vandergheynst. Geodesic convolutional neural networks on riemannian manifolds. In Proceedings of the IEEE International Conference on Computer Vision Workshops , pages 37–45, 2015.
[16] M. Meyer, M. Desbrun, P. Schröder, A. H. Barr, et al. Discrete differential-geometry operators for triangulated 2-manifolds. Visualization and mathematics , 3(2):52–58, 2002.
[17] N. J. MITRA, A. NGUYEN, and L. GUIBAS. Estimating surface normals in noisy point cloud data. International Journal of Computational Geometry & Applications , 14(04n05):261–276, 2004.
[18] I. Occipital. Structure sensor-3d scanning, augmented reality, and more for mobile devices, 2016.
[19] M. Pauly, L. P. Kobbelt, and M. Gross. Point-based multiscale surface representation. ACM Transactions on Graphics (TOG) , 25(2):177–193, 2006.
[20] C. R. Qi, H. Su, K. Mo, and L. J. Guibas. Pointnet: Deep learning on point sets for 3d classification and segmentation. arXiv preprint arXiv:1612.00593 , 2016.
[21] C. R. Qi, H. Su, M. Nießner, A. Dai, M. Yan, and L. Guibas. Volumetric and multi-view cnns for object classification on 3d data. In Proc. Computer Vision and Pattern Recognition (CVPR), IEEE , 2016.
[22] G. Riegler, A. O. Ulusoys, and A. Geiger. Octnet: Learning deep 3d representations at high resolutions. arXiv preprint arXiv:1611.05009 , 2016.
[23] R. M. Rustamov, Y. Lipman, and T. Funkhouser. Interior distance using barycentric coordinates. In Computer Graphics Forum , volume 28, pages 1279–1288. Wiley Online Library, 2009.
[24] P. Y. Simard, D. Steinkraus, and J. C. Platt. Best practices for convolutional neural networks applied to visual document analysis. In ICDAR , volume 3, pages 958–962, 2003.
[25] K. Simonyan and A. Zisserman. Very deep convolutional networks for large-scale image recognition. arXiv preprint arXiv:1409.1556 , 2014.
[26] H. Su, S. Maji, E. Kalogerakis, and E. G. Learned-Miller. Multi-view convolutional neural networks for 3d shape recognition. In Proc. ICCV, to appear , 2015.
[27] J. Sun, M. Ovsjanikov, and L. Guibas. A concise and provably informative multi-scale signature based on heat diffusion. In Computer graphics forum , volume 28, pages 1383–1392. Wiley Online Library, 2009.
[28] O. Vinyals, S. Bengio, and M. Kudlur. Order matters: Sequence to sequence for sets. arXiv preprint arXiv:1511.06391 , 2015.
[29] P.-S. WANG, Y. LIU, Y.-X. GUO, C.-Y. SUN, and X. TONG. O-cnn: Octree-based convolutional neural networks for 3d shape analysis. 2017.
[30] M. Weinmann, B. Jutzi, S. Hinz, and C. Mallet. Semantic point cloud interpretation based on optimal neighborhoods, relevant features and efficient classifiers. ISPRS Journal of Photogrammetry and Remote Sensing , 105:286–304, 2015.
[31] Z. Wu, S. Song, A. Khosla, F. Yu, L. Zhang, X. Tang, and J. Xiao. 3d shapenets: A deep representation for volumetric shapes. In Proceedings of the IEEE Conference on Computer Vision and Pattern Recognition , pages 1912–1920, 2015.
[32] L. Yi, V. G. Kim, D. Ceylan, I.-C. Shen, M. Yan, H. Su, C. Lu, Q. Huang, A. Sheffer, and L. Guibas. A scalable active framework for region annotation in 3d shape collections. SIGGRAPH Asia , 2016.
[33] L. Yi, H. Su, X. Guo, and L. Guibas. Syncspeccnn: Synchronized spectral cnn for 3d shape segmentation. arXiv preprint arXiv:1612.00606 , 2016.
Supplementary
补充材料
Appendix A Overview
附录 A 概述
This supplementary material provides more details on experiments in the main paper and includes more experiments to validate and analyze our proposed method.
本补充材料提供正文实验的更多细节,并包含更多实验以验证与分析所提方法。
In Sec B we provide specific network architectures used for experiments in the main paper and also describe details in data preparation and training. In Sec C we show more experimental results including benchmark performance on part segmentation and analysis on neighborhood query, sensitivity to sampling randomness and time space complexity.
第 B 节给出正文实验所用的具体网络架构,以及数据准备与训练细节。第 C 节展示更多实验结果,包括部件分割基准表现,以及对邻域查询、采样随机性敏感度与时空复杂度的分析。
Appendix B Details in Experiments
附录 B 实验细节
Architecture protocol.
We use following notations to describe our network architecture.
架构记号。
我们用以下记号描述网络架构。
SA(,,[]) is a set abstraction (SA) level with local regions of ball radius using PointNet of fully connected layers with width (). SA([]) is a global set abstraction level that converts set to a single vector. In multi-scale setting (as in MSG), we use SA(, [], [[],…,[]]) to represent MSG with scales.
SA(,,[]) 表示集合抽象(SA)层:有 个半径为 的局部区域,使用宽度为 ()的 个全连接层构成的 PointNet。SA([]) 是把集合转为单个向量的全局集合抽象层。在多尺度设定(如 MSG)中,用 SA(, [], [[],…,[]]) 表示 个尺度的 MSG。
FC(,) represents a fully connected layer with width and dropout ratio . FP() is a feature propagation (FP) level with fully connected layers. It is used for updating features concatenated from interpolation and skip link. All fully connected layers are followed by batch normalization and ReLU except for the last score prediction layer.
FC(,) 表示宽度为 、丢弃比例为 的全连接层。FP() 是带 个全连接层的特征传播(FP)层,用于更新由插值与跳跃连接拼接而来的特征。除最后的分数预测层外,所有全连接层后接批归一化与 ReLU。
B.1 Network Architectures
B.1 网络架构
For all classification experiments we use the following architecture (Ours SSG) with different (number of categories):
所有分类实验使用下列架构(Ours SSG),(类别数)可不同:
$$\begin{split}&SA(512,0.2,[64,64,128])\rightarrow SA(128,0.4,[128,128,256])\rightarrow SA([256,512,1024])\rightarrow\
&FC(512,0.5)\rightarrow FC(256,0.5)\rightarrow FC(K)\end{split}$$
The multi-scale grouping (MSG) network (PointNet++) architecture is as follows:
多尺度分组(MSG)网络(PointNet++)架构如下:
$$\begin{split}&SA(512,[0.1,0.2,0.4],[[32,32,64],[64,64,128],[64,96,128]])\rightarrow\
&SA(128,[0.2,0.4,0.8],[[64,64,128],[128,128,256],[128,128,256]])\rightarrow\
&SA([256,512,1024])\rightarrow FC(512,0.5)\rightarrow FC(256,0.5)\rightarrow FC(K)\end{split}$$
The cross level multi-resolution grouping (MRG) network’s architecture uses three branches:
跨层多分辨率分组(MRG)网络架构使用三个分支:
Branch 1:
分支 1:
Branch 2: using regions of original points
分支 2:,使用原始点上半径 的区域
Branch 3: using all original points.
分支 3:,使用全部原始点。
Branch 4: .
分支 4:。
Branch 1 and branch 2 are concatenated and fed to branch 4. Output of branch 3 and branch4 are then concatenated and fed to for classification.
分支 1 与分支 2 拼接后送入分支 4。分支 3 与分支 4 的输出再拼接,送入 做分类。
Network for semantic scene labeling (last two fully connected layers in FP are followed by dropout layers with drop ratio 0.5):
语义场景标注网络(FP 中最后两个全连接层后接丢弃比例 0.5 的 dropout):
$$\begin{split}&SA(1024,0.1,[32,32,64])\rightarrow SA(256,0.2,[64,64,128])\rightarrow\
&SA(64,0.4,[128,128,256])\rightarrow SA(16,0.8,[256,256,512])\rightarrow\
&FP(256,256)\rightarrow FP(256,256)\rightarrow FP(256,128)\rightarrow FP(128,128,128,128,K)\end{split}$$
Network for semantic and part segmentation (last two fully connected layers in FP are followed by dropout layers with drop ratio 0.5):
语义与部件分割网络(FP 中最后两个全连接层后接丢弃比例 0.5 的 dropout):
$$\begin{split}&SA(512,0.2,[64,64,128])\rightarrow SA(128,0.4,[128,128,256])\rightarrow SA([256,512,1024])\rightarrow\
&FP(256,256)\rightarrow FP(256,128)\rightarrow FP(128,128,128,128,K)\end{split}$$
B.2 Virtual Scan Generation
B.2 虚拟扫描生成
In this section, we describe how we generate labeled virtual scan with non-uniform sampling density from ScanNet scenes. For each scene in ScanNet, we set camera location above the centroid of the floor plane and rotate the camera orientation in the horizontal plane evenly in directions. In each direction, we use a image plane with size by and cast rays from camera through each pixel to the scene. This gives a way to select visible points in the scene. We could then generate virtual scans for each test scene similar and an example is shown in Fig. 9. Notice point samples are denser in regions closer to the camera.
本节说明如何从 ScanNet 场景生成带非均匀采样密度的有标签虚拟扫描。对 ScanNet 每个场景,将相机置于地板平面质心上方 ,并在水平面内均匀旋转 8 个方向。每个方向使用 像素的图像平面,从相机经每个像素向场景投射光线,以此选出场景中的可见点。由此可为每个测试场景生成 8 个虚拟扫描,示例如图 9。注意靠近相机的区域点采样更密。

Figure 9: Virtual scan generated from ScanNet
图 9:由 ScanNet 生成的虚拟扫描
B.3 MNIST and ModelNet40 Experiment Details
B.3 MNIST 与 ModelNet40 实验细节
For MNIST images, we firstly normalize all pixel intensities to range and then select all pixels with intensities larger than 0.5 as valid digit pixels. Then we convert digit pixels in an image into a 2D point cloud with coordinates within , where the image center is the origin point. Augmented points are created to add the point set up to a fixed cardinality (512 in our case). We jitter the initial point cloud (with random translation of Gaussian distribution and clipped to 0.03) to generate the augmented points. For ModelNet40, we uniformly sample points from CAD models surfaces based on face area.
对 MNIST 图像,先把所有像素强度归一化到 ,再选取强度大于 0.5 的像素作为有效数字像素;随后把图像中的数字像素转为坐标落在 内的二维点云,图像中心为原点。再通过增强点把点集补到固定基数(本文为 512):对初始点云加抖动(高斯平移 ,截断到 0.03)生成增强点。对 ModelNet40,按面面积在 CAD 模型表面均匀采样 个点。
For all experiments, we use Adam [9] optimizer with learning rate 0.001 for training. For data augmentation, we randomly scale object, perturb the object location as well as point sample locations. We also follow [21] to randomly rotate objects for ModelNet40 data augmentation. We use TensorFlow and GTX 1080, Titan X for training. All layers are implemented in CUDA to run GPU. It takes around 20 hours to train our model to convergence.
所有实验用 Adam [9] 优化器、学习率 0.001 训练。数据增强包括随机缩放物体、扰动物体位置与点采样位置;ModelNet40 还按 [21] 随机旋转物体。用 TensorFlow,在 GTX 1080、Titan X 上训练;各层以 CUDA 实现以在 GPU 运行。训练至收敛约需 20 小时。
B.4 ScanNet Experiment Details
B.4 ScanNet 实验细节
To generate training data from ScanNet scenes, we sample 1.5m by 1.5m by 3m cubes from the initial scene and then keep the cubes where of the voxels are occupied and of the surface voxels have valid annotations (this is the same set up in [5]). We sample such training cubes on the fly and random rotate it along the up-right axis. Augmented points are added to the point set to make a fixed cardinality (8192 in our case). During test time, we similarly split the test scene into smaller cubes and get label prediction for every point in the cubes first, then merge label prediction in all the cubes from a same scene. If a point get different labels from different cubes, we will just conduct a majority voting to get the final point label prediction.
从 ScanNet 场景生成训练数据时,从初始场景采样 立方体,并保留体素占用率 、且表面体素中有效标注比例 的立方体(与 [5] 设定相同)。训练立方体在线采样,并沿竖直轴随机旋转。向点集添加增强点以固定基数(本文为 8192)。测试时同样把测试场景切成较小立方体,先得到各立方体内每点的标签预测,再合并同一场景所有立方体的预测;若一点在不同立方体中得到不同标签,则多数表决得到最终点标签。
B.5 SHREC15 Experiment Details
B.5 SHREC15 实验细节
We randomly sample 1024 points on each shape both for training and testing. To generate the input intrinsic features, we to extract 100 dimensional WKS, HKS and multiscale Gaussian curvature respectively, leading to a 300 dimensional feature vector for each point. Then we conduct PCA to reduce the feature dimension to 64. We use a 8 dimensional embedding following [23] to mimic the geodesic distance, which is used to describe our non-Euclidean metric space while choosing the point neighborhood.
训练与测试时在每个形状上随机采样 1024 点。生成输入内蕴特征时,分别提取 100 维 WKS、HKS 与多尺度高斯曲率,得到每点 300 维特征,再经 PCA 降到 64 维。按 [23] 使用 8 维嵌入模仿测地距离,用以描述非欧度量空间并选择点邻域。
Appendix C More Experiments
附录 C 更多实验
In this section we provide more experiment results to validate and analyze our proposed network architecture.
本节提供更多实验结果,以验证与分析所提网络架构。
C.1 Semantic Part Segmentation
C.1 语义部件分割
Following the setting in [32], we evaluate our approach on part segmentation task assuming category label for each shape is already known. Taken shapes represented by point clouds as input, the task is to predict a part label for each point. The dataset contains 16,881 shapes from 16 classes, annotated with 50 parts in total. We use the official train test split following [4].
按 [32] 的设定,我们在已知每个形状类别标签的前提下评测部件分割:输入为点云表示的形状,任务是为每个点预测部件标签。数据集含 16 类共 16881 个形状,合计标注 50 个部件。采用 [4] 的官方训练/测试划分。
We equip each point with its normal direction to better depict the underlying shape. This way we could get rid of hand-crafted geometric features as is used in [32, 33]. We compare our framework with traditional learning based techniques [32], as well as state-of-the-art deep learning approaches [20, 33] in Table 4. Point intersection over union (IoU) is used as the evaluation metric, averaged across all part classes. Cross-entropy loss is minimized during training. On average, our approach achieves the best performance. In comparison with [20], our approach performs better on most of the categories, which proves the importance of hierarchical feature learning for detailed semantic understanding. Notice our approach could be viewed as implicitly building proximity graphs at different scales and operating on these graphs, thus is related to graph CNN approaches such as [33]. Thanks to the flexibility of our multi-scale neighborhood selection as well as the power of set operation units, we could achieve better performance compared with [33]. Notice our set operation unit is much simpler compared with graph convolution kernels, and we do not need to conduct expensive eigen decomposition as opposed to [33]. These make our approach more suitable for large scale point cloud analysis.
我们为每个点配备法向以更好刻画底层形状,从而无需 [32, 33] 所用的手工几何特征。在表 4 中与传统学习方法 [32] 以及当时最优深度学习方法 [20, 33] 比较。评价指标为点交并比(IoU),对所有部件类取平均;训练最小化交叉熵损失。平均而言我们的方法表现最佳。相对 [20],我们在多数类别上更好,证明层次特征学习对细致语义理解的重要性。注意我们的方法可视为在不同尺度隐式构建邻近图并在其上运算,因而与 [33] 等图 CNN 方法相关。得益于多尺度邻域选择的灵活性与集合运算单元的能力,我们相对 [33] 表现更好。注意我们的集合运算单元远比图卷积核简单,且无需像 [33] 那样做昂贵的特征分解,因而更适合大规模点云分析。
| mean | aero | bag | cap | car | chair | ear phone | guitar | knife | lamp | laptop | motor | mug | pistol | rocket | skate board | table | |
|---|---|---|---|---|---|---|---|---|---|---|---|---|---|---|---|---|---|
| Yi [32] | 81.4 | 81.0 | 78.4 | 77.7 | 75.7 | 87.6 | 61.9 | 92.0 | 85.4 | 82.5 | 95.7 | 70.6 | 91.9 | 85.9 | 53.1 | 69.8 | 75.3 |
| PN [20] | 83.7 | 83.4 | 78.7 | 82.5 | 74.9 | 89.6 | 73.0 | 91.5 | 85.9 | 80.8 | 95.3 | 65.2 | 93.0 | 81.2 | 57.9 | 72.8 | 80.6 |
| SSCNN [33] | 84.7 | 81.6 | 81.7 | 81.9 | 75.2 | 90.2 | 74.9 | 93.0 | 86.1 | 84.7 | 95.6 | 66.7 | 92.7 | 81.6 | 60.6 | 82.9 | 82.1 |
| Ours | 85.1 | 82.4 | 79.0 | 87.7 | 77.3 | 90.8 | 71.8 | 91.0 | 85.9 | 83.7 | 95.3 | 71.6 | 94.1 | 81.3 | 58.7 | 76.4 | 82.6 |
Table 4: Segmentation results on ShapeNet part dataset.
| mean | aero | bag | cap | car | chair | ear phone | guitar | knife | lamp | laptop | motor | mug | pistol | rocket | skate board | table | |
|---|---|---|---|---|---|---|---|---|---|---|---|---|---|---|---|---|---|
| Yi [32] | 81.4 | 81.0 | 78.4 | 77.7 | 75.7 | 87.6 | 61.9 | 92.0 | 85.4 | 82.5 | 95.7 | 70.6 | 91.9 | 85.9 | 53.1 | 69.8 | 75.3 |
| PN [20] | 83.7 | 83.4 | 78.7 | 82.5 | 74.9 | 89.6 | 73.0 | 91.5 | 85.9 | 80.8 | 95.3 | 65.2 | 93.0 | 81.2 | 57.9 | 72.8 | 80.6 |
| SSCNN [33] | 84.7 | 81.6 | 81.7 | 81.9 | 75.2 | 90.2 | 74.9 | 93.0 | 86.1 | 84.7 | 95.6 | 66.7 | 92.7 | 81.6 | 60.6 | 82.9 | 82.1 |
| Ours | 85.1 | 82.4 | 79.0 | 87.7 | 77.3 | 90.8 | 71.8 | 91.0 | 85.9 | 83.7 | 95.3 | 71.6 | 94.1 | 81.3 | 58.7 | 76.4 | 82.6 |
表 4:ShapeNet 部件数据集上的分割结果。
C.2 Neighborhood Query: kNN v.s. Ball Query.
C.2 邻域查询:kNN 与球查询。
Here we compare two options to select a local neighborhood. We used radius based ball query in our main paper. Here we also experiment with kNN based neighborhood search and also play with different search radius and . In this experiment all training and testing are on ModelNet40 shapes with uniform sampling density. 1024 points are used. As seen in Table 5, radius based ball query is slightly better than kNN based method. However, we speculate in very non-uniform point set, kNN based query will results in worse generalization ability. Also we observe that a slightly large radius is helpful for performance probably because it captures richer local patterns.
这里比较选择局部邻域的两种方案。正文使用基于半径的球查询;这里也实验基于 kNN 的邻域搜索,并尝试不同搜索半径与 。本实验训练与测试均在均匀采样密度的 ModelNet40 形状上,使用 1024 点。如表 5 所示,基于半径的球查询略优于基于 kNN 的方法。但我们推测在非常不均匀的点集上,基于 kNN 的查询泛化能力会更差。我们也观察到略大的半径有助于提升表现,可能因为它捕获更丰富的局部模式。
| kNN (k=16) | kNN (k=64) | radius (r=0.1) | radius (r=0.2) |
|---|---|---|---|
| 89.3 | 90.3 | 89.1 | 90.7 |
Table 5: Effects of neighborhood choices. Evaluation metric is classification accuracy (%) on ModelNet 40 test set.
| kNN (k=16) | kNN (k=64) | radius (r=0.1) | radius (r=0.2) |
|---|---|---|---|
| 89.3 | 90.3 | 89.1 | 90.7 |
表 5:邻域选择的影响。评价指标为 ModelNet40 测试集分类准确率(%)。
C.3 Effect of Randomness in Farthest Point Sampling.
C.3 最远点采样中随机性的影响。
For the Sampling layer in our set abstraction level, we use farthest point sampling (FPS) for point set sub sampling. However FPS algorithm is random and the subsampling depends on which point is selected first. Here we evaluate the sensitivity of our model to this randomness. In Table 6, we test our model trained on ModelNet40 for feature stability and classification stability.
集合抽象层的采样层用最远点采样(FPS)做点集下采样。但 FPS 算法是随机的,下采样结果取决于首先选中哪一点。这里评测模型对该随机性的敏感度。表 6 在 ModelNet40 上训练的模型上测试特征稳定性与分类稳定性。
To evaluate feature stability we extract global features of all test samples for 10 times with different random seed. Then we compute mean features for each shape across the 10 sampling. Then we compute standard deviation of the norms of feature’s difference from the mean feature. At last we average all std. in all feature dimensions as reported in the table. Since features are normalized into 0 to 1 before processing, the 0.021 difference means a 2.1% deviation of feature norm.
为评测特征稳定性,我们对所有测试样本在不同随机种子下提取 10 次全局特征,再对每个形状计算 10 次采样的均值特征,接着计算特征与均值特征之差的范数的标准差,最后对所有特征维的标准差取平均并报告于表中。由于处理前特征已归一化到 0–1,0.021 的差异意味着特征范数约有 2.1% 的偏离。
For classification, we observe only a 0.17% standard deviation in test accuracy on all ModelNet40 test shapes, which is robust to sampling randomness.
分类方面,我们观察到在全部 ModelNet40 测试形状上测试准确率的标准差仅为 0.17%,对采样随机性稳健。
| Feature difference std. | Accuracy std. |
|---|---|
| 0.021 | 0.0017 |
Table 6: Effects of randomness in FPS (using ModelNet40).
| 特征差异标准差 | 准确率标准差 |
|---|---|
| 0.021 | 0.0017 |
表 6:FPS 随机性的影响(使用 ModelNet40)。
C.4 Time and Space Complexity.
C.4 时间与空间复杂度。
Table 7 summarizes comparisons of time and space cost between a few point set based deep learning method. We record forward time with a batch size 8 using TensorFlow 1.1 with a single GTX 1080. The first batch is neglected since there is some preparation for GPU. While PointNet (vanilla) [20] has the best time efficiency, our model without density adaptive layers achieved smallest model size with fair speed.
表 7 汇总了若干基于点集的深度学习方法的时间与空间代价比较。我们在 TensorFlow 1.1、单块 GTX 1080、批大小 8 下记录前向时间;忽略第一批(GPU 有准备开销)。PointNet (vanilla) [20] 时间效率最佳;我们不含密度自适应层的模型在模型体积最小的同时速度尚可。
It’s worth noting that ours MSG, while it has good performance in non-uniformly sampled data, it’s 2x expensive than SSG version due the multi-scale region feature extraction. Compared with MSG, MRG is more efficient since it uses regions across layers.
值得注意的是:ours MSG 虽在非均匀采样数据上表现好,但因多尺度区域特征提取,代价约为 SSG 版本的两倍。相对 MSG,MRG 更高效,因为它使用跨层区域。
| PointNet (vanilla) 1 | PointNet 1 | Ours (SSG) | Ours (MSG) | Ours (MRG) | |
|---|---|---|---|---|---|
| Model size (MB) | 9.4 | 40 | 8.7 | 12 | 24 |
| Forward time (ms) | 11.6 | 25.3 | 82.4 | 163.2 | 87.0 |
Table 7: Model size and inference time (forward pass) of several networks.
| PointNet (vanilla) 1 | PointNet 1 | Ours (SSG) | Ours (MSG) | Ours (MRG) | |
|---|---|---|---|---|---|
| 模型大小 (MB) | 9.4 | 40 | 8.7 | 12 | 24 |
| 前向时间 (ms) | 11.6 | 25.3 | 82.4 | 163.2 | 87.0 |
表 7:若干网络的模型大小与推理时间(前向传播)。