Rethinking the Inception Architecture for Computer Vision
Rethinking the Inception Architecture for Computer Vision
重新思考计算机视觉中的 Inception 结构
Christian Szegedy Affiliation: Google Inc. Email: szegedy@google.com Vincent Vanhoucke Email: vanhoucke@google.com Sergey Ioffe Email: sioffe@google.com Jonathon Shlens Email: shlens@google.com Zbigniew Wojna Affiliation: University College London Email: zbigniewwojna@gmail.com
Abstract
摘要
Convolutional networks are at the core of most state-of-the-art computer vision solutions for a wide variety of tasks. Since 2014 very deep convolutional networks started to become mainstream, yielding substantial gains in various benchmarks. Although increased model size and computational cost tend to translate to immediate quality gains for most tasks (as long as enough labeled data is provided for training), computational efficiency and low parameter count are still enabling factors for various use cases such as mobile vision and big-data scenarios. Here we are exploring ways to scale up networks in ways that aim at utilizing the added computation as efficiently as possible by suitably factorized convolutions and aggressive regularization. We benchmark our methods on the ILSVRC 2012 classification challenge validation set demonstrate substantial gains over the state of the art: top- and top- error for single frame evaluation using a network with a computational cost of billion multiply-adds per inference and with using less than 25 million parameters. With an ensemble of models and multi-crop evaluation, we report top- error and top- error.
卷积网络已经处在大多数前沿计算机视觉方案的核心,覆盖的任务非常广。从 2014 年起,很深的卷积网络开始成为主流,并在各种基准上带来可观提升。只要训练标签够用,把模型做大、把计算量加上去,多数任务的质量往往立刻就能涨一截;可是计算效率高、参数少,仍然是移动视觉和大数据这类场景能用起来的前提。本文探索的是如何把网络放大,同时尽量把多出来的计算用在刀刃上:办法是恰当地分解卷积,并做比较强的正则。我们在 ILSVRC 2012 分类挑战的验证集上评测,相比当时最好结果有明显提升:用计算量约为每次推断 50 亿次乘加、参数不到 2500 万的网络做单帧评估,top-1 误差 ,top-5 误差 。用 4 个模型集成再加多裁评估,我们报到的是 top-5 误差 、top-1 误差 。
1 Introduction
1 引言
Since the 2012 ImageNet competition [16] winning entry by Krizhevsky et al [9], their network “AlexNet” has been successfully applied to a larger variety of computer vision tasks, for example to object-detection [5], segmentation [12], human pose estimation [22], video classification [8], object tracking [23], and superresolution [3].
自从 Krizhevsky 等人 [9] 的网络在 2012 年 ImageNet 竞赛 [16] 中夺冠以来,他们的 “AlexNet” 已经被成功用到更多计算机视觉任务上,例如目标检测 [5]、分割 [12]、人体姿态估计 [22]、视频分类 [8]、目标跟踪 [23] 以及超分辨率 [3]。
These successes spurred a new line of research that focused on finding higher performing convolutional neural networks. Starting in 2014, the quality of network architectures significantly improved by utilizing deeper and wider networks. VGGNet [18] and GoogLeNet [20] yielded similarly high performance in the 2014 ILSVRC [16] classification challenge. One interesting observation was that gains in the classification performance tend to transfer to significant quality gains in a wide variety of application domains. This means that architectural improvements in deep convolutional architecture can be utilized for improving performance for most other computer vision tasks that are increasingly reliant on high quality, learned visual features. Also, improvements in the network quality resulted in new application domains for convolutional networks in cases where AlexNet features could not compete with hand engineered, crafted solutions, e.g. proposal generation in detection[4].
这些成功引出了一条新的研究路线,核心是寻找性能更高的卷积神经网络。从 2014 年开始,网络结构的质量靠更深、更宽的网络有了明显提高。VGGNet [18] 和 GoogLeNet [20] 在 2014 年 ILSVRC [16] 分类挑战中达到了相近的高水平。一个有意思的现象是:分类性能上的增益,往往会转移到许多应用领域里,变成显著的质量提升。也就是说,深度卷积结构上的改进,大多也能用来提高其他越来越依赖高质量、可学习视觉特征的计算机视觉任务。网络质量提高之后,还出现了一些新的应用领域:在这些地方,AlexNet 特征拼不过手工设计的方案,例如检测里的候选框生成[4]。
Although VGGNet [18] has the compelling feature of architectural simplicity, this comes at a high cost: evaluating the network requires a lot of computation. On the other hand, the Inception architecture of GoogLeNet [20] was also designed to perform well even under strict constraints on memory and computational budget. For example, GoogleNet employed only 5 million parameters, which represented a reduction with respect to its predecessor AlexNet, which used million parameters. Furthermore, VGGNet employed about 3x more parameters than AlexNet.
VGGNet [18] 的结构很简单,这是它吸引人的地方,但代价不小:评估这个网络需要大量计算。另一边,GoogLeNet 的 Inception 结构 [20] 从一开始就按内存和计算预算很紧的条件来设计。例如,GoogLeNet 只用了 500 万参数,相对前作 AlexNet 的 百万参数,大约减少了 。VGGNet 的参数量则大约是 AlexNet 的 3 倍。
The computational cost of Inception is also much lower than VGGNet or its higher performing successors [6]. This has made it feasible to utilize Inception networks in big-data scenarios[17], [13], where huge amount of data needed to be processed at reasonable cost or scenarios where memory or computational capacity is inherently limited, for example in mobile vision settings. It is certainly possible to mitigate parts of these issues by applying specialized solutions to target memory use [2], [15] or by optimizing the execution of certain operations via computational tricks [10]. However, these methods add extra complexity. Furthermore, these methods could be applied to optimize the Inception architecture as well, widening the efficiency gap again.
Inception 的计算量也明显低于 VGGNet,以及后来那些性能更高的后继网络 [6]。正因为如此,它才适合用在大数据场景[17], [13]——那里需要以合理成本处理海量数据——也适合用在内存或算力本身就有限的场合,例如移动视觉。当然,也可以用专门办法压内存占用 [2], [15],或用计算技巧加速某些运算 [10],从而缓解一部分问题。不过这些方法会额外增加复杂度。而且,同样的优化也可以再套到 Inception 结构上,效率上的差距往往又会被拉开。
Still, the complexity of the Inception architecture makes it more difficult to make changes to the network. If the architecture is scaled up naively, large parts of the computational gains can be immediately lost. Also, [20] does not provide a clear description about the contributing factors that lead to the various design decisions of the GoogLeNet architecture. This makes it much harder to adapt it to new use-cases while maintaining its efficiency. For example, if it is deemed necessary to increase the capacity of some Inception-style model, the simple transformation of just doubling the number of all filter bank sizes will lead to a 4x increase in both computational cost and number of parameters. This might prove prohibitive or unreasonable in a lot of practical scenarios, especially if the associated gains are modest. In this paper, we start with describing a few general principles and optimization ideas that that proved to be useful for scaling up convolution networks in efficient ways. Although our principles are not limited to Inception-type networks, they are easier to observe in that context as the generic structure of the Inception style building blocks is flexible enough to incorporate those constraints naturally. This is enabled by the generous use of dimensional reduction and parallel structures of the Inception modules which allows for mitigating the impact of structural changes on nearby components. Still, one needs to be cautious about doing so, as some guiding principles should be observed to maintain high quality of the models.
尽管如此,Inception 结构比较复杂,改起来也更不容易。如果只是粗暴地把结构放大,原先省下来的计算很快就会被吃掉。[20] 也没有把 GoogLeNet 各项设计决策背后的因素讲清楚。这就更难在保持效率的同时,把它改到新的用途上。比方说,如果觉得某个 Inception 风格的模型容量不够,只是把所有滤波器组的尺寸加倍,计算量和参数量都会变成 4 倍。在很多实际场景里,这样的代价可能高得无法接受,尤其是换来的收益并不大的时候。本文先介绍几条一般原则和优化思路,它们在高效放大卷积网络时被证明有用。这些原则并不限于 Inception 类网络,只是在这种结构里更容易看出来:Inception 风格积木的通用形态足够灵活,能比较自然地纳入这些约束。这靠的是 Inception 模块里大量使用的降维和并行结构,从而减轻结构改动对邻近部件的冲击。即便如此,改的时候仍要小心,一些指导原则还是应当遵守,才能把模型质量稳住。
2 General Design Principles
2 一般设计原则
Here we will describe a few design principles based on large-scale experimentation with various architectural choices with convolutional networks. At this point, the utility of the principles below are speculative and additional future experimental evidence will be necessary to assess their accuracy and domain of validity. Still, grave deviations from these principles tended to result in deterioration in the quality of the networks and fixing situations where those deviations were detected resulted in improved architectures in general.
下面几条设计原则,来自我们对卷积网络各种结构选择所做的大规模实验。就目前而言,这些原则的用处还带有推测成分,它们的准确性以及适用范围,还需要更多后续实验来检验。不过,一旦明显偏离这些原则,网络质量往往就会变差;把这些偏离纠正之后,结构通常也会变好。
- Avoid representational bottlenecks, especially early in the network. Feed-forward networks can be represented by an acyclic graph from the input layer(s) to the classifier or regressor. This defines a clear direction for the information flow. For any cut separating the inputs from the outputs, one can access the amount of information passing though the cut. One should avoid bottlenecks with extreme compression. In general the representation size should gently decrease from the inputs to the outputs before reaching the final representation used for the task at hand. Theoretically, information content can not be assessed merely by the dimensionality of the representation as it discards important factors like correlation structure; the dimensionality merely provides a rough estimate of information content.
- 避免表征瓶颈,尤其是在网络的前段。前馈网络可以看成从输入层到分类器或回归器的有向无环图,信息流动的方向因此是清楚的。对任意一条把输入和输出分开的割,都可以衡量穿过这条割的信息量。应当避免极端压缩造成的瓶颈。一般说来,在到达最终用于当前任务的表征之前,表征尺寸应当从输入到输出平缓地减小。从理论上讲,信息量不能只靠表征的维数来衡量,因为维数忽略了相关结构这类重要因素;维数只是对信息量的一个粗略估计。
- Higher dimensional representations are easier to process locally within a network. Increasing the activations per tile in a convolutional network allows for more disentangled features. The resulting networks will train faster.
- 更高维的表征,在网络内部做局部处理时更轻松。提高卷积网络中每个位置的激活数,可以得到更易分开的特征。这样的网络通常也会训得更快。
- Spatial aggregation can be done over lower dimensional embeddings without much or any loss in representational power. For example, before performing a more spread out (e.g. ) convolution, one can reduce the dimension of the input representation before the spatial aggregation without expecting serious adverse effects. We hypothesize that the reason for that is the strong correlation between adjacent unit results in much less loss of information during dimension reduction, if the outputs are used in a spatial aggregation context. Given that these signals should be easily compressible, the dimension reduction even promotes faster learning.
- 空间聚合可以在较低维的嵌入上完成,表征能力不会有太大损失,有时甚至几乎没有损失。例如,在做范围更大的卷积(如 )之前,可以先把输入表征的维数降下来,再做空间聚合,通常不必担心会有严重的副作用。我们的假设是:相邻单元之间相关性很强,如果输出是用在空间聚合的语境里,降维时丢掉的信息会少得多。既然这些信号本来就比较容易压缩,降维甚至还可能让学习更快。
- Balance the width and depth of the network. Optimal performance of the network can be reached by balancing the number of filters per stage and the depth of the network. Increasing both the width and the depth of the network can contribute to higher quality networks. However, the optimal improvement for a constant amount of computation can be reached if both are increased in parallel. The computational budget should therefore be distributed in a balanced way between the depth and width of the network.
- 平衡网络的宽度和深度。网络的最佳性能,来自每一级滤波器数量与网络深度之间的平衡。加宽和加深都可以提高网络质量。不过,在计算量固定时,两者一起增加才能得到最好的提升。因此,计算预算应当在网络的深度和宽度之间均衡分配。
Although these principles might make sense, it is not straightforward to use them to improve the quality of networks out of box. The idea is to use them judiciously in ambiguous situations only.
这些原则听起来合理,但并不能拿来直接、不加判断地提高网络质量。它们的用法是:只在情况含糊、难以取舍时,再审慎地用它们来帮忙。
3 Factorizing Convolutions with Large Filter Size
3 分解带大滤波器的卷积
Much of the original gains of the GoogLeNet network [20] arise from a very generous use of dimension reduction. This can be viewed as a special case of factorizing convolutions in a computationally efficient manner. Consider for example the case of a convolutional layer followed by a convolutional layer. In a vision network, it is expected that the outputs of near-by activations are highly correlated. Therefore, we can expect that their activations can be reduced before aggregation and that this should result in similarly expressive local representations.
GoogLeNet 网络 [20] 最初的不少收益,来自非常放手地使用降维。这可以看成以节省计算的方式分解卷积的一个特例。比方说,先做一层 卷积,再接一层 卷积。在视觉网络里,邻近激活的输出通常高度相关。因此可以预期,在聚合之前把这些激活的维数降下来,仍然能得到同样有表达力的局部表征。
Here we explore other ways of factorizing convolutions in various settings, especially in order to increase the computational efficiency of the solution. Since Inception networks are fully convolutional, each weight corresponds to one multiplication per activation. Therefore, any reduction in computational cost results in reduced number of parameters. This means that with suitable factorization, we can end up with more disentangled parameters and therefore with faster training. Also, we can use the computational and memory savings to increase the filter-bank sizes of our network while maintaining our ability to train each model replica on a single computer.
这里我们再看几种不同设定下分解卷积的办法,尤其是为了提高方案的计算效率。由于 Inception 网络是全卷积的,每个权重都对应激活上的一次乘法。所以,只要计算量降下来,参数量也会跟着降。这意味着,只要分解得当,我们能得到更易分开的参数,训练也会更快。省下来的计算和内存,还可以用来加大网络的滤波器组,同时仍然能在单台机器上训练每个模型副本。
3.1 Factorization into smaller convolutions
3.1 分解成更小的卷积
Convolutions with larger spatial filters (e.g. or ) tend to be disproportionally expensive in terms of computation. For example, a convolution with filters over a grid with filters is 25/9 = 2.78 times more computationally expensive than a convolution with the same number of filters. Of course, a filter can capture dependencies between signals between activations of units further away in the earlier layers, so a reduction of the geometric size of the filters comes at a large cost of expressiveness. However, we can ask whether a convolution could be replaced by a multi-layer network with less parameters with the same input size and output depth. If we zoom into the computation graph of the convolution, we see that each output looks like a small fully-connected network sliding over tiles over its input (see Figure 1).
空间滤波器比较大的卷积(例如 或 ),计算代价往往不成比例地高。例如,在一个有 个滤波器的网格上,用 个滤波器做 卷积,计算量是同样滤波器数量的 卷积的 = 2.78 倍。当然, 滤波器能够捕捉到更早层里相距更远的单元激活之间的依赖,把滤波器的几何尺寸缩小,表达能力会付出不小的代价。不过我们仍然可以问: 卷积能不能换成一个参数更少、输入尺寸和输出深度却相同的多层网络?如果放大 卷积的计算图,就会看到:每个输出都像一个在输入上滑动的小型全连接网络,每次看的是 的小块(见图 1)。
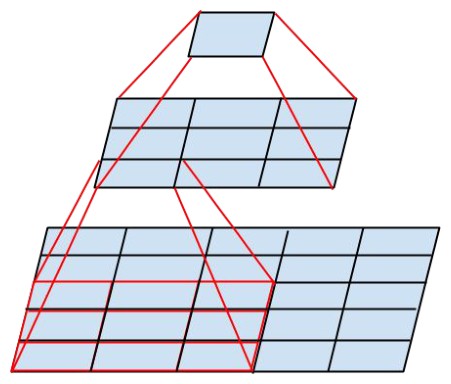
Figure 1: Mini-network replacing the convolutions.
图 1:用来替换 卷积的微型网络。
Since we are constructing a vision network, it seems natural to exploit translation invariance again and replace the fully connected component by a two layer convolutional architecture: the first layer is a convolution, the second is a fully connected layer on top of the output grid of the first layer (see Figure 1). Sliding this small network over the input activation grid boils down to replacing the convolution with two layers of convolution (compare Figure 4 with 5).
既然我们搭的是视觉网络,再一次利用平移不变性就是很自然的想法:把全连接部分换成两层卷积结构。第一层是 卷积,第二层是接在第一层 输出网格上的全连接层(见图 1)。把这个小网络在输入激活网格上滑过去,等价于用两层 卷积替换原来的 卷积(比较图 4 与图 5)。
This setup clearly reduces the parameter count by sharing the weights between adjacent tiles. To analyze the expected computational cost savings, we will make a few simplifying assumptions that apply for the typical situations: We can assume that , that is that we want to change the number of activations/unit by a constant alpha factor. Since the convolution is aggregating, is typically slightly larger than one (around 1.5 in the case of GoogLeNet). Having a two layer replacement for the layer, it seems reasonable to reach this expansion in two steps: increasing the number of filters by in both steps. In order to simplify our estimate by choosing (no expansion), If we would naivly slide a network without reusing the computation between neighboring grid tiles, we would increase the computational cost. sliding this network can be represented by two convolutional layers which reuses the activations between adjacent tiles. This way, we end up with a net reduction of computation, resulting in a relative gain of by this factorization. The exact same saving holds for the parameter count as each parameter is used exactly once in the computation of the activation of each unit. Still, this setup raises two general questions: Does this replacement result in any loss of expressiveness? If our main goal is to factorize the linear part of the computation, would it not suggest to keep linear activations in the first layer? We have ran several control experiments (for example see figure 2) and using linear activation was always inferior to using rectified linear units in all stages of the factorization. We attribute this gain to the enhanced space of variations that the network can learn especially if we batch-normalize [7] the output activations. One can see similar effects when using linear activations for the dimension reduction components.
这种安排显然会减少参数,因为它在相邻小块之间共享了权重。为了估计能省下多少计算,我们先做几条符合典型情形的简化假设:可以令 ,也就是希望把每个单元的激活数按一个常数因子 alpha 来改。由于 卷积本身在做聚合, 通常略大于 1(在 GoogLeNet 里大约是 1.5)。用两层来替换 层时,把这一扩展分两步完成是合理的:每一步都把滤波器数乘上 。为了简化估计,取 (不做扩展)。如果只是天真地把一个网络滑过去、却不在相邻网格块之间复用计算,计算量反而会增加。而滑动这个网络,可以表示成两层 卷积,它们会在相邻小块之间复用激活。这样一来,计算量变成原来的 ,相对能省下 。参数量的节省完全一样,因为每个参数在计算每个单元的激活时恰好被用到一次。不过这种安排还引出两个一般性问题:这样替换会不会损失表达能力?如果我们的主要目标是分解计算中的线性部分,是不是应该让第一层保持线性激活?我们做了多组对照实验(例如见图 2),在分解的每一级都使用线性激活,效果始终不如使用整流线性单元。我们把这一收益归因于网络能够学习的变化空间被扩大了,尤其是在对输出激活做了批归一化 [7] 之后。在降维部件上使用线性激活时,也能看到类似的效果。
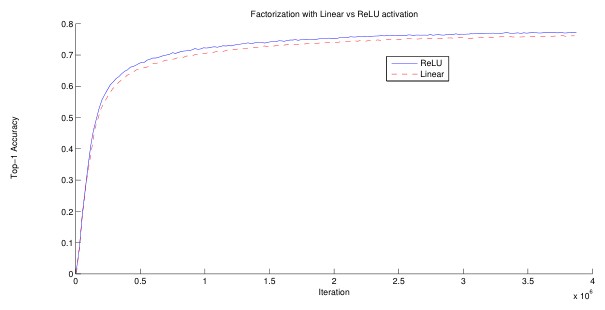
Figure 2: One of several control experiments between two Inception models, one of them uses factorization into linear + ReLU layers, the other uses two ReLU layers. After million operations, the former settles at , while the latter reaches top-1 Accuracy on the validation set.
图 2:两组 Inception 模型的对照实验之一。其中一个把分解做成线性层加 ReLU,另一个用两层 ReLU。在 百万次运算之后,前者的验证集 top-1 精度停在 ,后者达到 。
3.2 Spatial Factorization into Asymmetric Convolutions
3.2 空间分解成非对称卷积
The above results suggest that convolutions with filters larger a might not be generally useful as they can always be reduced into a sequence of convolutional layers. Still we can ask the question whether one should factorize them into smaller, for example convolutions. However, it turns out that one can do even better than by using asymmetric convolutions, e.g. . For example using a convolution followed by a convolution is equivalent to sliding a two layer network with the same receptive field as in a convolution (see figure 3). Still the two-layer solution is cheaper for the same number of output filters, if the number of input and output filters is equal.
上面的结果说明,滤波器比 更大的卷积未必普遍有用,因为它们总可以化成一串 卷积层。我们仍然可以问:要不要把它们再拆得更小,比如拆成 卷积?结果是,用非对称卷积(例如 )可以比 更好。举例来说,先做 卷积再做 卷积,等价于滑动一个感受野与 卷积相同的两层网络(见图 3)。在输入、输出滤波器数量相同的前提下,这个两层方案还便宜 。
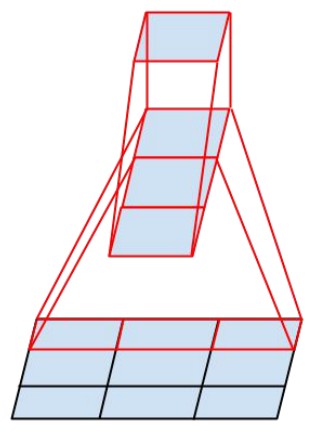
Figure 3: Mini-network replacing the convolutions. The lower layer of this network consists of a convolution with output units.
图 3:用来替换 卷积的微型网络。这个网络的下层是一个有 个输出单元的 卷积。
By comparison, factorizing a convolution into a two convolution represents only a saving of computation.
相比之下,把一个 卷积分解成两个 卷积,只能省下 的计算。
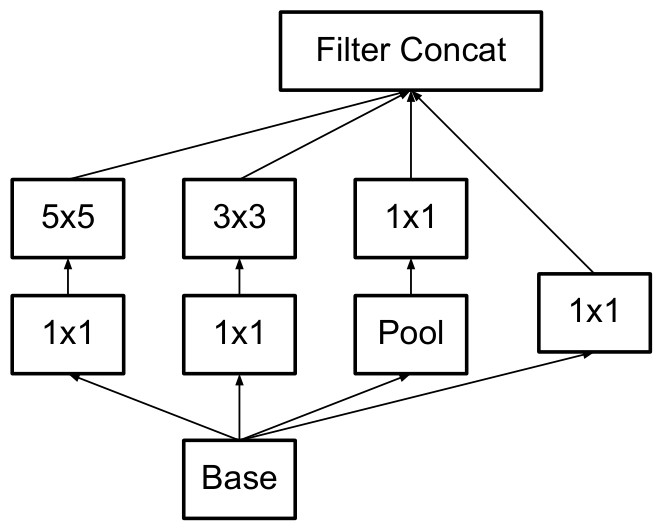
Figure 4: Original Inception module as described in [20].
图 4:文献 [20] 中描述的原始 Inception 模块。
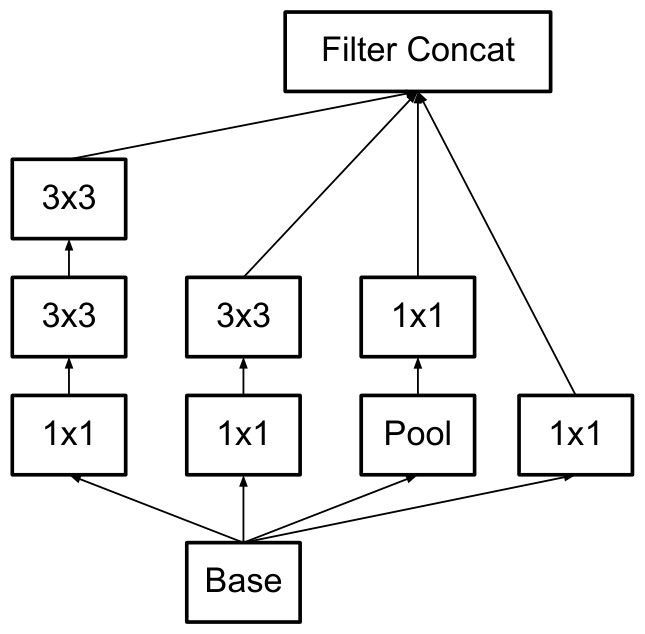
Figure 5: Inception modules where each convolution is replaced by two convolution, as suggested by principle 3 of Section 2.
图 5:按照第 2 节原则 3,把每个 卷积替换成两个 卷积后的 Inception 模块。
.
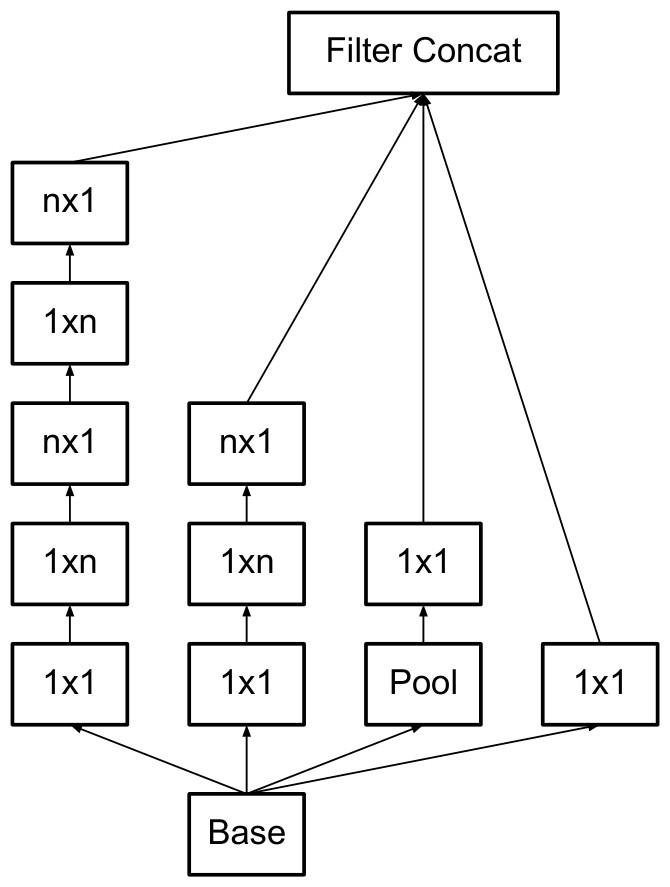
Figure 6: Inception modules after the factorization of the convolutions. In our proposed architecture, we chose for the grid. (The filter sizes are picked using principle 3)
图 6:把 卷积分解之后的 Inception 模块。在我们提出的结构里,对 网格取 。(滤波器尺寸按原则 3 选取)
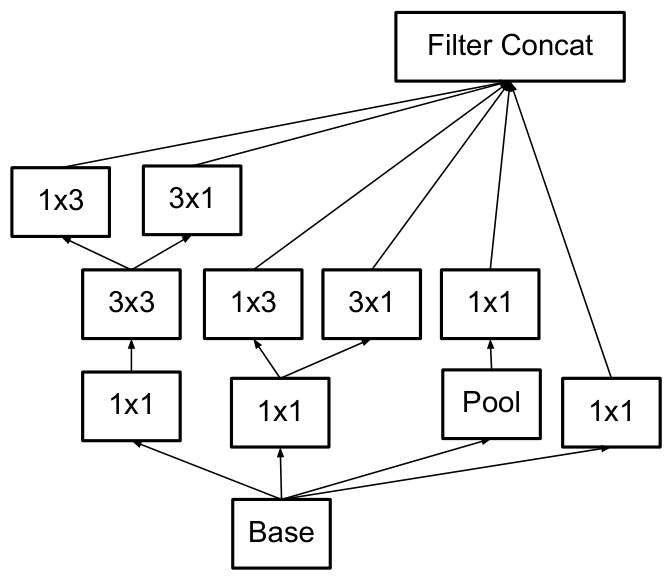
Figure 7: Inception modules with expanded the filter bank outputs. This architecture is used on the coarsest () grids to promote high dimensional representations, as suggested by principle 2 of Section 2. We are using this solution only on the coarsest grid, since that is the place where producing high dimensional sparse representation is the most critical as the ratio of local processing (by convolutions) is increased compared to the spatial aggregation.
图 7:扩展了滤波器组输出的 Inception 模块。这种结构用在最粗的()网格上,以促进高维表征,这与第 2 节原则 2 的建议一致。我们只在最粗的网格上使用这一方案,因为正是在这里,相对空间聚合而言,局部处理(由 卷积完成)的比例提高了,生成高维稀疏表征也最为关键。
In theory, we could go even further and argue that one can replace any convolution by a convolution followed by a convolution and the computational cost saving increases dramatically as grows (see figure 6). In practice, we have found that employing this factorization does not work well on early layers, but it gives very good results on medium grid-sizes (On feature maps, where ranges between and ). On that level, very good results can be achieved by using convolutions followed by convolutions.
从理论上说,还可以走得更远:任意 卷积都可以换成一个 卷积再接一个 卷积,而且随着 变大,节省的计算会急剧增加(见图 6)。实践中我们发现,这种分解用在早期层上效果不好,但在中等网格尺寸上效果很好(在 特征图上, 介于 和 之间)。在这一层上,用 卷积再接 卷积,就能得到很好的结果。
4 Utility of Auxiliary Classifiers
4 辅助分类器的用处
[20] has introduced the notion of auxiliary classifiers to improve the convergence of very deep networks. The original motivation was to push useful gradients to the lower layers to make them immediately useful and improve the convergence during training by combating the vanishing gradient problem in very deep networks. Also Lee et al[11] argues that auxiliary classifiers promote more stable learning and better convergence.
文献 [20] 引入了辅助分类器,用来改善很深网络的收敛。最初的动机是把有用的梯度推到更浅的层,让这些层立刻派上用场,并通过对抗很深网络中的梯度消失,改善训练时的收敛。Lee 等人[11] 也认为,辅助分类器能促进更稳定的学习和更好的收敛。
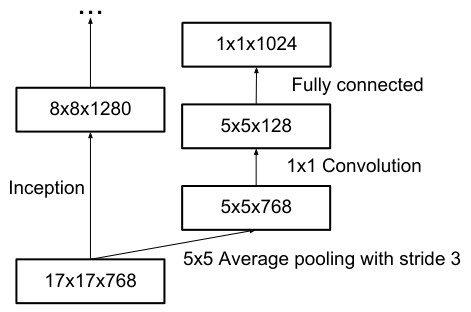
Figure 8: Auxiliary classifier on top of the last layer. Batch normalization[7] of the layers in the side head results in a absolute gain in top- accuracy. The lower axis shows the number of itertions performed, each with batch size .
图 8:接在最后一层 特征图上的辅助分类器。对侧枝中的层做批归一化[7],能在 top- 精度上带来 的绝对提升。下轴给出已执行的迭代次数,每次迭代的 batch 大小为 。
Interestingly, we found that auxiliary classifiers did not result in improved convergence early in the training: the training progression of network with and without side head looks virtually identical before both models reach high accuracy. Near the end of training, the network with the auxiliary branches starts to overtake the accuracy of the network without any auxiliary branch and reaches a slightly higher plateau.
有意思的是,我们发现辅助分类器并没有改善训练早期的收敛:带侧枝和不带侧枝的网络,在两者都达到较高精度之前,训练进程几乎一模一样。临近训练结束时,带辅助枝的网络才开始超过没有辅助枝的网络,并达到略高一些的平台。
Also [20] used two side-heads at different stages in the network. The removal of the lower auxiliary branch did not have any adverse effect on the final quality of the network. Together with the earlier observation in the previous paragraph, this means that original the hypothesis of [20] that these branches help evolving the low-level features is most likely misplaced. Instead, we argue that the auxiliary classifiers act as regularizer. This is supported by the fact that the main classifier of the network performs better if the side branch is batch-normalized [7] or has a dropout layer. This also gives a weak supporting evidence for the conjecture that batch normalization acts as a regularizer.
此外,[20] 在网络的不同阶段用了两个侧枝。去掉较浅的那条辅助枝,对网络的最终质量没有任何负面影响。再联系上一段的观察,这说明 [20] 原先认为这些分枝有助于演化浅层特征的假设,多半放错了地方。我们反而认为,辅助分类器起的是正则作用。支持这一点的证据是:如果侧枝做了批归一化 [7],或者带有 dropout 层,网络的主分类器会表现得更好。这对“批归一化本身也在起正则作用”这一猜想,也提供了一点较弱的支持。
5 Efficient Grid Size Reduction
5 高效地缩小网格
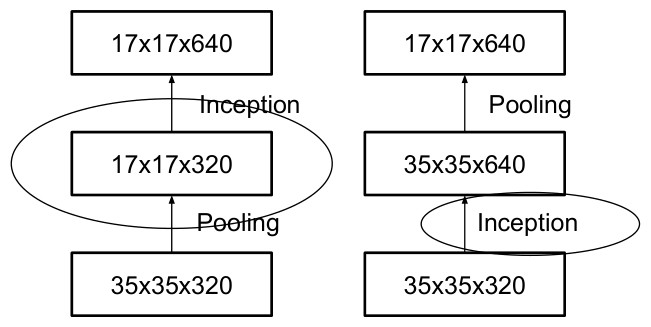
Figure 9: Two alternative ways of reducing the grid size. The solution on the left violates the principle 1 of not introducing an representational bottleneck from Section 2. The version on the right is times more expensive computationally.
图 9:两种缩小网格的方案。左边的方案违反了第 2 节原则 1,引入了表征瓶颈。右边的方案在计算上要贵 倍。
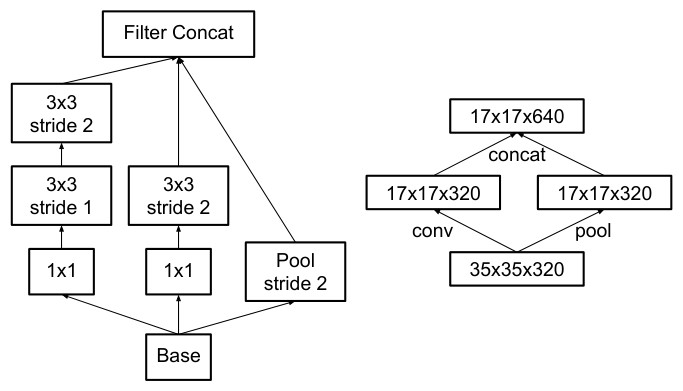
Figure 10: Inception module that reduces the grid-size while expands the filter banks. It is both cheap and avoids the representational bottleneck as is suggested by principle 1. The diagram on the right represents the same solution but from the perspective of grid sizes rather than the operations.
图 10:在缩小网格的同时扩展滤波器组的 Inception 模块。它既便宜,又避免了原则 1 所指出的表征瓶颈。右图表示的是同一方案,只是从网格尺寸而不是从运算的角度来画。
Traditionally, convolutional networks used some pooling operation to decrease the grid size of the feature maps. In order to avoid a representational bottleneck, before applying maximum or average pooling the activation dimension of the network filters is expanded. For example, starting a grid with filters, if we would like to arrive at a grid with filters, we first need to compute a stride-1 convolution with filters and then apply an additional pooling step. This means that the overall computational cost is dominated by the expensive convolution on the larger grid using operations. One possibility would be to switch to pooling with convolution and therefore resulting in reducing the computational cost by a quarter. However, this creates a representational bottlenecks as the overall dimensionality of the representation drops to resulting in less expressive networks (see Figure 9). Instead of doing so, we suggest another variant the reduces the computational cost even further while removing the representational bottleneck. (see Figure 10). We can use two parallel stride 2 blocks: and . is a pooling layer (either average or maximum pooling) the activation, both of them are stride the filter banks of which are concatenated as in figure 10.
传统上,卷积网络会用某种池化运算来缩小特征图的网格。为了避免表征瓶颈,在做最大池化或平均池化之前,会先把网络滤波器的激活维数扩上去。例如,从带 个滤波器的 网格出发,如果希望得到带 个滤波器的 网格,就要先用 个滤波器做步长为 1 的卷积,然后再做一步池化。这样一来,总计算量就被大网格上那场昂贵的卷积主导,运算次数是 。一种可能是改成池化与卷积并行,于是运算次数变成 ,计算量降到四分之一。但这会带来表征瓶颈,因为表征的总体维数掉到了 ,网络的表达力会变弱(见图 9)。我们建议换一种变体,它能进一步降低计算量,同时去掉表征瓶颈(见图 10)。可以用两个并行的步长为 2 的块: 和 。 是对激活做池化的层(平均池化或最大池化),两者的步长都是 ,它们的滤波器组再按图 10 那样拼接起来。
| type | patch size/stride or remarks | input size |
|---|---|---|
| conv | ||
| conv | ||
| conv padded | ||
| pool | ||
| conv | ||
| conv | ||
| conv | ||
| Inception | As in figure 5 | |
| Inception | As in figure 6 | |
| Inception | As in figure 7 | |
| pool | ||
| linear | logits | |
| softmax | classifier |
Table 1: The outline of the proposed network architecture. The output size of each module is the input size of the next one. We are using variations of reduction technique depicted Figure 10 to reduce the grid sizes between the Inception blocks whenever applicable. We have marked the convolution with -padding, which is used to maintain the grid size. -padding is also used inside those Inception modules that do not reduce the grid size. All other layers do not use padding. The various filter bank sizes are chosen to observe principle 4 from Section 2.
| 类型 | 补丁大小/步长 或说明 | 输入尺寸 |
|---|---|---|
| conv | ||
| conv | ||
| conv padded | ||
| pool | ||
| conv | ||
| conv | ||
| conv | ||
| Inception | 如图 5 | |
| Inception | 如图 6 | |
| Inception | 如图 7 | |
| pool | ||
| linear | logits | |
| softmax | 分类器 |
表 1:所提出网络结构的概要。每一模块的输出尺寸就是下一模块的输入尺寸。只要适用,我们都会用图 10 所画的那类缩减技术,在 Inception 块之间缩小网格。我们标出了使用 填充的卷积,这种填充用来保持网格尺寸。那些不缩小网格的 Inception 模块内部也使用 填充。其余层都不使用填充。各滤波器组的尺寸按第 2 节原则 4 来选取。
6 Inception-v2
Here we are connecting the dots from above and propose a new architecture with improved performance on the ILSVRC 2012 classification benchmark. The layout of our network is given in table 1. Note that we have factorized the traditional convolution into three convolutions based on the same ideas as described in section 3.1. For the Inception part of the network, we have traditional inception modules at the with filters each. This is reduced to a grid with filters using the grid reduction technique described in section 5. This is is followed by instances of the factorized inception modules as depicted in figure 5. This is reduced to a grid with the grid reduction technique depicted in figure 10. At the coarsest level, we have two Inception modules as depicted in figure 6, with a concatenated output filter bank size of 2048 for each tile. The detailed structure of the network, including the sizes of filter banks inside the Inception modules, is given in the supplementary material, given in the model.txt that is in the tar-file of this submission. However, we have observed that the quality of the network is relatively stable to variations as long as the principles from Section 2 are observed. Although our network is layers deep, our computation cost is only about higher than that of GoogLeNet and it is still much more efficient than VGGNet.
这里我们把上面的线索连起来,提出一个在 ILSVRC 2012 分类基准上性能更好的新结构。网络布局见表 1。请注意,我们已按第 3.1 节的思路,把传统的 卷积分解成了三个 卷积。网络的 Inception 部分,在 上有 个传统的 Inception 模块,每个模块有 个滤波器。接着用第 5 节的网格缩减技术,把网格降到带 个滤波器的 。随后是 个如图 5 所示的分解版 Inception 模块。再用图 10 的网格缩减技术,降到 的网格。在最粗的 这一级,我们使用两个如图 6 所示的 Inception 模块,每个位置拼接后的输出滤波器组大小为 2048。网络的详细结构,包括 Inception 模块内部各滤波器组的尺寸,写在本次投稿 tar 包里的补充材料 model.txt 中。不过我们观察到,只要遵守第 2 节的原则,网络质量对这些细节变化相对稳定。尽管我们的网络有 层深,计算量大约只比 GoogLeNet 高 倍,仍然比 VGGNet 高效得多。
7 Model Regularization via Label Smoothing
7 用标签平滑做模型正则
Here we propose a mechanism to regularize the classifier layer by estimating the marginalized effect of label-dropout during training.
这里我们提出一种正则分类层的机制,做法是在训练时估计标签 dropout 的边际效应。
For each training example , our model computes the probability of each label : . Here, are the logits or unnormalized log-probabilities. Consider the ground-truth distribution over labels for this training example, normalized so that . For brevity, let us omit the dependence of and on example . We define the loss for the example as the cross entropy: . Minimizing this is equivalent to maximizing the expected log-likelihood of a label, where the label is selected according to its ground-truth distribution . Cross-entropy loss is differentiable with respect to the logits and thus can be used for gradient training of deep models. The gradient has a rather simple form: , which is bounded between and .
对每个训练样本 ,模型会计算每个标签 的概率:。其中 是 logits,也就是未经归一化的对数概率。再看这个训练样本上标签的真值分布 ,它已归一化,使得 。为了行文简短,下面省略 和 对样本 的依赖。我们把该样本的损失定义成交熵:。最小化这一损失,等价于最大化标签的期望对数似然,而标签是按真值分布 来选取的。交叉熵损失对 logits 可微,因而可以用来对深度模型做梯度训练。梯度的形式相当简单:,其取值介于 和 之间。
Consider the case of a single ground-truth label , so that and for all . In this case, minimizing the cross entropy is equivalent to maximizing the log-likelihood of the correct label. For a particular example with label , the log-likelihood is maximized for , where is Dirac delta, which equals for and otherwise. This maximum is not achievable for finite but is approached if for all – that is, if the logit corresponding to the ground-truth label is much great than all other logits. This, however, can cause two problems. First, it may result in over-fitting: if the model learns to assign full probability to the ground-truth label for each training example, it is not guaranteed to generalize. Second, it encourages the differences between the largest logit and all others to become large, and this, combined with the bounded gradient , reduces the ability of the model to adapt. Intuitively, this happens because the model becomes too confident about its predictions.
考虑只有一个真值标签 的情形,于是 ,对所有 都有 。这时,最小化交叉熵就等价于最大化正确标签的对数似然。对带标签 的某个样本 ,对数似然在 时取到最大,其中 是狄拉克函数,当 时为 ,否则为 。这个最大值在 为有限值时达不到,但若对所有 都有 ,也就是对应真值标签的 logit 远大于其他所有 logit,就可以逼近它。不过这会带来两个问题。第一,它可能导致过拟合:如果模型学会给每个训练样本的真值标签都赋上全部概率,并不能保证能够泛化。第二,它会鼓励最大 logit 与其他 logit 之间的差距变得很大;再叠加上有界梯度 ,模型的适应能力就会变弱。直观上看,这是因为模型对自己的预测过于自信了。
We propose a mechanism for encouraging the model to be less confident. While this may not be desired if the goal is to maximize the log-likelihood of training labels, it does regularize the model and makes it more adaptable. The method is very simple. Consider a distribution over labels , independent of the training example , and a smoothing parameter . For a training example with ground-truth label , we replace the label distribution with
我们提出一种机制,鼓励模型不要那么自信。如果目标是最大化训练标签的对数似然,这未必是想要的;但它确实能正则模型,并让模型更灵活。方法非常简单。考虑一个与训练样本 无关 的标签分布 ,以及一个平滑参数 。对真值标签为 的训练样本,我们把标签分布 替换成
which is a mixture of the original ground-truth distribution and the fixed distribution , with weights and , respectively. This can be seen as the distribution of the label obtained as follows: first, set it to the ground-truth label ; then, with probability , replace with a sample drawn from the distribution . We propose to use the prior distribution over labels as . In our experiments, we used the uniform distribution , so that
也就是原来的真值分布 与固定分布 的混合,权重分别是 和 。这可以看成按如下方式得到标签 的分布:先把它设成真值标签 ;然后以概率 ,再用从分布 中抽出的一个样本替换 。我们建议把标签的先验分布当作 。实验中我们使用均匀分布 ,于是
We refer to this change in ground-truth label distribution as label-smoothing regularization, or LSR.
我们把真值标签分布上的这一改动称为 标签平滑正则(label-smoothing regularization),简称 LSR。
Note that LSR achieves the desired goal of preventing the largest logit from becoming much larger than all others. Indeed, if this were to happen, then a single would approach while all others would approach . This would result in a large cross-entropy with because, unlike , all have a positive lower bound.
请注意,LSR 达到了预期目标:阻止最大的 logit 变得远大于其他所有 logit。的确,如果出现这种情况,某一个 会趋近 ,其余则会趋近 。这会与 产生很大的交叉熵,因为与 不同,所有 都有一个正的下界。
Another interpretation of LSR can be obtained by considering the cross entropy:
从交叉熵出发,还可以得到对 LSR 的另一种解释:
Thus, LSR is equivalent to replacing a single cross-entropy loss with a pair of such losses and . The second loss penalizes the deviation of predicted label distribution from the prior , with the relative weight . Note that this deviation could be equivalently captured by the KL divergence, since and is fixed. When is the uniform distribution, is a measure of how dissimilar the predicted distribution is to uniform, which could also be measured (but not equivalently) by negative entropy ; we have not experimented with this approach.
因此,LSR 等价于把单个交叉熵损失 换成一对这样的损失 和 。第二项损失惩罚预测标签分布 偏离先验 ,相对权重是 。请注意,这一偏离也可以用 KL 散度来刻画,因为 ,而 是固定的。当 是均匀分布时, 衡量的是预测分布 与均匀分布有多不相似;负熵 也能衡量这一点(但两者并不等价)。我们没有尝试过后一种做法。
In our ImageNet experiments with classes, we used and . For ILSVRC 2012, we have found a consistent improvement of about absolute both for top- error and the top- error (cf. Table 3).
在我们 类的 ImageNet 实验中,取 、。在 ILSVRC 2012 上,我们发现 top- 误差和 top- 误差都有大约 的稳定绝对提升(参见表 3)。
8 Training Methodology
8 训练方法
We have trained our networks with stochastic gradient utilizing the TensorFlow [1] distributed machine learning system using replicas running each on a NVidia Kepler GPU with batch size for epochs. Our earlier experiments used momentum [19] with a decay of , while our best models were achieved using RMSProp [21] with decay of and . We used a learning rate of , decayed every two epoch using an exponential rate of . In addition, gradient clipping [14] with threshold was found to be useful to stabilize the training. Model evaluations are performed using a running average of the parameters computed over time.
我们用随机梯度、借助 TensorFlow [1] 分布式机器学习系统来训练网络:共 个副本,每个副本跑在一块 NVIDIA Kepler GPU 上,batch 大小为 ,训练 个 epoch。较早的实验使用动量 [19],衰减为 ;最好的模型则是用 RMSProp [21] 得到的,衰减为 ,。学习率取 ,每两个 epoch 按 的指数速率衰减。此外,我们发现阈值为 的梯度裁剪 [14] 有助于稳定训练。模型评估使用随时间计算的参数滑动平均。
9 Performance on Lower Resolution Input
9 较低分辨率输入上的表现
A typical use-case of vision networks is for the the post-classification of detection, for example in the Multibox [4] context. This includes the analysis of a relative small patch of the image containing a single object with some context. The tasks is to decide whether the center part of the patch corresponds to some object and determine the class of the object if it does. The challenge is that objects tend to be relatively small and low-resolution. This raises the question of how to properly deal with lower resolution input.
视觉网络的一个典型用途,是在检测之后做后分类,例如在 Multibox [4] 的设定里。这包括分析图像中一块相对较小、包含单个物体及一些上下文的补丁。任务是判断这块补丁的中心是否对应某个物体,如果是,再确定物体的类别。困难在于,物体往往比较小、分辨率也比较低。这就提出了一个问题:应当如何妥善处理较低分辨率的输入。
The common wisdom is that models employing higher resolution receptive fields tend to result in significantly improved recognition performance. However it is important to distinguish between the effect of the increased resolution of the first layer receptive field and the effects of larger model capacitance and computation. If we just change the resolution of the input without further adjustment to the model, then we end up using computationally much cheaper models to solve more difficult tasks. Of course, it is natural, that these solutions loose out already because of the reduced computational effort. In order to make an accurate assessment, the model needs to analyze vague hints in order to be able to “hallucinate” the fine details. This is computationally costly. The question remains therefore: how much does higher input resolution helps if the computational effort is kept constant. One simple way to ensure constant effort is to reduce the strides of the first two layer in the case of lower resolution input, or by simply removing the first pooling layer of the network.
一种常见的看法是,采用更高分辨率感受野的模型,识别性能往往会显著更好。但必须把第一层感受野分辨率提高所带来的影响,与更大模型容量、更多计算所带来的影响区分开。如果只改输入分辨率、却不进一步调整模型,结果就是用计算上便宜得多的模型去解决更难的任务。这些方案表现变差,当然也很自然,因为计算投入已经减少了。为了做出准确判断,模型需要分析那些含糊的线索,才能“幻想”出细部。这在计算上是昂贵的。因此问题仍然是:如果把计算量保持不变,更高的输入分辨率到底能帮助多少。保证计算量不变的一个简单办法,是在输入分辨率较低时减小前两层的步长,或者直接去掉网络的第一层池化。
For this purpose we have performed the following three experiments:
为此,我们做了下面三组实验:
- receptive field with stride and maximum pooling after the first layer.
- 感受野,步长为 ,第一层之后做最大池化。
- receptive field with stride and maximum pooling after the first layer.
- 感受野,步长为 ,第一层之后做最大池化。
- receptive field with stride and without pooling after the first layer.
- 感受野,步长为 ,第一层之后不做池化。
All three networks have almost identical computational cost. Although the third network is slightly cheaper, the cost of the pooling layer is marginal and (within of the total cost of the)network. In each case, the networks were trained until convergence and their quality was measured on the validation set of the ImageNet ILSVRC 2012 classification benchmark. The results can be seen in table 2. Although the lower-resolution networks take longer to train, the quality of the final result is quite close to that of their higher resolution counterparts.
三个网络的计算量几乎相同。虽然第三个网络略便宜一些,但池化层的代价可以忽略(在网络总代价的 以内)。每种情形下,网络都训练到收敛,并在 ImageNet ILSVRC 2012 分类基准的验证集上衡量质量。结果见表 2。尽管较低分辨率的网络需要更长的训练时间,最终结果的质量与较高分辨率的对应网络相当接近。
However, if one would just naively reduce the network size according to the input resolution, then network would perform much more poorly. However this would an unfair comparison as we would are comparing a 16 times cheaper model on a more difficult task.
不过,如果只是按输入分辨率天真地缩小网络,网络的表现会差得多。但这并不是公平的比较,因为我们是在用一个便宜 16 倍的模型,去解决一项更难的任务。
Also these results of table 2 suggest, one might consider using dedicated high-cost low resolution networks for smaller objects in the R-CNN [5] context.
表 2 的这些结果也说明,在 R-CNN [5] 的设定里,或许可以考虑为较小的物体配备专门的、计算量更高的低分辨率网络。
| Receptive Field Size | Top-1 Accuracy (single frame) |
|---|---|
| 75.2% | |
| 76.4% | |
| 76.6% |
Table 2: Comparison of recognition performance when the size of the receptive field varies, but the computational cost is constant.
| 感受野尺寸 | Top-1 精度(单帧) |
|---|---|
| 75.2% | |
| 76.4% | |
| 76.6% |
表 2:感受野尺寸变化、但计算量保持不变时的识别性能比较。
10 Experimental Results and Comparisons
10 实验结果与比较
| Network | Top-1 Error | Top-5 Error | Cost Bn Ops |
|---|---|---|---|
| GoogLeNet [20] | 29% | 9.2% | 1.5 |
| BN-GoogLeNet | 26.8% | - | 1.5 |
| BN-Inception [7] | 25.2% | 7.8 | 2.0 |
| Inception-v2 | 23.4% | - | 3.8 |
| Inception-v2 RMSProp | 23.1% | 6.3 | 3.8 |
| Inception-v2 Label Smoothing | 22.8% | 6.1 | 3.8 |
| Inception-v2 Factorized | 21.6% | 5.8 | 4.8 |
| Inception-v2 BN-auxiliary | 21.2% | 5.6% | 4.8 |
Table 3: Single crop experimental results comparing the cumulative effects on the various contributing factors. We compare our numbers with the best published single-crop inference for Ioffe at al [7]. For the “Inception-v2” lines, the changes are cumulative and each subsequent line includes the new change in addition to the previous ones. The last line is referring to all the changes is what we refer to as “Inception-v3” below. Unfortunately, He et al [6] reports the only 10-crop evaluation results, but not single crop results, which is reported in the Table 4 below.
| 网络 | Top-1 误差 | Top-5 误差 | 代价 十亿次运算 |
|---|---|---|---|
| GoogLeNet [20] | 29% | 9.2% | 1.5 |
| BN-GoogLeNet | 26.8% | - | 1.5 |
| BN-Inception [7] | 25.2% | 7.8 | 2.0 |
| Inception-v2 | 23.4% | - | 3.8 |
| Inception-v2 RMSProp | 23.1% | 6.3 | 3.8 |
| Inception-v2 Label Smoothing | 22.8% | 6.1 | 3.8 |
| Inception-v2 Factorized | 21.6% | 5.8 | 4.8 |
| Inception-v2 BN-auxiliary | 21.2% | 5.6% | 4.8 |
表 3:单裁实验结果,比较各项因素的累加效果。我们把数字与 Ioffe 等人 [7] 已发表的最好单裁推断结果相比较。对 “Inception-v2” 各行而言,改动是累加的,每一行都在前面各行的基础上加入新的改动。最后一行包含全部改动,也就是下文所说的 “Inception-v3”。遗憾的是,He 等人 [6] 只报告了 10 裁评估结果,没有单裁结果;单裁结果写在下面的表 4 中。
Table 3 shows the experimental results about the recognition performance of our proposed architecture (Inception-v2) as described in Section 6. Each Inception-v2 line shows the result of the cumulative changes including the highlighted new modification plus all the earlier ones. Label Smoothing refers to method described in Section 7. Factorized includes a change that factorizes the first convolutional layer into a sequence of convolutional layers. BN-auxiliary refers to the version in which the fully connected layer of the auxiliary classifier is also batch-normalized, not just the convolutions. We are referring to the model in last row of Table 3 as Inception-v3 and evaluate its performance in the multi-crop and ensemble settings.
表 3 给出了第 6 节所描述的结构(Inception-v2)的识别性能实验结果。每一行 Inception-v2 都是累加改动后的结果,既包括标出的新修改,也包括此前所有修改。Label Smoothing 指第 7 节的方法。Factorized 包含一项改动:把第一层 卷积分解成一串 卷积层。BN-auxiliary 指辅助分类器的全连接层也做了批归一化,而不仅仅是卷积。我们把表 3 最后一行的模型称为 Inception-v3,并在多裁和集成设定下评估它的性能。
All our evaluations are done on the 48238 non-blacklisted examples on the ILSVRC-2012 validation set, as suggested by [16]. We have evaluated all the 50000 examples as well and the results were roughly 0.1% worse in top-5 error and around 0.2% in top-1 error. In the upcoming version of this paper, we will verify our ensemble result on the test set, but at the time of our last evaluation of BN-Inception in spring [7] indicates that the test and validation set error tends to correlate very well.
我们的全部评估都在 ILSVRC-2012 验证集上 48238 个未被列入黑名单的样本上进行,这是文献 [16] 的建议。我们也评估了全部 50000 个样本,结果大约差 0.1% 的 top-5 误差,以及大约 0.2% 的 top-1 误差。在本文的后续版本中,我们将在测试集上核实集成结果;不过,我们上次在春季评估 BN-Inception [7] 时已经表明,测试集误差与验证集误差往往相关性很好。
| Network | Crops Evaluated | Top-5 Error | Top-1 Error |
|---|---|---|---|
| GoogLeNet [20] | 10 | - | 9.15% |
| GoogLeNet [20] | 144 | - | 7.89% |
| VGG [18] | - | 24.4% | 6.8% |
| BN-Inception [7] | 144 | 22% | 5.82% |
| PReLU [6] | 10 | 24.27% | 7.38% |
| PReLU [6] | - | 21.59% | 5.71% |
| Inception-v3 | 12 | 19.47% | 4.48% |
| Inception-v3 | 144 | 18.77% | 4.2% |
Table 4: Single-model, multi-crop experimental results comparing the cumulative effects on the various contributing factors. We compare our numbers with the best published single-model inference results on the ILSVRC 2012 classification benchmark.
| 网络 | 评估的裁剪数 | Top-5 误差 | Top-1 误差 |
|---|---|---|---|
| GoogLeNet [20] | 10 | - | 9.15% |
| GoogLeNet [20] | 144 | - | 7.89% |
| VGG [18] | - | 24.4% | 6.8% |
| BN-Inception [7] | 144 | 22% | 5.82% |
| PReLU [6] | 10 | 24.27% | 7.38% |
| PReLU [6] | - | 21.59% | 5.71% |
| Inception-v3 | 12 | 19.47% | 4.48% |
| Inception-v3 | 144 | 18.77% | 4.2% |
表 4:单模型、多裁实验结果,比较各项因素的累加效果。我们把数字与 ILSVRC 2012 分类基准上已发表的最好单模型推断结果相比较。
| Network | Models Evaluated | Crops Evaluated | Top-1 Error | Top-5 Error |
|---|---|---|---|---|
| VGGNet [18] | 2 | - | 23.7% | 6.8% |
| GoogLeNet [20] | 7 | 144 | - | 6.67% |
| PReLU [6] | - | - | - | 4.94% |
| BN-Inception [7] | 6 | 144 | 20.1% | 4.9% |
| Inception-v3 | 4 | 144 | 17.2% | 3.58%∗ |
Table 5: Ensemble evaluation results comparing multi-model, multi-crop reported results. Our numbers are compared with the best published ensemble inference results on the ILSVRC 2012 classification benchmark. ∗All results, but the top-5 ensemble result reported are on the validation set. The ensemble yielded top-5 error on the validation set.
| 网络 | 评估的模型数 | 评估的裁剪数 | Top-1 误差 | Top-5 误差 |
|---|---|---|---|---|
| VGGNet [18] | 2 | - | 23.7% | 6.8% |
| GoogLeNet [20] | 7 | 144 | - | 6.67% |
| PReLU [6] | - | - | - | 4.94% |
| BN-Inception [7] | 6 | 144 | 20.1% | 4.9% |
| Inception-v3 | 4 | 144 | 17.2% | 3.58%∗ |
表 5:集成评估结果,比较已报告的多模型、多裁结果。我们的数字与 ILSVRC 2012 分类基准上已发表的最好集成推断结果相比较。∗除所报告的 top-5 集成结果外,其余结果都在验证集上。该集成在验证集上的 top-5 误差为 。
11 Conclusions
11 结论
We have provided several design principles to scale up convolutional networks and studied them in the context of the Inception architecture. This guidance can lead to high performance vision networks that have a relatively modest computation cost compared to simpler, more monolithic architectures. Our highest quality version of Inception-v3 reaches , top- and top-5 error for single crop evaluation on the ILSVR 2012 classification, setting a new state of the art. This is achieved with relatively modest () increase in computational cost compared to the network described in Ioffe et al [7]. Still our solution uses much less computation than the best published results based on denser networks: our model outperforms the results of He et al [6] – cutting the top- (top-) error by () relative, respectively – while being six times cheaper computationally and using at least five times less parameters (estimated). Our ensemble of four Inception-v3 models reaches with multi-crop evaluation reaches top- error which represents an over reduction to the best published results and is almost half of the error of ILSVRC 2014 winining GoogLeNet ensemble.
我们给出了若干用于放大卷积网络的设计原则,并在 Inception 结构的语境中对它们做了研究。按这些指导,可以做出性能很高、计算代价却相对克制的视觉网络,而不必采用更简单、更铁板一块的结构。我们最高质量的 Inception-v3 版本,在 ILSVRC 2012 分类上做单裁评估时,top- 误差达到 ,top-5 误差达到 ,刷新了当时最好结果。与 Ioffe 等人 [7] 所描述的网络相比,计算量只增加了相对温和的()一截。我们的方案所用计算仍然远少于那些基于更密网络的已发表最好结果:我们的模型超过了 He 等人 [6] 的结果——分别把 top-(top-)误差相对削减了 ()——同时计算量便宜六倍,参数至少少五倍(为估计值)。四个 Inception-v3 模型的集成,在多裁评估下 top- 误差达到 ,相对已发表最好结果降低了超过 ,几乎只有 ILSVRC 2014 获胜的 GoogLeNet 集成误差的一半。
We have also demonstrated that high quality results can be reached with receptive field resolution as low as . This might prove to be helpful in systems for detecting relatively small objects. We have studied how factorizing convolutions and aggressive dimension reductions inside neural network can result in networks with relatively low computational cost while maintaining high quality. The combination of lower parameter count and additional regularization with batch-normalized auxiliary classifiers and label-smoothing allows for training high quality networks on relatively modest sized training sets.
我们还表明,感受野分辨率低到 ,也能达到高质量结果。这对检测较小物体的系统可能会有帮助。我们研究了在神经网络内部分解卷积、并做较强的降维,如何能在保持高质量的同时,得到计算代价相对较低的网络。参数量更少,再配上批归一化的辅助分类器和标签平滑这些额外正则,就使得在规模相对有限的训练集上,也能训出高质量网络。
References
参考文献
[1] M. Abadi, A. Agarwal, P. Barham, E. Brevdo, Z. Chen, C. Citro, G. S. Corrado, A. Davis, J. Dean, M. Devin, S. Ghemawat, I. Goodfellow, A. Harp, G. Irving, M. Isard, Y. Jia, R. Jozefowicz, L. Kaiser, M. Kudlur, J. Levenberg, D. Mané, R. Monga, S. Moore, D. Murray, C. Olah, M. Schuster, J. Shlens, B. Steiner, I. Sutskever, K. Talwar, P. Tucker, V. Vanhoucke, V. Vasudevan, F. Viégas, O. Vinyals, P. Warden, M. Wattenberg, M. Wicke, Y. Yu, and X. Zheng. TensorFlow: Large-scale machine learning on heterogeneous systems, 2015. Software available from tensorflow.org.
[2] W. Chen, J. T. Wilson, S. Tyree, K. Q. Weinberger, and Y. Chen. Compressing neural networks with the hashing trick. In Proceedings of The 32nd International Conference on Machine Learning , 2015.
[3] C. Dong, C. C. Loy, K. He, and X. Tang. Learning a deep convolutional network for image super-resolution. In Computer Vision–ECCV 2014 , pages 184–199. Springer, 2014.
[4] D. Erhan, C. Szegedy, A. Toshev, and D. Anguelov. Scalable object detection using deep neural networks. In Computer Vision and Pattern Recognition (CVPR), 2014 IEEE Conference on , pages 2155–2162. IEEE, 2014.
[5] R. Girshick, J. Donahue, T. Darrell, and J. Malik. Rich feature hierarchies for accurate object detection and semantic segmentation. In Proceedings of the IEEE Conference on Computer Vision and Pattern Recognition (CVPR) , 2014.
[6] K. He, X. Zhang, S. Ren, and J. Sun. Delving deep into rectifiers: Surpassing human-level performance on imagenet classification. arXiv preprint arXiv:1502.01852 , 2015.
[7] S. Ioffe and C. Szegedy. Batch normalization: Accelerating deep network training by reducing internal covariate shift. In Proceedings of The 32nd International Conference on Machine Learning , pages 448–456, 2015.
[8] A. Karpathy, G. Toderici, S. Shetty, T. Leung, R. Sukthankar, and L. Fei-Fei. Large-scale video classification with convolutional neural networks. In Computer Vision and Pattern Recognition (CVPR), 2014 IEEE Conference on , pages 1725–1732. IEEE, 2014.
[9] A. Krizhevsky, I. Sutskever, and G. E. Hinton. Imagenet classification with deep convolutional neural networks. In Advances in neural information processing systems , pages 1097–1105, 2012.
[10] A. Lavin. Fast algorithms for convolutional neural networks. arXiv preprint arXiv:1509.09308 , 2015.
[11] C.-Y. Lee, S. Xie, P. Gallagher, Z. Zhang, and Z. Tu. Deeply-supervised nets. arXiv preprint arXiv:1409.5185 , 2014.
[12] J. Long, E. Shelhamer, and T. Darrell. Fully convolutional networks for semantic segmentation. In Proceedings of the IEEE Conference on Computer Vision and Pattern Recognition , pages 3431–3440, 2015.
[13] Y. Movshovitz-Attias, Q. Yu, M. C. Stumpe, V. Shet, S. Arnoud, and L. Yatziv. Ontological supervision for fine grained classification of street view storefronts. In Proceedings of the IEEE Conference on Computer Vision and Pattern Recognition , pages 1693–1702, 2015.
[14] R. Pascanu, T. Mikolov, and Y. Bengio. On the difficulty of training recurrent neural networks. arXiv preprint arXiv:1211.5063 , 2012.
[15] D. C. Psichogios and L. H. Ungar. Svd-net: an algorithm that automatically selects network structure. IEEE transactions on neural networks/a publication of the IEEE Neural Networks Council , 5(3):513–515, 1993.
[16] O. Russakovsky, J. Deng, H. Su, J. Krause, S. Satheesh, S. Ma, Z. Huang, A. Karpathy, A. Khosla, M. Bernstein, et al. Imagenet large scale visual recognition challenge. 2014.
[17] F. Schroff, D. Kalenichenko, and J. Philbin. Facenet: A unified embedding for face recognition and clustering. arXiv preprint arXiv:1503.03832 , 2015.
[18] K. Simonyan and A. Zisserman. Very deep convolutional networks for large-scale image recognition. arXiv preprint arXiv:1409.1556 , 2014.
[19] I. Sutskever, J. Martens, G. Dahl, and G. Hinton. On the importance of initialization and momentum in deep learning. In Proceedings of the 30th International Conference on Machine Learning (ICML-13) , volume 28, pages 1139–1147. JMLR Workshop and Conference Proceedings, May 2013.
[20] C. Szegedy, W. Liu, Y. Jia, P. Sermanet, S. Reed, D. Anguelov, D. Erhan, V. Vanhoucke, and A. Rabinovich. Going deeper with convolutions. In Proceedings of the IEEE Conference on Computer Vision and Pattern Recognition , pages 1–9, 2015.
[21] T. Tieleman and G. Hinton. Divide the gradient by a running average of its recent magnitude. COURSERA: Neural Networks for Machine Learning, 4, 2012. Accessed: 2015-11-05.
[22] A. Toshev and C. Szegedy. Deeppose: Human pose estimation via deep neural networks. In Computer Vision and Pattern Recognition (CVPR), 2014 IEEE Conference on , pages 1653–1660. IEEE, 2014.
[23] N. Wang and D.-Y. Yeung. Learning a deep compact image representation for visual tracking. In Advances in Neural Information Processing Systems , pages 809–817, 2013.