ImageNet Classification with Deep Convolutional Neural Networks
ImageNet Classification with Deep Convolutional Neural Networks
用深度卷积神经网络进行 ImageNet 图像分类
Abstract
摘要
We trained a large, deep convolutional neural network to classify the 1.2 million high-resolution images in the ImageNet LSVRC-2010 contest into the 1000 different classes. On the test data, we achieved top-1 and top-5 error rates of 37.5% and 17.0% which is considerably better than the previous state-of-the-art. The neural network, which has 60 million parameters and 650,000 neurons, consists of five convolutional layers, some of which are followed by max-pooling layers, and three fully-connected layers with a final 1000-way softmax. To make training faster, we used non-saturating neurons and a very efficient GPU implementation of the convolution operation. To reduce overfitting in the fully-connected layers we employed a recently-developed regularization method called “dropout” that proved to be very effective. We also entered a variant of this model in the ILSVRC-2012 competition and achieved a winning top-5 test error rate of 15.3%, compared to 26.2% achieved by the second-best entry.
我们训练了一个大型深度卷积神经网络,把 ImageNet LSVRC-2010 竞赛中的 120 万张高分辨率图像分到 1000 个类别。在测试数据上,我们取得了 37.5% 的 top-1 错误率和 17.0% 的 top-5 错误率,明显优于此前的最好水平。这个神经网络有 6000 万个参数和 65 万个神经元,由五个卷积层(其中一部分后面接最大池化层)和三个全连接层组成,最后是一个 1000 路的 softmax。为了加快训练,我们使用了非饱和神经元,以及一个非常高效的卷积运算 GPU 实现。为了减少全连接层中的过拟合,我们采用了一种新近提出、并被证明非常有效的正则化方法“dropout”。我们还用这个模型的一个变体参加了 ILSVRC-2012 竞赛,以 15.3% 的 top-5 测试错误率获胜,第二名的错误率是 26.2%。
1 Introduction
1 引言
Current approaches to object recognition make essential use of machine learning methods. To improve their performance, we can collect larger datasets, learn more powerful models, and use better techniques for preventing overfitting. Until recently, datasets of labeled images were relatively small — on the order of tens of thousands of images (e.g., NORB [16], Caltech-101/256 [8, 9], and CIFAR-10/100 [12]). Simple recognition tasks can be solved quite well with datasets of this size, especially if they are augmented with label-preserving transformations. For example, the current-best error rate on the MNIST digit-recognition task (<0.3%) approaches human performance [4]. But objects in realistic settings exhibit considerable variability, so to learn to recognize them it is necessary to use much larger training sets. And indeed, the shortcomings of small image datasets have been widely recognized (e.g., Pinto et al. [21]), but it has only recently become possible to collect labeled datasets with millions of images. The new larger datasets include LabelMe [23], which consists of hundreds of thousands of fully-segmented images, and ImageNet [6], which consists of over 15 million labeled high-resolution images in over 22,000 categories.
当前的物体识别方法离不开机器学习。要提高识别效果,可以收集更大的数据集、学习更强的模型,并使用更好的防过拟合技术。直到不久前,带标注的图像数据集都还比较小,只有几万张图像的量级(例如 NORB [16]、Caltech-101/256 [8, 9] 和 CIFAR-10/100 [12])。这种规模的数据集足以较好地解决简单的识别任务,尤其是在用保持标签不变的变换做了扩充之后。例如,MNIST 手写数字识别任务目前的最好错误率(<0.3%)已经接近人类水平 [4]。但真实场景中的物体变化很大,要学会识别它们,必须使用大得多的训练集。小型图像数据集的不足早已得到广泛认识(例如 Pinto 等人 [21]),但直到最近才有可能收集到数百万张带标注图像的数据集。新的大型数据集包括 LabelMe [23],它有几十万张完整分割的图像;以及 ImageNet [6],它有超过 1500 万张带标注的高分辨率图像,覆盖 22,000 多个类别。
To learn about thousands of objects from millions of images, we need a model with a large learning capacity. However, the immense complexity of the object recognition task means that this problem cannot be specified even by a dataset as large as ImageNet, so our model should also have lots of prior knowledge to compensate for all the data we don’t have. Convolutional neural networks (CNNs) constitute one such class of models [16, 11, 13, 18, 15, 22, 26]. Their capacity can be controlled by varying their depth and breadth, and they also make strong and mostly correct assumptions about the nature of images (namely, stationarity of statistics and locality of pixel dependencies). Thus, compared to standard feedforward neural networks with similarly-sized layers, CNNs have much fewer connections and parameters and so they are easier to train, while their theoretically-best performance is likely to be only slightly worse.
要从数百万张图像中学会认识数千种物体,需要一个学习容量很大的模型。然而,物体识别任务极其复杂,即使是 ImageNet 这样大的数据集也不足以完全刻画这个问题,因此模型还应具备大量先验知识,用来弥补我们没有的那些数据。卷积神经网络(CNN)就是这样一类模型 [16, 11, 13, 18, 15, 22, 26]。它的容量可以通过改变深度和宽度来控制,同时它对图像的性质做了强而且大体正确的假设(即统计特性的平稳性和像素依赖的局部性)。因此,与层规模相近的标准前馈神经网络相比,CNN 的连接和参数少得多,因而更容易训练,而它在理论上的最佳性能可能只略差一点。
Despite the attractive qualities of CNNs, and despite the relative efficiency of their local architecture, they have still been prohibitively expensive to apply in large scale to high-resolution images. Luckily, current GPUs, paired with a highly-optimized implementation of 2D convolution, are powerful enough to facilitate the training of interestingly-large CNNs, and recent datasets such as ImageNet contain enough labeled examples to train such models without severe overfitting.
尽管 CNN 有这些吸引人的特点,局部结构也相对高效,但要把它大规模地用在高分辨率图像上,成本仍然高得难以承受。幸运的是,当前的 GPU 配合高度优化的二维卷积实现,算力已足以训练规模可观的 CNN;而 ImageNet 这类新数据集也有足够多的标注样本,可以训练这样的模型而不出现严重过拟合。
The specific contributions of this paper are as follows: we trained one of the largest convolutional neural networks to date on the subsets of ImageNet used in the ILSVRC-2010 and ILSVRC-2012 competitions [2] and achieved by far the best results ever reported on these datasets. We wrote a highly-optimized GPU implementation of 2D convolution and all the other operations inherent in training convolutional neural networks, which we make available publicly¹. Our network contains a number of new and unusual features which improve its performance and reduce its training time, which are detailed in Section 3. The size of our network made overfitting a significant problem, even with 1.2 million labeled training examples, so we used several effective techniques for preventing overfitting, which are described in Section 4. Our final network contains five convolutional and three fully-connected layers, and this depth seems to be important: we found that removing any convolutional layer (each of which contains no more than 1% of the model’s parameters) resulted in inferior performance.
本文的具体贡献如下:我们在 ILSVRC-2010 和 ILSVRC-2012 竞赛所用的 ImageNet 子集 [2] 上,训练了迄今规模最大的卷积神经网络之一,取得了这些数据集上迄今报告过的最好结果,而且领先幅度很大。我们编写了一个高度优化的 GPU 实现,涵盖二维卷积以及训练卷积神经网络所需的其他全部运算,并已公开发布¹。我们的网络包含一些新的、不常见的特性,它们提升了性能、缩短了训练时间,详见第 3 节。网络规模很大,即使有 120 万个带标注的训练样本,过拟合仍是一个严重问题,因此我们使用了几种有效的防过拟合技术,见第 4 节。最终的网络包含五个卷积层和三个全连接层,这个深度似乎很重要:我们发现,去掉任何一个卷积层(每层所含参数都不超过模型参数的 1%)都会让性能变差。
In the end, the network’s size is limited mainly by the amount of memory available on current GPUs and by the amount of training time that we are willing to tolerate. Our network takes between five and six days to train on two GTX 580 3GB GPUs. All of our experiments suggest that our results can be improved simply by waiting for faster GPUs and bigger datasets to become available.
归根到底,网络的规模主要受限于当前 GPU 的显存大小,以及我们愿意接受的训练时间。我们的网络在两块 3GB 显存的 GTX 580 GPU 上需要训练五到六天。我们的所有实验都表明,只要等到更快的 GPU 和更大的数据集出现,结果就能进一步提升。
2 The Dataset
2 数据集
ImageNet is a dataset of over 15 million labeled high-resolution images belonging to roughly 22,000 categories. The images were collected from the web and labeled by human labelers using Amazon’s Mechanical Turk crowd-sourcing tool. Starting in 2010, as part of the Pascal Visual Object Challenge, an annual competition called the ImageNet Large-Scale Visual Recognition Challenge (ILSVRC) has been held. ILSVRC uses a subset of ImageNet with roughly 1000 images in each of 1000 categories. In all, there are roughly 1.2 million training images, 50,000 validation images, and 150,000 testing images.
ImageNet 是一个包含 1500 多万张带标注高分辨率图像的数据集,图像约分属 22,000 个类别。这些图像从网上收集,由人工标注员通过亚马逊的 Mechanical Turk 众包工具标注。从 2010 年起,作为 Pascal 视觉物体挑战赛的一部分,每年举办一次名为 ImageNet 大规模视觉识别挑战赛(ILSVRC)的比赛。ILSVRC 使用 ImageNet 的一个子集,共 1000 个类别,每类约 1000 张图像。总计约有 120 万张训练图像、5 万张验证图像和 15 万张测试图像。
ILSVRC-2010 is the only version of ILSVRC for which the test set labels are available, so this is the version on which we performed most of our experiments. Since we also entered our model in the ILSVRC-2012 competition, in Section 6 we report our results on this version of the dataset as well, for which test set labels are unavailable. On ImageNet, it is customary to report two error rates: top-1 and top-5, where the top-5 error rate is the fraction of test images for which the correct label is not among the five labels considered most probable by the model.
ILSVRC-2010 是唯一公开了测试集标签的 ILSVRC 版本,所以我们的大部分实验都在这个版本上进行。由于我们也用模型参加了 ILSVRC-2012 竞赛,第 6 节还会报告我们在这一版本数据集上的结果,该版本的测试集标签未公开。在 ImageNet 上,通常报告 top-1 和 top-5 两种错误率;top-5 错误率指的是:正确标签不在模型认为最可能的五个标签之中的测试图像所占的比例。
ImageNet consists of variable-resolution images, while our system requires a constant input dimensionality. Therefore, we down-sampled the images to a fixed resolution of 256 × 256. Given a rectangular image, we first rescaled the image such that the shorter side was of length 256, and then cropped out the central 256×256 patch from the resulting image. We did not pre-process the images in any other way, except for subtracting the mean activity over the training set from each pixel. So we trained our network on the (centered) raw RGB values of the pixels.
ImageNet 中的图像分辨率不一,而我们的系统要求输入维度固定。因此,我们把图像下采样到 256 × 256 的固定分辨率。对于一张矩形图像,我们先缩放使其短边为 256,再从缩放后的图像中裁出中央的 256×256 区域。除了从每个像素中减去训练集上的平均活动值之外,我们没有对图像做任何其他预处理。也就是说,我们是在像素的(中心化后的)原始 RGB 值上训练网络的。
3 The Architecture
3 网络架构
The architecture of our network is summarized in Figure 2. It contains eight learned layers — five convolutional and three fully-connected. Below, we describe some of the novel or unusual features of our network’s architecture. Sections 3.1-3.4 are sorted according to our estimation of their importance, with the most important first.
我们的网络架构概括在图 2 中。它包含八个需要学习的层:五个卷积层和三个全连接层。下面介绍网络架构中一些新颖或不常见的特性。第 3.1–3.4 节按我们估计的重要性排序,最重要的排在最前面。
3.1 ReLU Nonlinearity
3.1 ReLU 非线性
The standard way to model a neuron’s output as a function of its input is with or . In terms of training time with gradient descent, these saturating nonlinearities are much slower than the non-saturating nonlinearity . Following Nair and Hinton [20], we refer to neurons with this nonlinearity as Rectified Linear Units (ReLUs). Deep convolutional neural networks with ReLUs train several times faster than their equivalents with tanh units. This is demonstrated in Figure 1, which shows the number of iterations required to reach 25% training error on the CIFAR-10 dataset for a particular four-layer convolutional network. This plot shows that we would not have been able to experiment with such large neural networks for this work if we had used traditional saturating neuron models.
把神经元输出 建模为输入 的函数,标准做法是 或 。就梯度下降的训练时间而言,这些饱和非线性比非饱和非线性 慢得多。沿用 Nair 和 Hinton [20] 的说法,我们把采用这种非线性的神经元称为修正线性单元(Rectified Linear Unit,ReLU)。使用 ReLU 的深度卷积神经网络,训练速度是使用 tanh 单元的同等网络的数倍。图 1 展示了这一点:对某个四层卷积网络,图中给出了在 CIFAR-10 数据集上达到 25% 训练误差所需的迭代次数。这张图说明,如果使用传统的饱和神经元模型,我们就无法在这项工作中尝试如此大的神经网络。
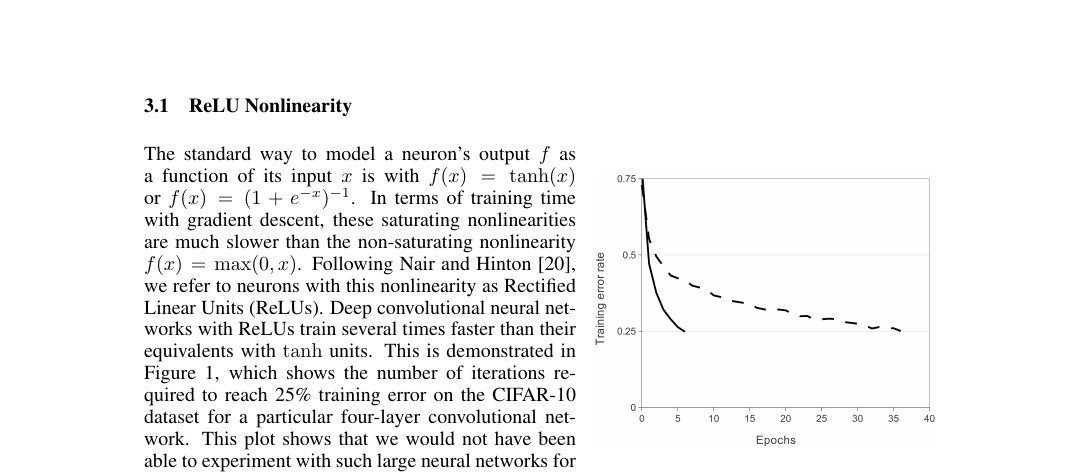
Figure 1: A four-layer convolutional neural network with ReLUs (solid line) reaches a 25% training error rate on CIFAR-10 six times faster than an equivalent network with tanh neurons (dashed line). The learning rates for each network were chosen independently to make training as fast as possible. No regularization of any kind was employed. The magnitude of the effect demonstrated here varies with network architecture, but networks with ReLUs consistently learn several times faster than equivalents with saturating neurons.
图 1:使用 ReLU 的四层卷积神经网络(实线)在 CIFAR-10 上达到 25% 训练错误率的速度,是使用 tanh 神经元的同等网络(虚线)的六倍。两个网络的学习率各自独立选取,以使训练尽可能快。没有使用任何形式的正则化。这里展示的效应大小随网络架构而变,但使用 ReLU 的网络始终比使用饱和神经元的同等网络学得快数倍。
We are not the first to consider alternatives to traditional neuron models in CNNs. For example, Jarrett et al. [11] claim that the nonlinearity works particularly well with their type of contrast normalization followed by local average pooling on the Caltech-101 dataset. However, on this dataset the primary concern is preventing overfitting, so the effect they are observing is different from the accelerated ability to fit the training set which we report when using ReLUs. Faster learning has a great influence on the performance of large models trained on large datasets.
我们并不是第一个在 CNN 中考虑替代传统神经元模型的人。例如,Jarrett 等人 [11] 称,在 Caltech-101 数据集上,非线性 与他们那种先做对比度归一化、再做局部平均池化的方式配合得特别好。不过,在这个数据集上首要问题是防止过拟合,所以他们观察到的效应,与我们使用 ReLU 时报告的“更快拟合训练集”的能力并不相同。对于在大数据集上训练的大模型来说,学得更快对性能影响很大。
3.2 Training on Multiple GPUs
3.2 在多块 GPU 上训练
A single GTX 580 GPU has only 3GB of memory, which limits the maximum size of the networks that can be trained on it. It turns out that 1.2 million training examples are enough to train networks which are too big to fit on one GPU. Therefore we spread the net across two GPUs. Current GPUs are particularly well-suited to cross-GPU parallelization, as they are able to read from and write to one another’s memory directly, without going through host machine memory. The parallelization scheme that we employ essentially puts half of the kernels (or neurons) on each GPU, with one additional trick: the GPUs communicate only in certain layers. This means that, for example, the kernels of layer 3 take input from all kernel maps in layer 2. However, kernels in layer 4 take input only from those kernel maps in layer 3 which reside on the same GPU. Choosing the pattern of connectivity is a problem for cross-validation, but this allows us to precisely tune the amount of communication until it is an acceptable fraction of the amount of computation.
单块 GTX 580 GPU 只有 3GB 显存,这限制了能在它上面训练的网络的最大规模。事实证明,120 万个训练样本足以训练一块 GPU 装不下的网络。因此,我们把网络分布到两块 GPU 上。当前的 GPU 特别适合跨 GPU 并行,因为它们可以直接读写彼此的显存,无需经过主机内存。我们采用的并行方案,基本上是在每块 GPU 上放一半的卷积核(或神经元),外加一个技巧:GPU 只在某些层之间通信。比如,第 3 层的卷积核接收第 2 层全部特征图的输入;而第 4 层的卷积核只接收第 3 层中位于同一块 GPU 上的那些特征图的输入。连接模式的选择需要通过交叉验证来定,但这样一来,我们可以精确调节通信量,直到它在计算量中只占可以接受的比例。
The resultant architecture is somewhat similar to that of the “columnar” CNN employed by Cireşan et al. [5], except that our columns are not independent (see Figure 2). This scheme reduces our top-1 and top-5 error rates by 1.7% and 1.2%, respectively, as compared with a net with half as many kernels in each convolutional layer trained on one GPU. The two-GPU net takes slightly less time to train than the one-GPU net².
由此得到的架构与 Cireşan 等人 [5] 使用的“柱状”CNN 有些相似,区别在于我们的各柱并不独立(见图 2)。与在一块 GPU 上训练、每个卷积层卷积核数量减半的网络相比,这一方案把 top-1 和 top-5 错误率分别降低了 1.7% 和 1.2%。双 GPU 网络的训练时间也比单 GPU 网络略短²。
² The one-GPU net actually has the same number of kernels as the two-GPU net in the final convolutional layer. This is because most of the net’s parameters are in the first fully-connected layer, which takes the last convolutional layer as input. So to make the two nets have approximately the same number of parameters, we did not halve the size of the final convolutional layer (nor the fully-conneced layers which follow). Therefore this comparison is biased in favor of the one-GPU net, since it is bigger than “half the size” of the two-GPU net.
² 在最后一个卷积层中,单 GPU 网络的卷积核数量实际上与双 GPU 网络相同。这是因为网络的大部分参数都在第一个全连接层中,而该层以最后一个卷积层为输入。为了让两个网络的参数量大致相当,我们没有把最后一个卷积层(以及其后的全连接层)的规模减半。因此,这个比较对单 GPU 网络是有利的,因为它比双 GPU 网络的“一半大小”要大。
3.3 Local Response Normalization
3.3 局部响应归一化
ReLUs have the desirable property that they do not require input normalization to prevent them from saturating. If at least some training examples produce a positive input to a ReLU, learning will happen in that neuron. However, we still find that the following local normalization scheme aids generalization. Denoting by the activity of a neuron computed by applying kernel at position and then applying the ReLU nonlinearity, the response-normalized activity is given by the expression
ReLU 有一个很好的性质:不需要对输入做归一化来防止饱和。只要有一部分训练样本给 ReLU 提供正输入,这个神经元就会发生学习。不过我们发现,下面这种局部归一化方案仍然有助于泛化。记 为在位置 应用第 个卷积核、再经过 ReLU 非线性后得到的神经元活动值,则经过响应归一化的活动值 由下式给出
where the sum runs over “adjacent” kernel maps at the same spatial position, and is the total number of kernels in the layer. The ordering of the kernel maps is of course arbitrary and determined before training begins. This sort of response normalization implements a form of lateral inhibition inspired by the type found in real neurons, creating competition for big activities amongst neuron outputs computed using different kernels. The constants , , , and are hyper-parameters whose values are determined using a validation set; we used , , , and . We applied this normalization after applying the ReLU nonlinearity in certain layers (see Section 3.5).
其中求和遍历同一空间位置上 个“相邻”的特征图, 是该层卷积核的总数。特征图的排列顺序当然是任意的,在训练开始前就已确定。这种响应归一化实现了一种侧抑制,灵感来自真实神经元中的侧抑制,让不同卷积核算出的神经元输出之间竞争较大的活动值。常数 、、 和 是超参数,取值由验证集确定;我们使用 、、、。我们在某些层中先应用 ReLU 非线性,再应用这种归一化(见第 3.5 节)。
This scheme bears some resemblance to the local contrast normalization scheme of Jarrett et al. [11], but ours would be more correctly termed “brightness normalization”, since we do not subtract the mean activity. Response normalization reduces our top-1 and top-5 error rates by 1.4% and 1.2%, respectively. We also verified the effectiveness of this scheme on the CIFAR-10 dataset: a four-layer CNN achieved a 13% test error rate without normalization and 11% with normalization³.
这一方案与 Jarrett 等人 [11] 的局部对比度归一化有些相似,但我们的方案更准确的名称应该是“亮度归一化”,因为我们没有减去平均活动值。响应归一化把我们的 top-1 和 top-5 错误率分别降低了 1.4% 和 1.2%。我们还在 CIFAR-10 数据集上验证了这一方案的效果:一个四层 CNN 不加归一化时测试错误率为 13%,加了归一化后为 11%³。
³ We cannot describe this network in detail due to space constraints, but it is specified precisely by the code and parameter files provided here: http://code.google.com/p/cuda-convnet/.
³ 由于篇幅所限,我们无法详细描述这个网络,但这里提供的代码和参数文件对它有精确的规定:http://code.google.com/p/cuda-convnet/。
3.4 Overlapping Pooling
3.4 重叠池化
Pooling layers in CNNs summarize the outputs of neighboring groups of neurons in the same kernel map. Traditionally, the neighborhoods summarized by adjacent pooling units do not overlap (e.g., [17, 11, 4]). To be more precise, a pooling layer can be thought of as consisting of a grid of pooling units spaced pixels apart, each summarizing a neighborhood of size centered at the location of the pooling unit. If we set , we obtain traditional local pooling as commonly employed in CNNs. If we set , we obtain overlapping pooling. This is what we use throughout our network, with and . This scheme reduces the top-1 and top-5 error rates by 0.4% and 0.3%, respectively, as compared with the non-overlapping scheme , which produces output of equivalent dimensions. We generally observe during training that models with overlapping pooling find it slightly more difficult to overfit.
CNN 中的池化层对同一特征图中相邻神经元组的输出做汇总。传统上,相邻池化单元汇总的邻域互不重叠(例如 [17, 11, 4])。更准确地说,可以把池化层看成一个由池化单元组成的网格,单元之间相隔 个像素,每个单元汇总以自身位置为中心、大小为 的邻域。如果设 ,就得到 CNN 中常用的传统局部池化;如果设 ,就得到重叠池化。我们在整个网络中都使用重叠池化,取 、。与输出维度相同的非重叠方案 相比,这一方案把 top-1 和 top-5 错误率分别降低了 0.4% 和 0.3%。我们在训练中普遍观察到,使用重叠池化的模型稍微更难过拟合。
3.5 Overall Architecture
3.5 整体架构
Now we are ready to describe the overall architecture of our CNN. As depicted in Figure 2, the net contains eight layers with weights; the first five are convolutional and the remaining three are fully-connected. The output of the last fully-connected layer is fed to a 1000-way softmax which produces a distribution over the 1000 class labels. Our network maximizes the multinomial logistic regression objective, which is equivalent to maximizing the average across training cases of the log-probability of the correct label under the prediction distribution.
现在可以描述我们这个 CNN 的整体架构了。如图 2 所示,网络包含八个带权重的层:前五个是卷积层,其余三个是全连接层。最后一个全连接层的输出送入一个 1000 路 softmax,得到 1000 个类别标签上的分布。网络最大化多项逻辑回归目标,这等价于在所有训练样本上,最大化预测分布下正确标签对数概率的平均值。
The kernels of the second, fourth, and fifth convolutional layers are connected only to those kernel maps in the previous layer which reside on the same GPU (see Figure 2). The kernels of the third convolutional layer are connected to all kernel maps in the second layer. The neurons in the fully-connected layers are connected to all neurons in the previous layer. Response-normalization layers follow the first and second convolutional layers. Max-pooling layers, of the kind described in Section 3.4, follow both response-normalization layers as well as the fifth convolutional layer. The ReLU non-linearity is applied to the output of every convolutional and fully-connected layer.
第二、第四和第五卷积层的卷积核只与上一层中位于同一块 GPU 上的特征图相连(见图 2)。第三卷积层的卷积核与第二层的全部特征图相连。全连接层中的神经元与上一层的全部神经元相连。第一和第二卷积层之后各接一个响应归一化层。第 3.4 节所述的最大池化层,接在这两个响应归一化层之后,以及第五卷积层之后。每个卷积层和全连接层的输出都经过 ReLU 非线性。
The first convolutional layer filters the 224 × 224 × 3 input image with 96 kernels of size 11 × 11 × 3 with a stride of 4 pixels (this is the distance between the receptive field centers of neighboring neurons in a kernel map). The second convolutional layer takes as input the (response-normalized and pooled) output of the first convolutional layer and filters it with 256 kernels of size 5 × 5 × 48. The third, fourth, and fifth convolutional layers are connected to one another without any intervening pooling or normalization layers. The third convolutional layer has 384 kernels of size 3 × 3 × 256 connected to the (normalized, pooled) outputs of the second convolutional layer. The fourth convolutional layer has 384 kernels of size 3 × 3 × 192, and the fifth convolutional layer has 256 kernels of size 3 × 3 × 192. The fully-connected layers have 4096 neurons each.
第一卷积层用 96 个大小为 11 × 11 × 3 的卷积核,以 4 个像素的步长(即特征图中相邻神经元感受野中心之间的距离)对 224 × 224 × 3 的输入图像做滤波。第二卷积层以第一卷积层(经过响应归一化和池化的)输出为输入,用 256 个大小为 5 × 5 × 48 的卷积核做滤波。第三、第四和第五卷积层直接相连,中间没有池化层或归一化层。第三卷积层有 384 个大小为 3 × 3 × 256 的卷积核,与第二卷积层(经过归一化和池化的)输出相连。第四卷积层有 384 个大小为 3 × 3 × 192 的卷积核,第五卷积层有 256 个大小为 3 × 3 × 192 的卷积核。每个全连接层有 4096 个神经元。
Figure 2: An illustration of the architecture of our CNN, explicitly showing the delineation of responsibilities between the two GPUs. One GPU runs the layer-parts at the top of the figure while the other runs the layer-parts at the bottom. The GPUs communicate only at certain layers. The network’s input is 150,528-dimensional, and the number of neurons in the network’s remaining layers is given by 253,440–186,624–64,896–64,896–43,264–4096–4096–1000.
图 2:我们的 CNN 架构示意图,明确画出了两块 GPU 之间的分工。一块 GPU 运行图中上半部分的各层,另一块运行下半部分的各层。两块 GPU 只在某些层之间通信。网络输入为 150,528 维,其余各层的神经元数依次为 253,440–186,624–64,896–64,896–43,264–4096–4096–1000。
4 Reducing Overfitting
4 减少过拟合
Our neural network architecture has 60 million parameters. Although the 1000 classes of ILSVRC make each training example impose 10 bits of constraint on the mapping from image to label, this turns out to be insufficient to learn so many parameters without considerable overfitting. Below, we describe the two primary ways in which we combat overfitting.
我们的神经网络架构有 6000 万个参数。虽然 ILSVRC 的 1000 个类别让每个训练样本都对“图像到标签”的映射施加 10 比特的约束,但事实证明,这不足以在不严重过拟合的情况下学习这么多参数。下面介绍我们对抗过拟合的两种主要方法。
4.1 Data Augmentation
4.1 数据增强
The easiest and most common method to reduce overfitting on image data is to artificially enlarge the dataset using label-preserving transformations (e.g., [25, 4, 5]). We employ two distinct forms of data augmentation, both of which allow transformed images to be produced from the original images with very little computation, so the transformed images do not need to be stored on disk. In our implementation, the transformed images are generated in Python code on the CPU while the GPU is training on the previous batch of images. So these data augmentation schemes are, in effect, computationally free.
对图像数据来说,减少过拟合最简单也最常用的方法,是用保持标签不变的变换人为扩大数据集(例如 [25, 4, 5])。我们采用两种不同的数据增强方式,它们都只需很少的计算就能从原图生成变换后的图像,所以变换后的图像不需要存到磁盘上。在我们的实现中,GPU 训练上一批图像的同时,CPU 上的 Python 代码生成变换后的图像。因此,这些数据增强方案实际上不占用计算开销。
The first form of data augmentation consists of generating image translations and horizontal reflections. We do this by extracting random 224 × 224 patches (and their horizontal reflections) from the 256×256 images and training our network on these extracted patches⁴. This increases the size of our training set by a factor of 2048, though the resulting training examples are, of course, highly interdependent. Without this scheme, our network suffers from substantial overfitting, which would have forced us to use much smaller networks. At test time, the network makes a prediction by extracting five 224 × 224 patches (the four corner patches and the center patch) as well as their horizontal reflections (hence ten patches in all), and averaging the predictions made by the network’s softmax layer on the ten patches.
第一种数据增强是生成图像的平移和水平翻转。具体做法是从 256×256 的图像中随机提取 224 × 224 的图块(及其水平翻转),用这些图块训练网络⁴。这让训练集规模扩大了 2048 倍,当然,由此得到的训练样本高度相关。没有这个方案,我们的网络会严重过拟合,迫使我们改用小得多的网络。测试时,网络提取五个 224 × 224 的图块(四个角和中心)及其水平翻转(共十个图块),对网络 softmax 层在这十个图块上的预测取平均,作为最终预测。
⁴ This is the reason why the input images in Figure 2 are 224 × 224 × 3-dimensional.
⁴ 这就是图 2 中输入图像为 224 × 224 × 3 维的原因。
The second form of data augmentation consists of altering the intensities of the RGB channels in training images. Specifically, we perform PCA on the set of RGB pixel values throughout the ImageNet training set. To each training image, we add multiples of the found principal components, with magnitudes proportional to the corresponding eigenvalues times a random variable drawn from a Gaussian with mean zero and standard deviation 0.1. Therefore to each RGB image pixel we add the following quantity:
第二种数据增强是改变训练图像中 RGB 通道的强度。具体来说,我们对整个 ImageNet 训练集的 RGB 像素值做主成分分析(PCA)。对每张训练图像,加上所求主成分的若干倍,倍数的大小与对应特征值成正比,再乘以一个从均值为零、标准差为 0.1 的高斯分布中抽取的随机变量。因此,对每个 RGB 图像像素 ,我们加上如下的量:
where and are th eigenvector and eigenvalue of the 3 × 3 covariance matrix of RGB pixel values, respectively, and is the aforementioned random variable. Each is drawn only once for all the pixels of a particular training image until that image is used for training again, at which point it is re-drawn. This scheme approximately captures an important property of natural images, namely, that object identity is invariant to changes in the intensity and color of the illumination. This scheme reduces the top-1 error rate by over 1%.
其中 和 分别是 RGB 像素值 3 × 3 协方差矩阵的第 个特征向量和特征值, 是上面提到的随机变量。对某张训练图像的所有像素,每个 只抽取一次,直到这张图像再次用于训练时才重新抽取。这一方案近似地刻画了自然图像的一个重要性质:物体的身份不随光照强度和颜色的变化而改变。这一方案让 top-1 错误率降低了 1% 以上。
4.2 Dropout
Combining the predictions of many different models is a very successful way to reduce test errors [1, 3], but it appears to be too expensive for big neural networks that already take several days to train. There is, however, a very efficient version of model combination that only costs about a factor of two during training. The recently-introduced technique, called “dropout” [10], consists of setting to zero the output of each hidden neuron with probability 0.5. The neurons which are “dropped out” in this way do not contribute to the forward pass and do not participate in backpropagation. So every time an input is presented, the neural network samples a different architecture, but all these architectures share weights. This technique reduces complex co-adaptations of neurons, since a neuron cannot rely on the presence of particular other neurons. It is, therefore, forced to learn more robust features that are useful in conjunction with many different random subsets of the other neurons. At test time, we use all the neurons but multiply their outputs by 0.5, which is a reasonable approximation to taking the geometric mean of the predictive distributions produced by the exponentially-many dropout networks.
组合多个不同模型的预测是降低测试误差的一种非常成功的方法 [1, 3],但对本来就要训练好几天的大型神经网络来说,代价似乎太高。不过,模型组合有一种非常高效的形式,训练时只需付出约两倍的代价。这项新近提出的技术叫“dropout”[10],做法是以 0.5 的概率把每个隐藏神经元的输出置零。以这种方式被“丢弃”的神经元不参与前向传播,也不参与反向传播。所以每输入一次样本,神经网络就采样出一个不同的架构,而这些架构共享权重。这项技术减少了神经元之间复杂的协同适应,因为一个神经元不能依赖其他特定神经元的存在。于是它被迫学习更稳健的特征,这些特征要能与其他神经元的许多不同随机子集配合使用。测试时,我们使用全部神经元,但把它们的输出乘以 0.5,这可以合理地近似对指数多个 dropout 网络的预测分布取几何平均。
We use dropout in the first two fully-connected layers of Figure 2. Without dropout, our network exhibits substantial overfitting. Dropout roughly doubles the number of iterations required to converge.
我们在图 2 的前两个全连接层中使用 dropout。不用 dropout 时,我们的网络会严重过拟合。dropout 让收敛所需的迭代次数大约翻了一倍。
5 Details of learning
5 学习细节
We trained our models using stochastic gradient descent with a batch size of 128 examples, momentum of 0.9, and weight decay of 0.0005. We found that this small amount of weight decay was important for the model to learn. In other words, weight decay here is not merely a regularizer: it reduces the model’s training error. The update rule for weight was
我们用随机梯度下降训练模型,批大小为 128 个样本,动量为 0.9,权重衰减为 0.0005。我们发现,这一点点权重衰减对模型的学习很重要。换句话说,这里的权重衰减不仅仅是正则项:它降低了模型的训练误差。权重 的更新规则为
where is the iteration index, is the momentum variable, is the learning rate, and is the average over the th batch of the derivative of the objective with respect to , evaluated at .
其中 是迭代序号, 是动量变量, 是学习率, 是目标函数对 的导数在 处的取值在第 个批次 上的平均。
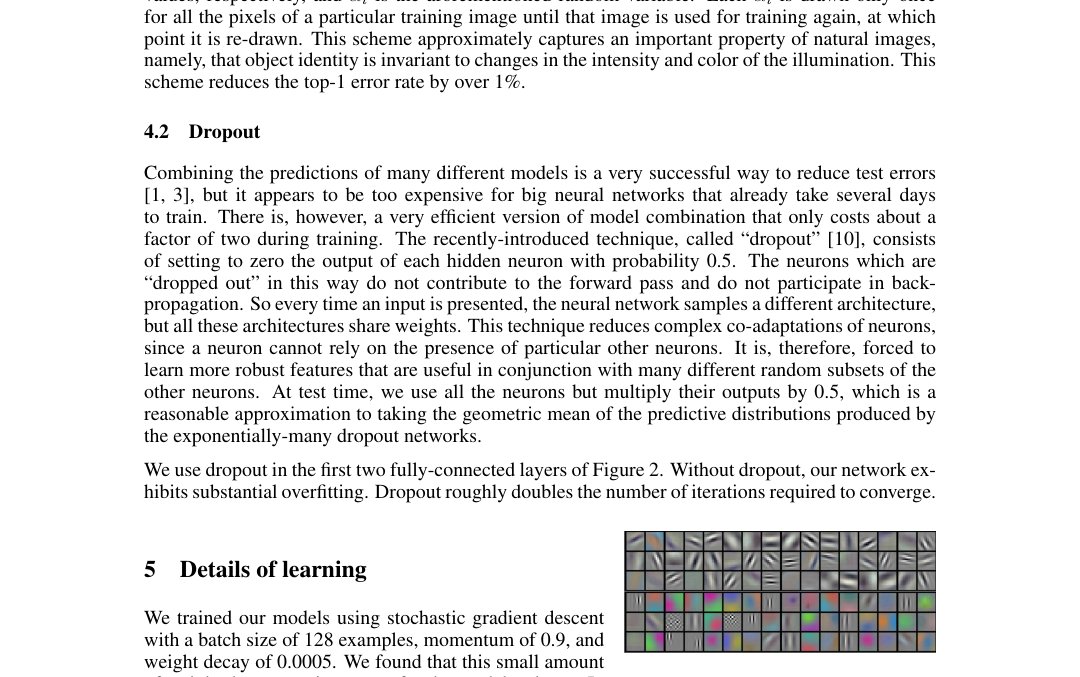
Figure 3: 96 convolutional kernels of size 11×11×3 learned by the first convolutional layer on the 224×224×3 input images. The top 48 kernels were learned on GPU 1 while the bottom 48 kernels were learned on GPU 2. See Section 6.1 for details.
图 3:第一卷积层在 224×224×3 输入图像上学到的 96 个大小为 11×11×3 的卷积核。上面 48 个卷积核在 GPU 1 上学得,下面 48 个在 GPU 2 上学得。详见第 6.1 节。
We initialized the weights in each layer from a zero-mean Gaussian distribution with standard deviation 0.01. We initialized the neuron biases in the second, fourth, and fifth convolutional layers, as well as in the fully-connected hidden layers, with the constant 1. This initialization accelerates the early stages of learning by providing the ReLUs with positive inputs. We initialized the neuron biases in the remaining layers with the constant 0.
我们从均值为零、标准差为 0.01 的高斯分布中初始化每一层的权重。第二、第四和第五卷积层以及全连接隐藏层的神经元偏置初始化为常数 1。这种初始化给 ReLU 提供正输入,从而加快学习的早期阶段。其余各层的神经元偏置初始化为常数 0。
We used an equal learning rate for all layers, which we adjusted manually throughout training. The heuristic which we followed was to divide the learning rate by 10 when the validation error rate stopped improving with the current learning rate. The learning rate was initialized at 0.01 and reduced three times prior to termination. We trained the network for roughly 90 cycles through the training set of 1.2 million images, which took five to six days on two NVIDIA GTX 580 3GB GPUs.
所有层使用相同的学习率,并在整个训练过程中手动调整。我们遵循的经验规则是:当验证错误率在当前学习率下不再改善时,把学习率除以 10。学习率初始为 0.01,在训练结束前共降低了三次。我们在 120 万张图像的训练集上把网络训练了约 90 轮,在两块 3GB 显存的 NVIDIA GTX 580 GPU 上用了五到六天。
6 Results
6 结果
Our results on ILSVRC-2010 are summarized in Table 1. Our network achieves top-1 and top-5 test set error rates of 37.5% and 17.0%⁵. The best performance achieved during the ILSVRC-2010 competition was 47.1% and 28.2% with an approach that averages the predictions produced from six sparse-coding models trained on different features [2], and since then the best published results are 45.7% and 25.7% with an approach that averages the predictions of two classifiers trained on Fisher Vectors (FVs) computed from two types of densely-sampled features [24].
我们在 ILSVRC-2010 上的结果汇总在表 1 中。我们的网络在测试集上的 top-1 和 top-5 错误率为 37.5% 和 17.0%⁵。ILSVRC-2010 竞赛期间的最好成绩是 47.1% 和 28.2%,所用方法对六个基于不同特征训练的稀疏编码模型的预测取平均 [2];此后公开发表的最好结果是 45.7% 和 25.7%,所用方法对两个分类器的预测取平均,这两个分类器基于由两类密集采样特征计算出的 Fisher 向量(FV)训练 [24]。
| Model | Top-1 | Top-5 |
|---|---|---|
| Sparse coding [2] | 47.1% | 28.2% |
| SIFT + FVs [24] | 45.7% | 25.7% |
| CNN | 37.5% | 17.0% |
Table 1: Comparison of results on ILSVRC-2010 test set. In italics are best results achieved by others.
| 模型 | Top-1 | Top-5 |
|---|---|---|
| 稀疏编码 [2] | 47.1% | 28.2% |
| SIFT + FVs [24] | 45.7% | 25.7% |
| CNN | 37.5% | 17.0% |
表 1:ILSVRC-2010 测试集上的结果比较。斜体为其他人取得的最好结果。
We also entered our model in the ILSVRC-2012 competition and report our results in Table 2. Since the ILSVRC-2012 test set labels are not publicly available, we cannot report test error rates for all the models that we tried. In the remainder of this paragraph, we use validation and test error rates interchangeably because in our experience they do not differ by more than 0.1% (see Table 2). The CNN described in this paper achieves a top-5 error rate of 18.2%. Averaging the predictions of five similar CNNs gives an error rate of 16.4%. Training one CNN, with an extra sixth convolutional layer over the last pooling layer, to classify the entire ImageNet Fall 2011 release (15M images, 22K categories), and then “fine-tuning” it on ILSVRC-2012 gives an error rate of 16.6%. Averaging the predictions of two CNNs that were pre-trained on the entire Fall 2011 release with the aforementioned five CNNs gives an error rate of 15.3%. The second-best contest entry achieved an error rate of 26.2% with an approach that averages the predictions of several classifiers trained on FVs computed from different types of densely-sampled features [7].
我们还用模型参加了 ILSVRC-2012 竞赛,结果见表 2。由于 ILSVRC-2012 测试集标签未公开,我们无法报告所有尝试过的模型的测试错误率。在本段余下部分,我们不区分验证错误率和测试错误率,因为根据我们的经验,两者相差不超过 0.1%(见表 2)。本文描述的 CNN 取得了 18.2% 的 top-5 错误率。对五个类似 CNN 的预测取平均,错误率为 16.4%。训练一个在最后一个池化层之上多加一个第六卷积层的 CNN,先让它对整个 ImageNet 2011 秋季版(1500 万张图像,2.2 万个类别)做分类,再在 ILSVRC-2012 上“微调”,错误率为 16.6%。把两个在整个 2011 秋季版上预训练的 CNN 与前述五个 CNN 的预测一起取平均,错误率为 15.3%。竞赛第二名的错误率为 26.2%,所用方法对多个分类器的预测取平均,这些分类器基于由不同类型密集采样特征计算出的 FV 训练 [7]。
| Model | Top-1 (val) | Top-5 (val) | Top-5 (test) |
|---|---|---|---|
| SIFT + FVs [7] | — | — | 26.2% |
| 1 CNN | 40.7% | 18.2% | — |
| 5 CNNs | 38.1% | 16.4% | 16.4% |
| 1 CNN* | 39.0% | 16.6% | — |
| 7 CNNs* | 36.7% | 15.4% | 15.3% |
Table 2: Comparison of error rates on ILSVRC-2012 validation and test sets. In italics are best results achieved by others. Models with an asterisk* were “pre-trained” to classify the entire ImageNet 2011 Fall release. See Section 6 for details.
| 模型 | Top-1(验证) | Top-5(验证) | Top-5(测试) |
|---|---|---|---|
| SIFT + FVs [7] | — | — | 26.2% |
| 1 个 CNN | 40.7% | 18.2% | — |
| 5 个 CNN | 38.1% | 16.4% | 16.4% |
| 1 个 CNN* | 39.0% | 16.6% | — |
| 7 个 CNN* | 36.7% | 15.4% | 15.3% |
表 2:ILSVRC-2012 验证集和测试集上的错误率比较。斜体为其他人取得的最好结果。带星号*的模型先经过“预训练”,对整个 ImageNet 2011 秋季版做分类。详见第 6 节。
Finally, we also report our error rates on the Fall 2009 version of ImageNet with 10,184 categories and 8.9 million images. On this dataset we follow the convention in the literature of using half of the images for training and half for testing. Since there is no established test set, our split necessarily differs from the splits used by previous authors, but this does not affect the results appreciably. Our top-1 and top-5 error rates on this dataset are 67.4% and 40.9%, attained by the net described above but with an additional, sixth convolutional layer over the last pooling layer. The best published results on this dataset are 78.1% and 60.9% [19].
最后,我们还报告在 ImageNet 2009 秋季版上的错误率,该版本有 10,184 个类别、890 万张图像。在这个数据集上,我们按照文献惯例,一半图像用于训练,一半用于测试。由于没有既定的测试集,我们的划分必然与前人的不同,但这不会明显影响结果。我们在这个数据集上的 top-1 和 top-5 错误率为 67.4% 和 40.9%,所用网络就是上面描述的网络,只是在最后一个池化层之上多加了第六个卷积层。这个数据集上已发表的最好结果是 78.1% 和 60.9% [19]。
⁵ The error rates without averaging predictions over ten patches as described in Section 4.1 are 39.0% and 18.3%.
⁵ 如果不按第 4.1 节所述对十个图块的预测取平均,错误率为 39.0% 和 18.3%。
6.1 Qualitative Evaluations
6.1 定性评估
Figure 3 shows the convolutional kernels learned by the network’s two data-connected layers. The network has learned a variety of frequency- and orientation-selective kernels, as well as various colored blobs. Notice the specialization exhibited by the two GPUs, a result of the restricted connectivity described in Section 3.5. The kernels on GPU 1 are largely color-agnostic, while the kernels on on GPU 2 are largely color-specific. This kind of specialization occurs during every run and is independent of any particular random weight initialization (modulo a renumbering of the GPUs).
图 3 展示了网络中两个直接连接数据的层学到的卷积核。网络学到了多种具有频率选择性和方向选择性的卷积核,以及各种彩色斑块。请注意两块 GPU 表现出的分工,这是第 3.5 节所述受限连接的结果。GPU 1 上的卷积核大多与颜色无关,而 GPU 2 上的卷积核大多针对特定颜色。这种分工在每次运行中都会出现,与具体的随机权重初始化无关(不计 GPU 编号的互换)。
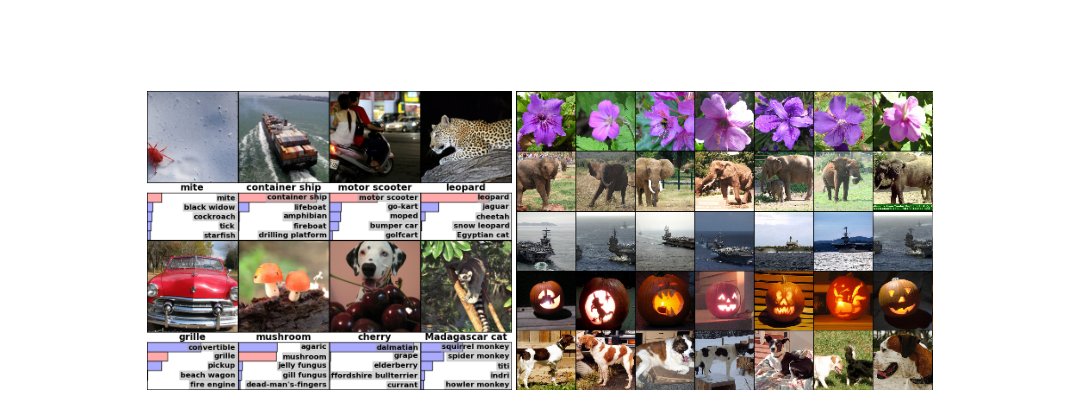
Figure 4: (Left) Eight ILSVRC-2010 test images and the five labels considered most probable by our model. The correct label is written under each image, and the probability assigned to the correct label is also shown with a red bar (if it happens to be in the top 5). (Right) Five ILSVRC-2010 test images in the first column. The remaining columns show the six training images that produce feature vectors in the last hidden layer with the smallest Euclidean distance from the feature vector for the test image.
图 4:(左)八张 ILSVRC-2010 测试图像,以及模型认为最可能的五个标签。每张图像下方写有正确标签;如果正确标签恰好在前五名中,赋予它的概率也用红条表示。(右)第一列是五张 ILSVRC-2010 测试图像。其余各列是六张训练图像,它们在最后一个隐藏层产生的特征向量,与测试图像特征向量的欧氏距离最小。
In the left panel of Figure 4 we qualitatively assess what the network has learned by computing its top-5 predictions on eight test images. Notice that even off-center objects, such as the mite in the top-left, can be recognized by the net. Most of the top-5 labels appear reasonable. For example, only other types of cat are considered plausible labels for the leopard. In some cases (grille, cherry) there is genuine ambiguity about the intended focus of the photograph.
在图 4 左侧,我们计算网络对八张测试图像的 top-5 预测,以定性评估网络学到了什么。请注意,即使是偏离中心的物体,例如左上角的螨虫,网络也能识别出来。大多数 top-5 标签看起来都合理。例如,对于豹子,网络认为合理的其他标签只有别的猫科动物。在某些情况下(格栅、樱桃),照片想要表现的主体确实存在歧义。
Another way to probe the network’s visual knowledge is to consider the feature activations induced by an image at the last, 4096-dimensional hidden layer. If two images produce feature activation vectors with a small Euclidean separation, we can say that the higher levels of the neural network consider them to be similar. Figure 4 shows five images from the test set and the six images from the training set that are most similar to each of them according to this measure. Notice that at the pixel level, the retrieved training images are generally not close in L2 to the query images in the first column. For example, the retrieved dogs and elephants appear in a variety of poses. We present the results for many more test images in the supplementary material.
探查网络视觉知识的另一种方法,是看一张图像在最后一个 4096 维隐藏层上引起的特征激活。如果两张图像产生的特征激活向量之间欧氏距离很小,就可以说神经网络的高层认为它们相似。图 4 展示了测试集中的五张图像,以及按这种度量与每张图像最相似的六张训练图像。请注意,在像素层面,检索出的训练图像与第一列的查询图像在 L2 距离上一般并不接近。例如,检索出的狗和大象姿态各异。更多测试图像的结果见补充材料。
Computing similarity by using Euclidean distance between two 4096-dimensional, real-valued vectors is inefficient, but it could be made efficient by training an auto-encoder to compress these vectors to short binary codes. This should produce a much better image retrieval method than applying auto-encoders to the raw pixels [14], which does not make use of image labels and hence has a tendency to retrieve images with similar patterns of edges, whether or not they are semantically similar.
用两个 4096 维实值向量之间的欧氏距离计算相似度效率不高,但可以训练一个自编码器把这些向量压缩成短的二进制编码,从而提高效率。这应该会得到一种比直接对原始像素使用自编码器 [14] 好得多的图像检索方法;后者不利用图像标签,因此倾向于检索出边缘模式相似的图像,而不管它们在语义上是否相似。
7 Discussion
7 讨论
Our results show that a large, deep convolutional neural network is capable of achieving record-breaking results on a highly challenging dataset using purely supervised learning. It is notable that our network’s performance degrades if a single convolutional layer is removed. For example, removing any of the middle layers results in a loss of about 2% for the top-1 performance of the network. So the depth really is important for achieving our results.
我们的结果表明,一个大型深度卷积神经网络仅靠监督学习,就能在极具挑战性的数据集上取得破纪录的结果。值得一提的是,只要去掉一个卷积层,网络的性能就会下降。例如,去掉任何一个中间层,网络的 top-1 性能都会损失约 2%。所以,深度对取得我们的结果确实很重要。
To simplify our experiments, we did not use any unsupervised pre-training even though we expect that it will help, especially if we obtain enough computational power to significantly increase the size of the network without obtaining a corresponding increase in the amount of labeled data. Thus far, our results have improved as we have made our network larger and trained it longer but we still have many orders of magnitude to go in order to match the infero-temporal pathway of the human visual system. Ultimately we would like to use very large and deep convolutional nets on video sequences where the temporal structure provides very helpful information that is missing or far less obvious in static images.
为了简化实验,我们没有使用任何无监督预训练,尽管我们预期它会有帮助,尤其是在算力足以大幅扩大网络、而标注数据量没有相应增加的情况下。到目前为止,网络做得越大、训练得越久,我们的结果就越好,但要赶上人类视觉系统的下颞叶通路,还差好几个数量级。我们最终希望把非常大、非常深的卷积网络用于视频序列,视频的时间结构能提供非常有用的信息,而这些信息在静态图像中缺失或远不明显。
References
参考文献
[1] R.M. Bell and Y. Koren. Lessons from the netflix prize challenge. ACM SIGKDD Explorations Newsletter, 9(2):75–79, 2007.
[2] A. Berg, J. Deng, and L. Fei-Fei. Large scale visual recognition challenge 2010. www.image-net.org/challenges. 2010.
[3] L. Breiman. Random forests. Machine learning, 45(1):5–32, 2001.
[4] D. Cireşan, U. Meier, and J. Schmidhuber. Multi-column deep neural networks for image classification. Arxiv preprint arXiv:1202.2745, 2012.
[5] D.C. Cireşan, U. Meier, J. Masci, L.M. Gambardella, and J. Schmidhuber. High-performance neural networks for visual object classification. Arxiv preprint arXiv:1102.0183, 2011.
[6] J. Deng, W. Dong, R. Socher, L.-J. Li, K. Li, and L. Fei-Fei. ImageNet: A Large-Scale Hierarchical Image Database. In CVPR09, 2009.
[7] J. Deng, A. Berg, S. Satheesh, H. Su, A. Khosla, and L. Fei-Fei. ILSVRC-2012, 2012. URL http://www.image-net.org/challenges/LSVRC/2012/.
[8] L. Fei-Fei, R. Fergus, and P. Perona. Learning generative visual models from few training examples: An incremental bayesian approach tested on 101 object categories. Computer Vision and Image Understanding, 106(1):59–70, 2007.
[9] G. Griffin, A. Holub, and P. Perona. Caltech-256 object category dataset. Technical Report 7694, California Institute of Technology, 2007. URL http://authors.library.caltech.edu/7694.
[10] G.E. Hinton, N. Srivastava, A. Krizhevsky, I. Sutskever, and R.R. Salakhutdinov. Improving neural networks by preventing co-adaptation of feature detectors. arXiv preprint arXiv:1207.0580, 2012.
[11] K. Jarrett, K. Kavukcuoglu, M. A. Ranzato, and Y. LeCun. What is the best multi-stage architecture for object recognition? In International Conference on Computer Vision, pages 2146–2153. IEEE, 2009.
[12] A. Krizhevsky. Learning multiple layers of features from tiny images. Master’s thesis, Department of Computer Science, University of Toronto, 2009.
[13] A. Krizhevsky. Convolutional deep belief networks on cifar-10. Unpublished manuscript, 2010.
[14] A. Krizhevsky and G.E. Hinton. Using very deep autoencoders for content-based image retrieval. In ESANN, 2011.
[15] Y. Le Cun, B. Boser, J.S. Denker, D. Henderson, R.E. Howard, W. Hubbard, L.D. Jackel, et al. Handwritten digit recognition with a back-propagation network. In Advances in neural information processing systems, 1990.
[16] Y. LeCun, F.J. Huang, and L. Bottou. Learning methods for generic object recognition with invariance to pose and lighting. In Computer Vision and Pattern Recognition, 2004. CVPR 2004. Proceedings of the 2004 IEEE Computer Society Conference on, volume 2, pages II–97. IEEE, 2004.
[17] Y. LeCun, K. Kavukcuoglu, and C. Farabet. Convolutional networks and applications in vision. In Circuits and Systems (ISCAS), Proceedings of 2010 IEEE International Symposium on, pages 253–256. IEEE, 2010.
[18] H. Lee, R. Grosse, R. Ranganath, and A.Y. Ng. Convolutional deep belief networks for scalable unsupervised learning of hierarchical representations. In Proceedings of the 26th Annual International Conference on Machine Learning, pages 609–616. ACM, 2009.
[19] T. Mensink, J. Verbeek, F. Perronnin, and G. Csurka. Metric Learning for Large Scale Image Classification: Generalizing to New Classes at Near-Zero Cost. In ECCV - European Conference on Computer Vision, Florence, Italy, October 2012.
[20] V. Nair and G. E. Hinton. Rectified linear units improve restricted boltzmann machines. In Proc. 27th International Conference on Machine Learning, 2010.
[21] N. Pinto, D.D. Cox, and J.J. DiCarlo. Why is real-world visual object recognition hard? PLoS computational biology, 4(1):e27, 2008.
[22] N. Pinto, D. Doukhan, J.J. DiCarlo, and D.D. Cox. A high-throughput screening approach to discovering good forms of biologically inspired visual representation. PLoS computational biology, 5(11):e1000579, 2009.
[23] B.C. Russell, A. Torralba, K.P. Murphy, and W.T. Freeman. Labelme: a database and web-based tool for image annotation. International journal of computer vision, 77(1):157–173, 2008.
[24] J. Sánchez and F. Perronnin. High-dimensional signature compression for large-scale image classification. In Computer Vision and Pattern Recognition (CVPR), 2011 IEEE Conference on, pages 1665–1672. IEEE, 2011.
[25] P.Y. Simard, D. Steinkraus, and J.C. Platt. Best practices for convolutional neural networks applied to visual document analysis. In Proceedings of the Seventh International Conference on Document Analysis and Recognition, volume 2, pages 958–962, 2003.
[26] S.C. Turaga, J.F. Murray, V. Jain, F. Roth, M. Helmstaedter, K. Briggman, W. Denk, and H.S. Seung. Convolutional networks can learn to generate affinity graphs for image segmentation. Neural Computation, 22(2):511–538, 2010.