Grad-CAM: Visual Explanations from Deep Networks via Gradient-based Localization
∎
Grad-CAM: Visual Explanations from Deep Networks via Gradient-based Localization
Ramprasaath R. Selvaraju Affiliation: Georgia Institute of Technology, Atlanta, GA, USA E-mail: ramprs@gatech.edu Michael Cogswell Affiliation: Georgia Institute of Technology, Atlanta, GA, USA E-mail: cogswell@gatech.edu Abhishek Das Affiliation: Georgia Institute of Technology, Atlanta, GA, USA E-mail: abhshkdz@gatech.edu Ramakrishna Vedantam Affiliation: Georgia Institute of Technology, Atlanta, GA, USA E-mail: vrama@gatech.edu Devi Parikh Affiliation: Georgia Institute of Technology, Atlanta, GA, USA Facebook AI Research, Menlo Park, CA, USA E-mail: parikh@gatech.edu Dhruv Batra Affiliation: Georgia Institute of Technology, Atlanta, GA, USA Facebook AI Research, Menlo Park, CA, USA E-mail: dbatra@gatech.edu
Abstract
摘要
We propose a technique for producing ‘visual explanations’ for decisions from a large class of Convolutional Neural Network (CNN)-based models, making them more transparent and explainable.
我们提出一种为大量基于卷积神经网络(CNN)的模型生成「视觉解释」的技术,使它们更透明、更可解释。
Our approach – Gradient-weighted Class Activation Mapping (Grad-CAM), uses the gradients of any target concept (say ‘dog’ in a classification network or a sequence of words in captioning network) flowing into the final convolutional layer to produce a coarse localization map highlighting the important regions in the image for predicting the concept.
我们的方法——梯度加权类激活映射(Grad-CAM)——利用任意目标概念(例如分类网络中的「狗」,或描述网络中的一串词)流入最后一层卷积层的梯度,生成粗定位图,标出对预测该概念重要的图像区域。
Unlike previous approaches, Grad-CAM is applicable to a wide variety of CNN model-families: (1) CNNs with fully-connected layers (e.g. VGG), (2) CNNs used for structured outputs (e.g. captioning), (3) CNNs used in tasks with multi-modal inputs (e.g. visual question answering) or reinforcement learning, all without architectural changes or re-training. We combine Grad-CAM with existing fine-grained visualizations to create a high-resolution class-discriminative visualization, Guided Grad-CAM, and apply it to image classification, image captioning, and visual question answering (VQA) models, including ResNet-based architectures.
与先前方法不同,Grad-CAM 适用于广泛的 CNN 模型族:(1)含全连接层的 CNN(例如 VGG),(2)用于结构化输出的 CNN(例如 图像描述),(3)用于多模态输入(例如 视觉问答)或强化学习的 CNN,且无需改结构或重新训练。我们把 Grad-CAM 与已有细粒度可视化结合,得到高分辨率且类区分的 Guided Grad-CAM,并应用于图像分类、图像描述与视觉问答(VQA)模型,包括基于 ResNet 的结构。
In the context of image classification models, our visualizations (a) lend insights into failure modes of these models (showing that seemingly unreasonable predictions have reasonable explanations), (b) outperform previous methods on the ILSVRC-15 weakly-supervised localization task, (c) are robust to adversarial perturbations, (d) are more faithful to the underlying model, and (e) help achieve model generalization by identifying dataset bias.
在图像分类模型上,我们的可视化(a)有助于洞察这些模型的失败模式(表明看似不合理的预测其实有合理解释),(b)在 ILSVRC-15 弱监督定位任务上超过先前方法,(c)对对抗扰动稳健,(d)更忠实于底层模型,以及(e)通过识别数据集偏差帮助实现模型泛化。
For image captioning and VQA, our visualizations show that even non-attention based models learn to localize discriminative regions of input image.
对图像描述与 VQA,可视化表明即使是非注意力模型也会学会定位输入图像中的判别区域。
We devise a way to identify important neurons through Grad-CAM and combine it with neuron names [4] to provide textual explanations for model decisions. Finally, we design and conduct human studies to measure if Grad-CAM explanations help users establish appropriate trust in predictions from deep networks and show that Grad-CAM helps untrained users successfully discern a ‘stronger’ deep network from a ‘weaker’ one even when both make identical predictions. Our code is available at https://github.com/ramprs/grad-cam/, along with a demo on CloudCV [2][^1], and a video at youtu.be/COjUB9Izk6E.
我们设计了一种用 Grad-CAM 识别重要神经元、再结合神经元名称 [4] 给出文本解释的方式。最后,我们设计并开展人体实验,衡量 Grad-CAM 解释是否帮助用户对深度网络预测建立恰当信任,并表明即使两个网络做出相同预测,Grad-CAM 也能帮助未经训练的用户成功区分「更强」与「更弱」网络。代码见 https://github.com/ramprs/grad-cam/,另有 CloudCV [2][^1] 演示,以及视频 youtu.be/COjUB9Izk6E。
1 Introduction
1 引言
Deep neural models based on Convolutional Neural Networks (CNNs) have enabled unprecedented breakthroughs in a variety of computer vision tasks, from image classification [33, 24], object detection [21], semantic segmentation [37] to image captioning [55, 7, 18, 29], visual question answering [3, 20, 42, 46] and more recently, visual dialog [11, 13, 12] and embodied question answering [10, 23]. While these models enable superior performance, their lack of decomposability into individually intuitive components makes them hard to interpret [36]. Consequently, when today’s intelligent systems fail, they often fail spectacularly disgracefully without warning or explanation, leaving a user staring at an incoherent output, wondering why the system did what it did.
基于卷积神经网络(CNN)的深度神经模型在多种计算机视觉任务上带来前所未有的突破,从图像分类 [33, 24]、目标检测 [21]、语义分割 [37] 到图像描述 [55, 7, 18, 29]、视觉问答 [3, 20, 42, 46],以及更近的视觉对话 [11, 13, 12] 与具身问答 [10, 23]。这些模型性能出众,却难以分解成各自直观的组件,因而很难解释 [36]。于是当今天的智能系统失败时,往往毫无预警地惨败,用户面对不知所云的输出,却不知道系统为何如此。
Interpretability matters. In order to build trust in intelligent systems and move towards their meaningful integration into our everyday lives, it is clear that we must build ‘transparent’ models that have the ability to explain why they predict what they predict. Broadly speaking, this transparency and ability to explain is useful at three different stages of Artificial Intelligence (AI) evolution. First, when AI is significantly weaker than humans and not yet reliably deployable (e.g. visual question answering [3]), the goal of transparency and explanations is to identify the failure modes [1, 25], thereby helping researchers focus their efforts on the most fruitful research directions. Second, when AI is on par with humans and reliably deployable (e.g., image classification [30] trained on sufficient data), the goal is to establish appropriate trust and confidence in users. Third, when AI is significantly stronger than humans (e.g. chess or Go [50]), the goal of explanations is in machine teaching [28] – i.e., a machine teaching a human about how to make better decisions.
可解释性很重要。 为了在智能系统中建立信任并走向有意义的日常融合,显然必须构建能解释为何做出该预测的「透明」模型。广义上,这种透明与解释能力在人工智能(AI)演进的三个阶段都有用。第一,当 AI 明显弱于人类、尚不可靠部署时(例如 视觉问答 [3]),透明与解释的目标是识别失败模式 [1, 25],从而帮助研究者把精力集中在最有收获的方向。第二,当 AI 与人类持平、可可靠部署时(例如 在充足数据上训练的图像分类 [30]),目标是在用户中建立恰当信任与信心。第三,当 AI 明显强于人类时(例如 国际象棋或围棋 [50]),解释的目标在于机器教学 [28]——即 机器教人类如何做出更好决策。
(a) Original Image
(a) 原图
There typically exists a trade-off between accuracy and simplicity or interpretability. Classical rule-based or expert systems [26] are highly interpretable but not very accurate (or robust). Decomposable pipelines where each stage is hand-designed are thought to be more interpretable as each individual component assumes a natural intuitive explanation. By using deep models, we sacrifice interpretable modules for uninterpretable ones that achieve greater performance through greater abstraction (more layers) and tighter integration (end-to-end training). Recently introduced deep residual networks (ResNets) [24] are over 200-layers deep and have shown state-of-the-art performance in several challenging tasks. Such complexity makes these models hard to interpret. As such, deep models are beginning to explore the spectrum between interpretability and accuracy.
准确率与简洁性或可解释性之间通常存在权衡。经典的规则或专家系统 [26] 高度可解释,但不够准确(或不稳健)。各阶段手工设计的可分解流水线被认为更可解释,因为每个组件都有自然直观的解释。使用深度模型时,我们用不可解释模块换取可解释模块,通过更高抽象(更多层)与更紧集成(端到端训练)取得更好性能。最近提出的深度残差网络(ResNets) [24] 超过 200 层,并在多项挑战任务上表现先进。这种复杂度使模型难以解释。因此,深度模型开始在可解释性与准确率之间探索光谱。
Zhou et al. [59] recently proposed a technique called Class Activation Mapping (CAM) for identifying discriminative regions used by a restricted class of image classification CNNs which do not contain any fully-connected layers. In essence, this work trades off model complexity and performance for more transparency into the working of the model. In contrast, we make existing state-of-the-art deep models interpretable without altering their architecture, thus avoiding the interpretability vs. accuracy trade-off. Our approach is a generalization of CAM [59] and is applicable to a significantly broader range of CNN model families: (1) CNNs with fully-connected layers (e.g. VGG), (2) CNNs used for structured outputs (e.g. captioning), (3) CNNs used in tasks with multi-modal inputs (e.g. VQA) or reinforcement learning, without requiring architectural changes or re-training.
Zhou et al. [59] 最近提出类激活映射(CAM),用于识别一类受限图像分类 CNN(不含全连接层)所使用的判别区域。本质上,该工作用模型复杂度与性能换取对模型工作机制更多的透明。相比之下,我们在不改结构的前提下使现有先进深度模型可解释,从而避免可解释性与准确率的权衡。我们的方法是 CAM [59] 的推广,适用于显著更广的 CNN 模型族:(1)含全连接层的 CNN(例如 VGG),(2)用于结构化输出的 CNN(例如 描述),(3)用于多模态输入(例如 VQA)或强化学习的 CNN,无需改结构或重新训练。
What makes a good visual explanation? Consider image classification [14] – a ‘good’ visual explanation from the model for justifying any target category should be (a) class-discriminative (i.e. localize the category in the image) and (b) high-resolution (i.e. capture fine-grained detail).
怎样才算好的视觉解释? 以图像分类 [14] 为例——模型为任意目标类别给出的「好」视觉解释应(a)类区分(即 在图像中定位该类别)且(b)高分辨率(即 捕捉细粒度细节)。
Fig. 1 shows outputs from a number of visualizations for the ‘tiger cat’ class (top) and ‘boxer’ (dog) class (bottom). Pixel-space gradient visualizations such as Guided Backpropagation [53] and Deconvolution [57] are high-resolution and highlight fine-grained details in the image, but are not class-discriminative (Fig. 1(b) and Fig. 1(h) are very similar).
图 1 展示了「虎猫」类(上)与「拳师犬」(下)的多种可视化输出。像素空间梯度可视化如 Guided Backpropagation [53] 与 Deconvolution [57] 高分辨率并突出细粒度细节,但不是类区分的(图 1(b) 与图 1(h) 非常相似)。
In contrast, localization approaches like CAM or our proposed method Gradient-weighted Class Activation Mapping (Grad-CAM), are highly class-discriminative (the ‘cat’ explanation exclusively highlights the ‘cat’ regions but not ‘dog’ regions in Fig. 1(c), and vice versa in Fig. 1(i)).
相比之下,像 CAM 或我们提出的梯度加权类激活映射(Grad-CAM)这类定位方法高度类区分(「猫」的解释只高亮图 1(c) 中的猫区域而非狗区域,图 1(i) 则反之)。
In order to combine the best of both worlds, we show that it is possible to fuse existing pixel-space gradient visualizations with Grad-CAM to create Guided Grad-CAM visualizations that are both high-resolution and class-discriminative. As a result, important regions of the image which correspond to any decision of interest are visualized in high-resolution detail even if the image contains evidence for multiple possible concepts, as shown in Figures 1d and 1j. When visualized for ‘tiger cat’, Guided Grad-CAM not only highlights the cat regions, but also highlights the stripes on the cat, which is important for predicting that particular variety of cat.
为兼得两者之长,我们表明可以把已有像素空间梯度可视化与 Grad-CAM 融合,得到既高分辨率又类区分的 Guided Grad-CAM。于是,即使图像含多种可能概念的证据,与任意感兴趣决策对应的重要区域也能以高分辨率细节呈现,如图 1d 与 1j。对「虎猫」可视化时,Guided Grad-CAM 不仅高亮猫区域,还高亮对预测该品种重要的条纹。
To summarize, our contributions are as follows:
总结起来,我们的贡献如下:
(1) We introduce Grad-CAM, a class-discriminative localization technique that generates visual explanations for any CNN-based network without requiring architectural changes or re-training. We evaluate Grad-CAM for localization (Sec. 4.1), and faithfulness to model (Sec. 5.3), where it outperforms baselines.
(1) 我们提出 Grad-CAM,一种类区分的定位技术,可为任意基于 CNN 的网络生成视觉解释,无需改结构或重新训练。我们在定位(第 4.1 节)与对模型的忠实性(第 5.3 节)上评估 Grad-CAM,均超过基线。
(2) We apply Grad-CAM to existing top-performing classification, captioning (Sec. 8.1), and VQA (Sec. 8.2) models. For image classification, our visualizations lend insight into failures of current CNNs (Sec. 6.1), showing that seemingly unreasonable predictions have reasonable explanations. For captioning and VQA, our visualizations expose that common CNN + LSTM models are often surprisingly good at localizing discriminative image regions despite not being trained on grounded image-text pairs.
(2) 我们将 Grad-CAM 应用于现有顶尖的分类、描述(第 8.1 节)与 VQA(第 8.2 节)模型。对图像分类,可视化有助于洞察当前 CNN 的失败(第 6.1 节),表明看似不合理的预测其实有合理解释。对描述与 VQA,可视化揭示常见 CNN + LSTM 模型尽管未在有根基的图文对上训练,却往往出人意料地善于定位判别图像区域。
(3) We show a proof-of-concept of how interpretable Grad-CAM visualizations help in diagnosing failure modes by uncovering biases in datasets. This is important not just for generalization, but also for fair and bias-free outcomes as more and more decisions are made by algorithms in society.
(3) 我们给出可解释 Grad-CAM 可视化如何通过揭示数据集偏差来诊断失败模式的概念验证。这不仅对泛化重要,也随着社会中越来越多决策由算法做出,对公平、无偏差结果至关重要。
(4) We present Grad-CAM visualizations for ResNets [24] applied to image classification and VQA (Sec. 8.2).
(4) 我们展示将 ResNets [24] 用于图像分类与 VQA 的 Grad-CAM 可视化(第 8.2 节)。
(5) We use neuron importance from Grad-CAM and neuron names from [4] and obtain textual explanations for model decisions (Sec. 7).
(5) 我们用 Grad-CAM 的神经元重要性与 [4] 的神经元名称,得到模型决策的文本解释(第 7 节)。
(6) We conduct human studies (Sec. 5) that show Guided Grad-CAM explanations are class-discriminative and not only help humans establish trust, but also help untrained users successfully discern a ‘stronger’ network from a ‘weaker’ one, even when both make identical predictions.
(6) 我们开展人体实验(第 5 节),表明 Guided Grad-CAM 解释是类区分的,不仅帮助人类建立信任,还帮助未经训练的用户成功区分「更强」与「更弱」网络,即使两者做出相同预测。
Paper Organization: The rest of the paper is organized as follows. In section 3 we propose our approach Grad-CAM and Guided Grad-CAM. In sections 4 and 5 we evaluate the localization ability, class-discriminativeness, trustworthyness and faithfulness of Grad-CAM. In section 6 we show certain use cases of Grad-CAM such as diagnosing image classification CNNs and identifying biases in datasets. In section 7 we provide a way to obtain textual explanations with Grad-CAM. In section 8 we show how Grad-CAM can be applied to vision and language models – image captioning and Visual Question Answering (VQA).
论文组织: 其余部分如下。第 3 节提出 Grad-CAM 与 Guided Grad-CAM。第 4、5 节评估定位能力、类区分性、可信度与忠实性。第 6 节展示诊断图像分类 CNN、识别数据集偏差等用例。第 7 节给出结合 Grad-CAM 获得文本解释的方法。第 8 节展示如何将 Grad-CAM 用于视觉与语言模型——图像描述与视觉问答(VQA)。
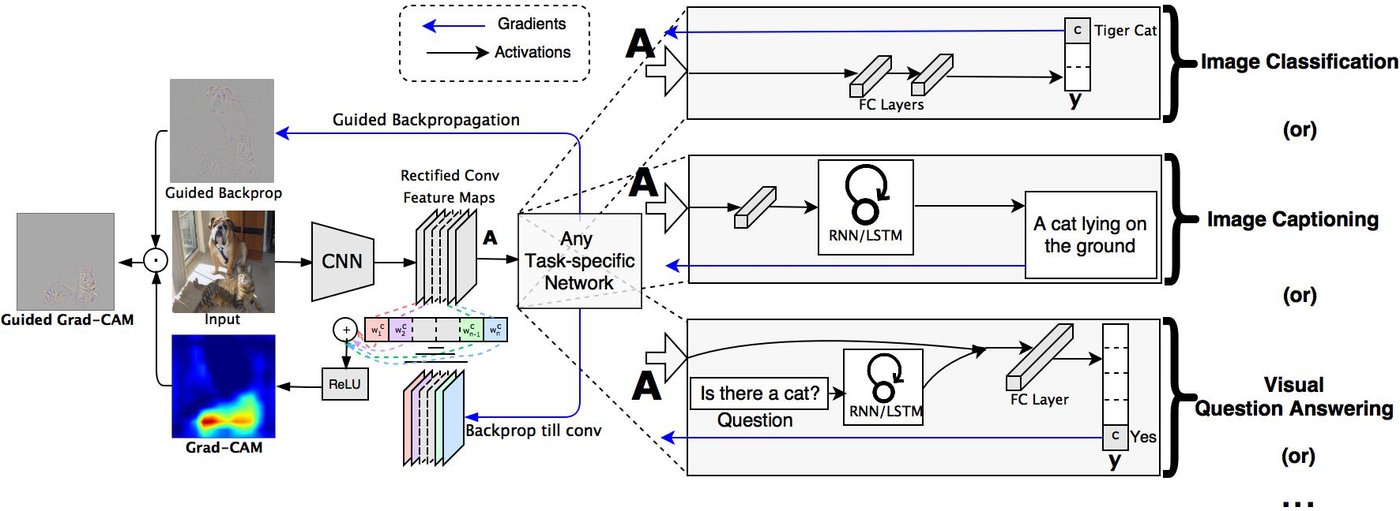
Figure 2: Grad-CAM overview: Given an image and a class of interest (e.g., ‘tiger cat’ or any other type of differentiable output) as input, we forward propagate the image through the CNN part of the model and then through task-specific computations to obtain a raw score for the category. The gradients are set to zero for all classes except the desired class (tiger cat), which is set to 1. This signal is then backpropagated to the rectified convolutional feature maps of interest, which we combine to compute the coarse Grad-CAM localization (blue heatmap) which represents where the model has to look to make the particular decision. Finally, we pointwise multiply the heatmap with guided backpropagation to get Guided Grad-CAM visualizations which are both high-resolution and concept-specific.
图 2:Grad-CAM 概览:给定图像与感兴趣类别(例如「虎猫」或任意其他可微输出)作为输入,我们把图像前传到模型的 CNN 部分,再经任务特定计算得到该类别的原始分数。除期望类别(虎猫)设为 1 外,其余类别梯度置零。该信号再反传到感兴趣的整流卷积特征图,组合后得到粗 Grad-CAM 定位(蓝色热图),表示模型做该决策需要看哪里。最后把热图与 guided backpropagation 逐点相乘,得到既高分辨率又概念特定的 Guided Grad-CAM 可视化。
2 Related Work
2 相关工作
Our work draws on recent work in CNN visualizations, model trust assessment, and weakly-supervised localization.
我们的工作借鉴 CNN 可视化、模型信任评估与弱监督定位方面的近期研究。
Visualizing CNNs. A number of previous works [51, 53, 57, 19] have visualized CNN predictions by highlighting ‘important’ pixels (i.e. change in intensities of these pixels have the most impact on the prediction score). Specifically, Simonyan et al. [51] visualize partial derivatives of predicted class scores w.r.t. pixel intensities, while Guided Backpropagation [53] and Deconvolution [57] make modifications to ‘raw’ gradients that result in qualitative improvements. These approaches are compared in [40]. Despite producing fine-grained visualizations, these methods are not class-discriminative. Visualizations with respect to different classes are nearly identical (see Figures 1b and 1h).
可视化 CNN。若干先前工作 [51, 53, 57, 19] 通过高亮「重要」像素(即 这些像素强度变化对预测分数影响最大)来可视化 CNN 预测。具体地,Simonyan et al. [51] 可视化预测类分数相对像素强度的偏导,而 Guided Backpropagation [53] 与 Deconvolution [57] 对「原始」梯度做修改以获得定性改进。这些方法在 [40] 中有比较。尽管能产生细粒度可视化,这些方法不是类区分的。相对不同类别的可视化几乎相同(见图 1b 与 1h)。
Other visualization methods synthesize images to maximally activate a network unit [51, 16] or invert a latent representation [41, 15]. Although these can be high-resolution and class-discriminative, they are not specific to a single input image and visualize a model overall.
其他可视化方法合成能最大激活网络单元的图像 [51, 16],或反演潜表示 [41, 15]。它们可以高分辨率且类区分,但不针对单张输入图像,而是可视化模型整体。
Assessing Model Trust. Motivated by notions of interpretability [36] and assessing trust in models [47], we evaluate Grad-CAM visualizations in a manner similar to [47] via human studies to show that they can be important tools for users to evaluate and place trust in automated systems.
评估模型信任。受可解释性 [36] 与评估模型信任 [47] 等观念驱动,我们以类似 [47] 的方式通过人体实验评估 Grad-CAM 可视化,表明它们可以成为用户评估并信任自动化系统的重要工具。
Aligning Gradient-based Importances. Selvaraju et al. [48] proposed an approach that uses the gradient-based neuron importances introduced in our work, and maps it to class-specific domain knowledge from humans in order to learn classifiers for novel classes. In future work, Selvaraju et al. [49] proposed an approach to align gradient-based importances to human attention maps in order to ground vision and language models.
对齐基于梯度的重要性。Selvaraju et al. [48] 提出一种方法,使用本文引入的基于梯度的神经元重要性,并映射到人类的类特定领域知识,以学习新类分类器。后续工作中,Selvaraju et al. [49] 提出将基于梯度的重要性与人类注意力图对齐,以便为视觉与语言模型提供根基。
Weakly-supervised localization. Another relevant line of work is weakly-supervised localization in the context of CNNs, where the task is to localize objects in images using holistic image class labels only [8, 43, 44, 59].
弱监督定位。另一相关线路是 CNN 语境下的弱监督定位,任务是仅用整图类别标签在图像中定位物体 [8, 43, 44, 59]。
Most relevant to our approach is the Class Activation Mapping (CAM) approach to localization [59]. This approach modifies image classification CNN architectures replacing fully-connected layers with convolutional layers and global average pooling [34], thus achieving class-specific feature maps. Others have investigated similar methods using global max pooling [44] and log-sum-exp pooling [45].
与我们方法最相关的是用于定位的类激活映射(CAM) [59]。该方法修改图像分类 CNN 结构,用卷积层与全局平均池化 [34] 替换全连接层,从而得到类特定特征图。也有人研究使用全局最大池化 [44] 与 log-sum-exp 池化 [45] 的类似方法。
A drawback of CAM is that it requires feature maps to directly precede softmax layers, so it is only applicable to a particular kind of CNN architectures performing global average pooling over convolutional maps immediately prior to prediction (i.e. conv feature maps global average pooling softmax layer). Such architectures may achieve inferior accuracies compared to general networks on some tasks (e.g. image classification) or may simply be inapplicable to any other tasks (e.g. image captioning or VQA). We introduce a new way of combining feature maps using the gradient signal that does not require any modification in the network architecture. This allows our approach to be applied to off-the-shelf CNN-based architectures, including those for image captioning and visual question answering. For a fully-convolutional architecture, CAM is a special case of Grad-CAM.
CAM 的缺点是要求特征图直接位于 softmax 层之前,因此只适用于在预测前立即对卷积图做全局平均池化的特定 CNN 结构(即 卷积特征图 全局平均池化 softmax 层)。这类结构在某些任务(例如 图像分类)上可能准确率不如一般网络,或根本不适用于其他任务(例如 图像描述或 VQA)。我们提出一种用梯度信号组合特征图的新方式,无需修改网络结构。这使方法可应用于现成的基于 CNN 的结构,包括图像描述与视觉问答。对全卷积结构,CAM 是 Grad-CAM 的特例。
Other methods approach localization by classifying perturbations of the input image. Zeiler and Fergus [57] perturb inputs by occluding patches and classifying the occluded image, typically resulting in lower classification scores for relevant objects when those objects are occluded. This principle is applied for localization in [5]. Oquab et al. [43] classify many patches containing a pixel then average these patch-wise scores to provide the pixel’s class-wise score. Unlike these, our approach achieves localization in one shot; it only requires a single forward and a partial backward pass per image and thus is typically an order of magnitude more efficient. In recent work, Zhang et al. [58] introduce contrastive Marginal Winning Probability (c-MWP), a probabilistic Winner-Take-All formulation for modelling the top-down attention for neural classification models which can highlight discriminative regions. This is computationally more expensive than Grad-CAM and only works for image classification CNNs. Moreover, Grad-CAM outperforms c-MWP in quantitative and qualitative evaluations (see Sec. 4.1 and Sec. D).
其他方法通过对输入图像的扰动分类来做定位。Zeiler and Fergus [57] 用遮挡块扰动输入并对遮挡图像分类,相关物体被遮挡时分类分数通常下降。该原理在 [5] 中用于定位。Oquab et al. [43] 对包含某像素的许多块分类,再平均块级分数得到该像素的类别分数。与这些不同,我们的方法一次完成定位;每张图只需一次前向与一次部分反向,通常高效一个数量级。近期工作中,Zhang et al. [58] 提出对比边际获胜概率(c-MWP),一种用于建模神经分类模型自上而下注意力、可高亮判别区域的概率 Winner-Take-All 形式。其计算比 Grad-CAM 更贵,且只适用于图像分类 CNN。此外,Grad-CAM 在定量与定性评估上优于 c-MWP(见第 4.1 节与第 D 节)。
3 Grad-CAM
A number of previous works have asserted that deeper representations in a CNN capture higher-level visual constructs [6, 41]. Furthermore, convolutional layers naturally retain spatial information which is lost in fully-connected layers, so we can expect the last convolutional layers to have the best compromise between high-level semantics and detailed spatial information. The neurons in these layers look for semantic class-specific information in the image (say object parts). Grad-CAM uses the gradient information flowing into the last convolutional layer of the CNN to assign importance values to each neuron for a particular decision of interest. Although our technique is fairly general in that it can be used to explain activations in any layer of a deep network, in this work, we focus on explaining output layer decisions only.
若干先前工作主张 CNN 中更深的表示捕捉更高层的视觉构造 [6, 41]。此外,卷积层自然保留空间信息,而这在全连接层中会丢失,因此可期望最后几层卷积在高层语义与细致空间信息之间取得最佳折中。这些层中的神经元在图像中寻找语义上类特定的信息(例如物体部件)。Grad-CAM 利用流入 CNN 最后一层卷积层的梯度信息,为感兴趣的特定决策给每个神经元赋重要性。尽管我们的技术相当通用,可用于解释深度网络任意层的激活,本文只聚焦解释输出层决策。
As shown in Fig. 2, in order to obtain the class-discriminative localization map Grad-CAM of width and height for any class , we first compute the gradient of the score for class , (before the softmax), with respect to feature map activations of a convolutional layer, i.e. . These gradients flowing back are global-average-pooled [^2] over the width and height dimensions (indexed by and respectively) to obtain the neuron importance weights :
如图 2 所示,为得到任意类别 的类区分定位图 Grad-CAM (宽 、高 ),我们先计算类别 的分数 (softmax 之前)相对某卷积层特征图激活 的梯度,即 。这些回流梯度在宽高维(分别由 、 索引)上做全局平均池化 [^2],得到神经元重要性权重 :
During computation of while backpropagating gradients with respect to activations, the exact computation amounts to successive matrix products of the weight matrices and the gradient with respect to activation functions till the final convolution layer that the gradients are being propagated to. Hence, this weight represents a partial linearization of the deep network downstream from A, and captures the ‘importance’ of feature map for a target class .
计算 时,相对激活反传梯度的精确计算等价于权重矩阵与相对激活函数的梯度连乘,直到梯度传到的最终卷积层。因此该权重 表示自 起下游深度网络的部分线性化,并捕捉特征图 对目标类 的「重要性」。
We perform a weighted combination of forward activation maps, and follow it by a ReLU to obtain,
我们对前向激活图做加权组合,再接 ReLU,得到
Notice that this results in a coarse heatmap of the same size as the convolutional feature maps ( in the case of last convolutional layers of VGG [52] and AlexNet [33] networks) [^3]. We apply a ReLU to the linear combination of maps because we are only interested in the features that have a positive influence on the class of interest, i.e. pixels whose intensity should be increased in order to increase . Negative pixels are likely to belong to other categories in the image. As expected, without this ReLU, localization maps sometimes highlight more than just the desired class and perform worse at localization. Figures 1c, 1f and 1i, 1l show Grad-CAM visualizations for ‘tiger cat’ and ‘boxer (dog)’ respectively. Ablation studies are available in Sec. B.
注意这得到与卷积特征图同尺寸的粗热图(对 VGG [52] 与 AlexNet [33] 最后卷积层为 )[^3]。我们对映射的线性组合施加 ReLU,因为我们只关心对感兴趣类别有正影响的特征,即 为增大 应提高强度的像素。负像素很可能属于图像中的其他类别。正如所料,去掉该 ReLU 时定位图有时会高亮超出期望类别的区域,定位更差。图 1c、1f 与 1i、1l 分别给出「虎猫」与「拳师犬」的 Grad-CAM 可视化。消融见第 B 节。
In general, need not be the class score produced by an image classification CNN. It could be any differentiable activation including words from a caption or answer to a question.
一般地, 不必是图像分类 CNN 产生的类分数。它可以是任意可微激活,包括描述中的词或问题的答案。
3.1 Grad-CAM generalizes CAM
3.1 Grad-CAM 推广 CAM
In this section, we discuss the connections between Grad-CAM and Class Activation Mapping (CAM) [59], and formally prove that Grad-CAM generalizes CAM for a wide variety of CNN-based architectures. Recall that CAM produces a localization map for an image classification CNN with a specific kind of architecture where global average pooled convolutional feature maps are fed directly into softmax. Specifically, let the penultimate layer produce feature maps, , with each element indexed by . So refers to the activation at location of the feature map . These feature maps are then spatially pooled using Global Average Pooling (GAP) and linearly transformed to produce a score for each class ,
本节讨论 Grad-CAM 与类激活映射(CAM) [59] 的联系,并形式证明 Grad-CAM 对多种基于 CNN 的结构推广了 CAM。回顾 CAM 为一种特定结构的图像分类 CNN 生成定位图:全局平均池化后的卷积特征图直接送入 softmax。具体地,设倒数第二层产生 张特征图 ,元素由 索引,故 指特征图 在位置 的激活。这些特征图经全局平均池化(GAP)空间池化后再线性变换,得到各类别 的分数 ,
Let us define to be the global average pooled output,
定义 为全局平均池化输出,
CAM computes the final scores by,
CAM 按如下计算最终分数,
where is the weight connecting the feature map with the class. Taking the gradient of the score for class c () with respect to the feature map we get,
其中 是连接第 张特征图与第 类的权重。取类别 分数()相对特征图 的梯度,得到
Taking partial derivative of (4) w.r.t. , we can see that . Substituting this in (6), we get,
对 (4) 相对 求偏导,可见 。代入 (6),得到
$$\frac{\partial Y^{c}}{\partial F^{k}}=\frac{\partial Y^{c}}{\partial A_{ij}^{k}}\cdot Z\
\tag{7}$$
From (5) we get that, . Hence,
由 (5) 得 。于是
$$w_{k}^{c}=Z\cdot\frac{\partial Y^{c}}{\partial A_{ij}^{k}}\
\tag{8}$$
Summing both sides of (8) over all pixels ,
对 (8) 两边在所有像素 上求和,
Since and do not depend on , rewriting this as
由于 与 不依赖 ,可改写为
Note that is the number of pixels in the feature map (or ). Thus, we can re-order terms and see that
注意 是特征图像素数(或 )。于是可重排项得到
$$w^{c}{k}=\sum{i}\sum_{j}\frac{\partial Y^{c}}{\partial A^{k}_{ij}}\
\tag{11}$$
Up to a proportionality constant () that gets normalized-out during visualization, the expression for is identical to used by Grad-CAM (1). Thus, Grad-CAM is a strict generalization of CAM. This generalization allows us to generate visual explanations from CNN-based models that cascade convolutional layers with much more complex interactions, such as those for image captioning and VQA (Sec. 8.2).
至多相差可视化时会被归一掉的比例常数(), 的表达式与 Grad-CAM (1) 所用的 相同。因此 Grad-CAM 是 CAM 的严格推广。该推广使我们能为级联更复杂交互卷积层的基于 CNN 的模型生成视觉解释,例如图像描述与 VQA(第 8.2 节)。
3.2 Guided Grad-CAM
While Grad-CAM is class-discriminative and localizes relevant image regions, it lacks the ability to highlight fine-grained details like pixel-space gradient visualization methods (Guided Backpropagation [53], Deconvolution [57]). Guided Backpropagation visualizes gradients with respect to the image where negative gradients are suppressed when backpropagating through ReLU layers. Intuitively, this aims to capture pixels detected by neurons, not the ones that suppress neurons. See Figure 1c, where Grad-CAM can easily localize the cat; however, it is unclear from the coarse heatmap why the network predicts this particular instance as ‘tiger cat’. In order to combine the best aspects of both, we fuse Guided Backpropagation and Grad-CAM visualizations via element-wise multiplication ( is first upsampled to the input image resolution using bilinear interpolation). Fig. 2 bottom-left illustrates this fusion. This visualization is both high-resolution (when the class of interest is ‘tiger cat’, it identifies important ‘tiger cat’ features like stripes, pointy ears and eyes) and class-discriminative (it highlights the ‘tiger cat’ but not the ‘boxer (dog)’). Replacing Guided Backpropagation with Deconvolution gives similar results, but we found Deconvolution visualizations to have artifacts and Guided Backpropagation to be generally less noisy.
虽然 Grad-CAM 类区分并能定位相关图像区域,却缺乏像像素空间梯度可视化方法(Guided Backpropagation [53]、Deconvolution [57])那样高亮细粒度细节的能力。Guided Backpropagation 可视化相对图像的梯度,并在经 ReLU 层反传时抑制负梯度。直观上,这旨在捕捉神经元检测到的像素,而非抑制神经元的像素。见图 1c:Grad-CAM 能轻松定位猫;但从粗热图看不清网络为何把该实例预测为「虎猫」。为兼得两者之长,我们通过逐元素相乘融合 Guided Backpropagation 与 Grad-CAM 可视化(先用双线性插值把 上采样到输入图像分辨率)。图 2 左下示意该融合。该可视化既高分辨率(当感兴趣类为「虎猫」时,识别条纹、尖耳与眼睛等重要「虎猫」特征),又类区分(高亮「虎猫」而非「拳师犬」)。用 Deconvolution 替换 Guided Backpropagation 结果类似,但我们发现 Deconvolution 可视化有伪影,Guided Backpropagation 通常噪声更少。
3.3 Counterfactual Explanations
3.3 反事实解释
Using a slight modification to Grad-CAM, we can obtain explanations that highlight support for regions that would make the network change its prediction. As a consequence, removing concepts occurring in those regions would make the model more confident about its prediction. We refer to this explanation modality as counterfactual explanations.
对 Grad-CAM 稍作修改,可得到高亮那些若改变会使网络改变预测的区域支撑的解释。因此,去掉这些区域中出现的概念会使模型对其预测更有信心。我们称这种解释模态为反事实解释。
Specifically, we negate the gradient of (score for class ) with respect to feature maps of a convolutional layer. Thus the importance weights now become
具体地,我们对 (类别 的分数)相对卷积层特征图 的梯度取负。于是重要性权重 变为
As in (2), we take a weighted sum of the forward activation maps, , with weights , and follow it by a ReLU to obtain counterfactual explanations as shown in Fig. 3.
如 (2),用权重 对前向激活图 做加权和,再接 ReLU,得到如图 3 所示的反事实解释。
(a) Original Image
(a) 原图
4 Evaluating Localization Ability of Grad-CAM
4 评估 Grad-CAM 的定位能力
4.1 Weakly-supervised Localization
4.1 弱监督定位
In this section, we evaluate the localization capability of Grad-CAM in the context of image classification. The ImageNet localization challenge [14] requires approaches to provide bounding boxes in addition to classification labels. Similar to classification, evaluation is performed for both the top-1 and top-5 predicted categories.
本节在图像分类语境下评估 Grad-CAM 的定位能力。ImageNet 定位挑战 [14] 要求方法在分类标签之外提供边界框。与分类类似,对 top-1 与 top-5 预测类别都做评估。
Given an image, we first obtain class predictions from our network and then generate Grad-CAM maps for each of the predicted classes and binarize them with a threshold of 15% of the max intensity. This results in connected segments of pixels and we draw a bounding box around the single largest segment. Note that this is weakly-supervised localization – the models were never exposed to bounding box annotations during training.
给定图像,我们先从网络得到类别预测,再为每个预测类生成 Grad-CAM 图,并以最大强度的 15% 为阈值二值化。得到连通像素段后,我们在单个最大段周围画边界框。注意这是弱监督定位——模型训练时从未见过边界框标注。
We evaluate Grad-CAM localization with off-the-shelf pretrained VGG-16 [52] , AlexNet [33] and GoogleNet [54] (obtained from the Caffe [27] Zoo). Following ILSVRC-15 evaluation, we report both top-1 and top-5 localization errors on the val set in Table. 1. Grad-CAM localization errors are significantly better than those achieved by c-MWP [58] and Simonyan et al. [51], which use grab-cut to post-process image space gradients into heat maps. Grad-CAM for VGG-16 also achieves better top-1 localization error than CAM [59], which requires a change in the model architecture, necessitates re-training and thereby achieves worse classification errors (2.98% worse top-1), while Grad-CAM does not compromise on classification performance.
我们用现成的预训练 VGG-16 [52]、AlexNet [33] 与 GoogleNet [54](来自 Caffe [27] Zoo)评估 Grad-CAM 定位。按 ILSVRC-15 评估,在验证集上报告 top-1 与 top-5 定位误差,见表 1。Grad-CAM 定位误差显著优于使用 grab-cut 把图像空间梯度后处理成热图的 c-MWP [58] 与 Simonyan et al. [51]。VGG-16 上的 Grad-CAM 的 top-1 定位误差也优于 CAM [59];后者需改模型结构并重新训练,从而分类误差更差(top-1 差 2.98%),而 Grad-CAM 不牺牲分类性能。
| Classification | Localization | |||||
|---|---|---|---|---|---|---|
| Top- | Top- | Top- | Top- | |||
| VGG-16 | Backprop [51] | |||||
| c-MWP [58] | ||||||
| Grad-CAM (ours) | ||||||
| CAM [59] | ||||||
| AlexNet | c-MWP [58] | |||||
| Grad-CAM (ours) | ||||||
| GoogleNet | Grad-CAM (ours) | |||||
| CAM [59] |
Table 1: Classification and localization error % on ILSVRC-15 val (lower is better) for VGG-16, AlexNet and GoogleNet. We see that Grad-CAM achieves superior localization errors without compromising on classification performance.
| 分类 | 定位 | |||||
|---|---|---|---|---|---|---|
| Top- | Top- | Top- | Top- | |||
| VGG-16 | Backprop [51] | |||||
| c-MWP [58] | ||||||
| Grad-CAM (ours) | ||||||
| CAM [59] | ||||||
| AlexNet | c-MWP [58] | |||||
| Grad-CAM (ours) | ||||||
| GoogleNet | Grad-CAM (ours) | |||||
| CAM [59] |
表 1:VGG-16、AlexNet 与 GoogleNet 在 ILSVRC-15 val 上的分类与定位误差 %(越低越好)。可见 Grad-CAM 在不牺牲分类性能的前提下取得更优定位误差。
4.2 Weakly-supervised Segmentation
4.2 弱监督分割
Semantic segmentation involves the task of assigning each pixel in the image an object class (or background class). Being a challenging task, this requires expensive pixel-level annotation. The task of weakly-supervised segmentation involves segmenting objects with just image-level annotation, which can be obtained relatively cheaply from image classification datasets. In recent work, Kolesnikov et al. [32] introduced a new loss function for training weakly-supervised image segmentation models. Their loss function is based on three principles – 1) to seed with weak localization cues, encouraging segmentation network to match these cues, 2) to expand object seeds to regions of reasonable size based on information about which classes can occur in an image, 3) to constrain segmentations to object boundaries that alleviates the problem of imprecise boundaries already at training time. They showed that their proposed loss function, consisting of the above three losses leads to better segmentation.
语义分割要把图像每个像素赋给某一物体类(或背景类)。任务具有挑战性,需要昂贵的像素级标注。弱监督分割则仅用图像级标注分割物体,这类标注可相对廉价地从图像分类数据集获得。近期工作中,Kolesnikov et al. [32] 为训练弱监督图像分割模型引入新损失函数。其损失基于三原则——1)用弱定位线索播种,鼓励分割网络匹配这些线索;2)根据图像中可能出现的类别信息,把物体种子扩展到合理大小区域;3)把分割约束到物体边界,在训练阶段就缓解边界不精确。他们表明由上述三项损失组成的损失函数可带来更好分割。
However, their algorithm is sensitive to the choice of weak localization seed, without which the network fails to localize objects correctly. In their work, they used CAM maps from a VGG-16 based network which are used as object seeds for weakly localizing foreground classes. We replaced the CAM maps with Grad-CAM obtained from a standard VGG-16 network and obtain a Intersection over Union (IoU) score of 49.6 (compared to 44.6 obtained with CAM) on the PASCAL VOC 2012 segmentation task. Fig. 4 shows some qualitative results.
但该算法对弱定位种子的选择敏感,没有合适种子时网络无法正确定位物体。文中用基于 VGG-16 网络的 CAM 图作为前景类弱定位的物体种子。我们把 CAM 图换成来自标准 VGG-16 的 Grad-CAM,在 PASCAL VOC 2012 分割任务上得到交并比(IoU)49.6(CAM 为 44.6)。图 4 给出部分定性结果。
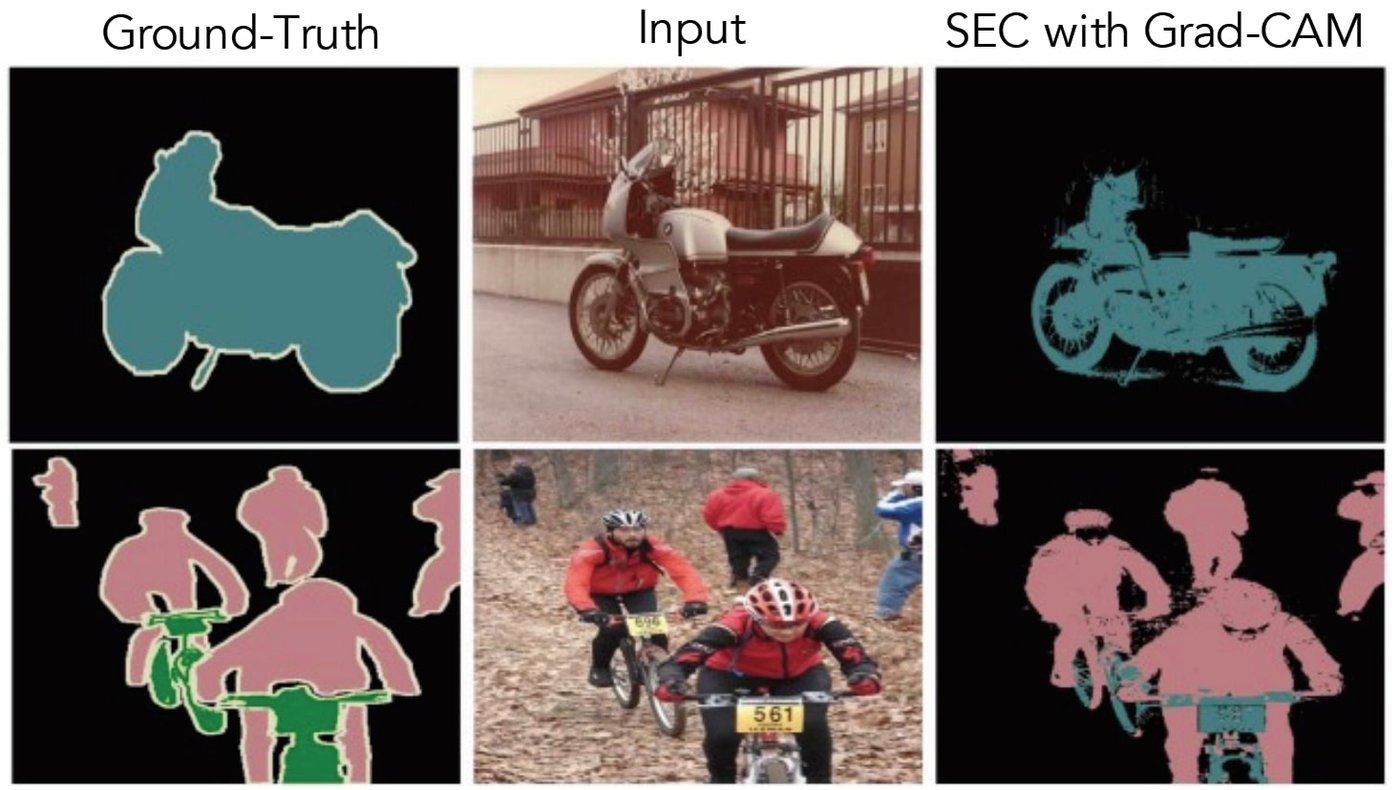
Figure 4: PASCAL VOC 2012 Segmentation results with Grad-CAM as seed for SEC [32].
图 4:以 Grad-CAM 作为 SEC [32] 种子的 PASCAL VOC 2012 分割结果。
(a) Raw input image. Note that this is not a part of the tasks (b) and (c)
(a) 原始输入图像。注意这不属于任务 (b) 与 (c)
4.3 Pointing Game
4.3 指点游戏
Zhang et al. [58] introduced the Pointing Game experiment to evaluate the discriminativeness of different visualization methods for localizing target objects in scenes. Their evaluation protocol first cues each visualization technique with the ground-truth object label and extracts the maximally activated point on the generated heatmap. It then evaluates if the point lies within one of the annotated instances of the target object category, thereby counting it as a hit or a miss.
Zhang et al. [58] 引入指点游戏实验,评估不同可视化方法在场景中定位目标物体的区分性。评估协议先用真实物体标签提示每种可视化技术,再提取生成热图上最大激活点,然后判断该点是否落在目标类别某一标注实例内,据此计为命中或未中。
The localization accuracy is then calculated as . However, this evaluation only measures precision of the visualization technique. We modify the protocol to also measure recall -- we compute localization maps for top-5 class predictions from the CNN classifiers[^4] and evaluate them using the pointing game setup with an additional option to reject any of the top-5 predictions from the model if the maximally activated point in the map is below a threshold, i.e. if the visualization correctly rejects the predictions which are absent from the ground-truth categories, it gets that as a hit. We find that Grad-CAM outperforms c-MWP [58] by a significant margin (70.58% vs. 60.30%). Qualitative examples comparing c-MWP [58] and Grad-CAM on can be found in Sec. D[^5].
定位准确率按 计算。但该评估只衡量可视化技术的精度。我们修改协议以同时衡量召回——为 CNN 分类器的 top-5 类预测计算定位图[^4],并在指点游戏设定下评估,额外允许在图中最大激活点低于阈值时拒绝任一 top-5 预测,即 若可视化正确拒绝真实类别中不存在的预测,则计为命中。我们发现 Grad-CAM 显著优于 c-MWP [58](70.58% 对 60.30%)。与 c-MWP [58] 对比的定性例子见第 D 节[^5]。
5 Evaluating Visualizations
5 评估可视化
In this section, we describe the human studies and experiments we conducted to understand the interpretability vs. faithfulness tradeoff of our approach to model predictions. Our first human study evaluates the main premise of our approach – are Grad-CAM visualizations more class discriminative than previous techniques? Having established that, we turn to understanding whether it can lead an end user to trust the visualized models appropriately. For these experiments, we compare VGG-16 and AlexNet finetuned on PASCAL VOC 2007 train and visualizations evaluated on val.
本节描述我们为理解方法对模型预测的可解释性与忠实性权衡而开展的人体实验与实验。第一项人体实验评估方法的主要前提——Grad-CAM 可视化是否比先前技术更类区分?确立之后,我们转向理解它能否引导终端用户恰当地信任被可视化模型。这些实验比较在 PASCAL VOC 2007 训练集上微调的 VGG-16 与 AlexNet,并在验证集上评估可视化。
5.1 Evaluating Class Discrimination
5.1 评估类区分性
In order to measure whether Grad-CAM helps distinguish between classes, we select images from the PASCAL VOC 2007 val set, which contain exactly annotated categories and create visualizations for each one of them. For both VGG-16 and AlexNet CNNs, we obtain category-specific visualizations using four techniques: Deconvolution, Guided Backpropagation, and Grad-CAM versions of each of these methods (Deconvolution Grad-CAM and Guided Grad-CAM). We show these visualizations to 43 workers on Amazon Mechanical Turk (AMT) and ask them “Which of the two object categories is depicted in the image?” (shown in Fig. 5).
为衡量 Grad-CAM 是否有助于区分类别,我们从 PASCAL VOC 2007 验证集选取恰好含 个标注类别的图像,并为每个类别创建可视化。对 VGG-16 与 AlexNet CNN,我们用四种技术得到类别特定可视化:Deconvolution、Guided Backpropagation,以及各自的 Grad-CAM 版本(Deconvolution Grad-CAM 与 Guided Grad-CAM)。把这些可视化展示给 Amazon Mechanical Turk(AMT)上的 43 名工人,询问「图像描绘的是两个物体类别中的哪一个?」(见图 5)。
Intuitively, a good prediction explanation is one that produces discriminative visualizations for the class of interest. The experiment was conducted using all 4 visualizations for 90 image-category pairs (i.e. 360 visualizations); 9 ratings were collected for each image, evaluated against the ground truth and averaged to obtain the accuracy in Table. 2. When viewing Guided Grad-CAM, human subjects can correctly identify the category being visualized in % of cases (compared to % for Guided Backpropagation; thus, Grad-CAM improves human performance by %). Similarly, we also find that Grad-CAM helps make Deconvolution more class-discriminative (from % %). Guided Grad-CAM performs the best among all methods. Interestingly, our results indicate that Deconvolution is more class-discriminative than Guided Backpropagation (% vs. %), although Guided Backpropagation is more aesthetically pleasing. To the best of our knowledge, our evaluations are the first to quantify this subtle difference.
直观上,好的预测解释应对感兴趣类别产生区分性可视化。实验对 90 个图像—类别对使用全部 4 种可视化(即 360 张可视化);每张图收集 9 个评分,相对真实标签评估并平均,得到表 2 中的准确率。查看 Guided Grad-CAM 时,人类受试者在 % 的情形中能正确识别被可视化的类别(Guided Backpropagation 为 %;因而 Grad-CAM 把人类表现提升 %)。类似地,我们也发现 Grad-CAM 使 Deconvolution 更类区分(从 % %)。Guided Grad-CAM 在所有方法中表现最好。有趣的是,结果表明 Deconvolution 比 Guided Backpropagation 更类区分(% 对 %),尽管 Guided Backpropagation 更美观。据我们所知,我们的评估是首次量化这一细微差异。
| Method | Human Classification Accuracy | Relative Reliability | Rank Correlation w/ Occlusion |
|---|---|---|---|
| Guided Backpropagation | 44.44 | +1.00 | 0.168 |
| Guided Grad-CAM | 61.23 | +1.27 | 0.261 |
Table 2: Quantitative Visualization Evaluation. Guided Grad-CAM enables humans to differentiate between visualizations of different classes (Human Classification Accuracy) and pick more reliable models (Relative Reliability). It also accurately reflects the behavior of the model (Rank Correlation w/ Occlusion).
| 方法 | 人类分类准确率 | 相对可靠性 | 与遮挡的秩相关 |
|---|---|---|---|
| Guided Backpropagation | 44.44 | +1.00 | 0.168 |
| Guided Grad-CAM | 61.23 | +1.27 | 0.261 |
表 2:定量可视化评估。Guided Grad-CAM 使人类能区分不同类别的可视化(人类分类准确率)并挑选更可靠模型(相对可靠性)。它也准确反映模型行为(与遮挡的秩相关)。
5.2 Evaluating Trust
5.2 评估信任
Given two prediction explanations, we evaluate which seems more trustworthy. We use AlexNet and VGG-16 to compare Guided Backpropagation and Guided Grad-CAM visualizations, noting that VGG-16 is known to be more reliable than AlexNet with an accuracy of mAP (vs. mAP) on PASCAL classification. In order to tease apart the efficacy of the visualization from the accuracy of the model being visualized, we consider only those instances where both models made the same prediction as ground truth. Given a visualization from AlexNet and one from VGG-16, and the predicted object category, 54 AMT workers were instructed to rate the reliability of the models relative to each other on a scale of clearly more/less reliable (+/-), slightly more/less reliable (+/-), and equally reliable (). This interface is shown in Fig. 5. To eliminate any biases, VGG-16 and AlexNet were assigned to be ‘model-1’ with approximately equal probability. Remarkably, as can be seen in Table. 2, we find that human subjects are able to identify the more accurate classifier (VGG-16 over AlexNet) simply from the prediction explanations, despite both models making identical predictions. With Guided Backpropagation, humans assign VGG-16 an average score of which means that it is slightly more reliable than AlexNet, while Guided Grad-CAM achieves a higher score of which is closer to saying that VGG-16 is clearly more reliable. Thus, our visualizations can help users place trust in a model that generalizes better, just based on individual prediction explanations.
给定两个预测解释,我们评估哪个看起来更可信。用 AlexNet 与 VGG-16 比较 Guided Backpropagation 与 Guided Grad-CAM 可视化,并注意到 VGG-16 已知比 AlexNet 更可靠,在 PASCAL 分类上 mAP 为 (对 )。为把可视化效力与被可视化模型准确率拆开,我们只考虑两模型预测均与真实标签相同的实例。给定来自 AlexNet 与来自 VGG-16 的可视化以及预测物体类别,54 名 AMT 工人被要求在「明显更/更不可靠」(+/-)、「略微更/更不可靠」(+/-)与「同样可靠」()的尺度上,相对彼此评定模型可靠性。界面见图 5。为消除偏差,VGG-16 与 AlexNet 以约相等概率被标为「模型-1」。如表 2 所示,令人惊讶的是,人类受试者仅从预测解释就能识别更准确的分类器(VGG-16 优于 AlexNet),尽管两模型做出相同预测。用 Guided Backpropagation 时,人类给 VGG-16 平均分 ,表示略优于 AlexNet;Guided Grad-CAM 得到更高分 ,更接近「明显更可靠」。因此我们的可视化可以帮助用户仅凭单次预测解释,就把信任放在泛化更好的模型上。
5.3 Faithfulness vs. Interpretability
5.3 忠实性 与 可解释性
Faithfulness of a visualization to a model is its ability to accurately explain the function learned by the model. Naturally, there exists a trade-off between the interpretability and faithfulness of a visualization – a more faithful visualization is typically less interpretable and vice versa. In fact, one could argue that a fully faithful explanation is the entire description of the model, which in the case of deep models is not interpretable/easy to visualize. We have verified in previous sections that our visualizations are reasonably interpretable. We now evaluate how faithful they are to the underlying model. One expectation is that our explanations should be locally accurate, i.e. in the vicinity of the input data point, our explanation should be faithful to the model [47].
可视化对模型的忠实性,是其准确解释模型所学函数的能力。自然地,可解释性与忠实性之间存在权衡——更忠实的可视化通常更不可解释,反之亦然。事实上,可以说完全忠实的解释就是对模型的完整描述,而对深度模型而言这并不可解释/不易可视化。前几节已验证我们的可视化相当可解释。现在评估它们对底层模型有多忠实。一个期望是解释应局部准确,即 在输入数据点邻域内,解释应对模型忠实 [47]。
For comparison, we need a reference explanation with high local-faithfulness. One obvious choice for such a visualization is image occlusion [57], where we measure the difference in CNN scores when patches of the input image are masked. Interestingly, patches which change the CNN score are also patches to which Grad-CAM and Guided Grad-CAM assign high intensity, achieving rank correlation and (vs. , and achieved by Guided Backpropagation, c-MWP and CAM respectively) averaged over 2510 images in the PASCAL 2007 val set. This shows that Grad-CAM is more faithful to the original model compared to prior methods. Through localization experiments and human studies, we see that Grad-CAM visualizations are more interpretable, and through correlation with occlusion maps, we see that Grad-CAM is more faithful to the model.
为比较,我们需要具有高局部忠实性的参考解释。一个显然选择是图像遮挡 [57]:测量输入图像块被遮罩时 CNN 分数的差异。有趣的是,改变 CNN 分数的块也正是 Grad-CAM 与 Guided Grad-CAM 赋高强度的块,在 PASCAL 2007 验证集 2510 张图像上平均秩相关为 与 (Guided Backpropagation、c-MWP 与 CAM 分别为 、 与 )。这表明 Grad-CAM 比先前方法更忠实于原模型。通过定位实验与人体研究,我们看到 Grad-CAM 可视化更可解释;通过与遮挡图的相关,我们看到 Grad-CAM 更忠实于模型。
6 Diagnosing image classification CNNs with Grad-CAM
6 用 Grad-CAM 诊断图像分类 CNN
In this section we further demonstrate the use of Grad-CAM in analyzing failure modes of image classification CNNs, understanding the effect of adversarial noise, and identifying and removing biases in datasets, in the context of VGG-16 pretrained on imagenet.
本节进一步展示 Grad-CAM 在分析图像分类 CNN 失败模式、理解对抗噪声影响、以及识别并去除数据集偏差方面的用途,语境为在 ImageNet 上预训练的 VGG-16。
6.1 Analyzing failure modes for VGG-16
6.1 分析 VGG-16 的失败模式
(a)
In order to see what mistakes a network is making, we first get a list of examples that the network (VGG-16) fails to classify correctly. For these misclassified examples, we use Guided Grad-CAM to visualize both the correct and the predicted class. As seen in Fig. 6, some failures are due to ambiguities inherent in ImageNet classification. We can also see that seemingly unreasonable predictions have reasonable explanations, an observation also made in HOGgles [56]. A major advantage of Guided Grad-CAM visualizations over other methods is that due to its high-resolution and ability to be class-discriminative, it readily enables these analyses.
为看清网络犯了哪些错,我们先列出网络(VGG-16)未能正确分类的例子。对这些误分类例子,用 Guided Grad-CAM 同时可视化正确类与预测类。如图 6,部分失败源于 ImageNet 分类固有的歧义。也可看到看似不合理的预测其实有合理解释,HOGgles [56] 中也有类似观察。Guided Grad-CAM 相对其他方法的一大优势是:因其高分辨率与类区分能力,能轻易支持这些分析。
6.2 Effect of adversarial noise on VGG-16
6.2 对抗噪声对 VGG-16 的影响
Goodfellow et al. [22] demonstrated the vulnerability of current deep networks to adversarial examples, which are slight imperceptible perturbations of input images that fool the network into misclassifying them with high confidence. We generate adversarial images for an ImageNet-pretrained VGG-16 model such that it assigns high probability () to a category that is not present in the image and low probabilities to categories that are present. We then compute Grad-CAM visualizations for the categories that are present. As shown in Fig. 7, despite the network being certain about the absence of these categories (‘tiger cat’ and ‘boxer’), Grad-CAM visualizations can correctly localize them. This shows that Grad-CAM is fairly robust to adversarial noise.
Goodfellow et al. [22] 展示了当前深度网络对对抗样本的脆弱性:对输入图像施加轻微、不可察觉的扰动,即可高置信度地骗过网络误分类。我们为 ImageNet 预训练的 VGG-16 生成对抗图像,使其对图像中不存在的类别赋高概率(),对存在的类别赋低概率。然后为存在的类别计算 Grad-CAM 可视化。如图 7,尽管网络确信这些类别(「虎猫」与「拳师犬」)不存在,Grad-CAM 可视化仍能正确定位它们。这表明 Grad-CAM 对对抗噪声相当稳健。
Boxer: 0.4 Cat: 0.2
Airliner: 0.9999
Boxer: 1.1e-20
Tiger Cat: 6.5e-17
Airliner: 0.9999
Space shuttle: 1e-5
(a) Original image
Boxer: 0.4 Cat: 0.2
Airliner: 0.9999
Boxer: 1.1e-20
Tiger Cat: 6.5e-17
Airliner: 0.9999
Space shuttle: 1e-5
(a) 原图
6.3 Identifying bias in dataset
6.3 识别数据集偏差
In this section, we demonstrate another use of Grad-CAM: identifying and reducing bias in training datasets. Models trained on biased datasets may not generalize to real-world scenarios, or worse, may perpetuate biases and stereotypes (w.r.t. gender, race, age, etc.). We finetune an ImageNet-pretrained VGG-16 model for a “doctor” vs. “nurse” binary classification task. We built our training and validation splits using the top relevant images (for each class) from a popular image search engine. And the test set was controlled to be balanced in its distribution of genders across the two classes. Although the trained model achieves good validation accuracy, it does not generalize well (% test accuracy).
本节展示 Grad-CAM 的另一用途:识别并减少训练数据集中的偏差。在有偏数据集上训练的模型可能无法泛化到真实场景,更糟的是可能延续偏见与刻板印象(相对性别、种族、年龄 等)。我们为「医生」对「护士」二分类任务微调 ImageNet 预训练的 VGG-16。训练集与验证集用某流行图像搜索引擎每类 top 相关图像构建;测试集则控制两类别间性别分布均衡。尽管训练模型验证准确率不错,泛化却不好(测试准确率 %)。
Grad-CAM visualizations of the model predictions (see the red box[^6] regions in the middle column of Fig. 8) revealed that the model had learned to look at the person’s face / hairstyle to distinguish nurses from doctors, thus learning a gender stereotype. Indeed, the model was misclassifying several female doctors to be a nurse and male nurses to be a doctor. Clearly, this is problematic. Turns out the image search results were gender-biased (78% of images for doctors were men, and 93% images for nurses were women).
模型预测的 Grad-CAM 可视化(见图 8 中列红框[^6]区域)显示,模型学会看人脸/发型来区分护士与医生,从而学到性别刻板印象。确实,模型把多名女医生误分为护士、把男护士误分为医生。这显然有问题。原来图像搜索结果存在性别偏差(医生图像中 78% 为男性,护士图像中 93% 为女性)。
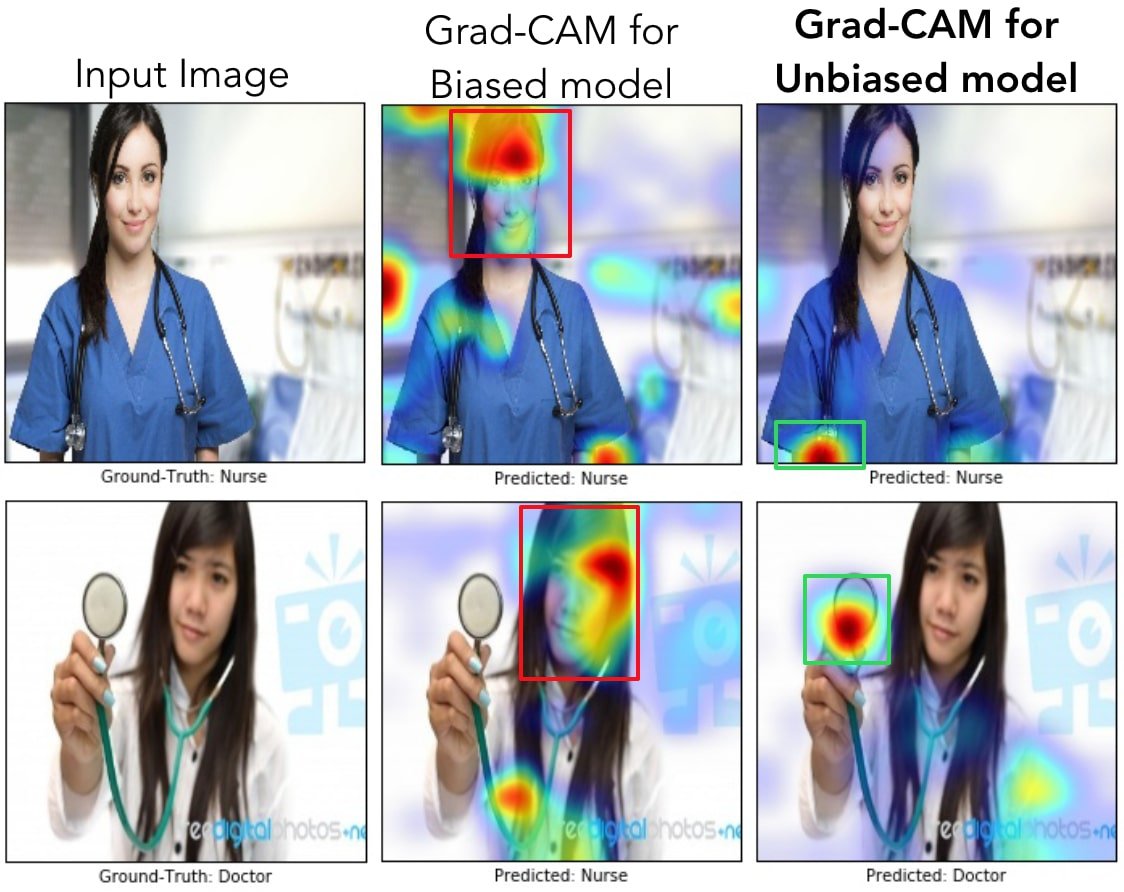
Figure 8: In the first row, we can see that even though both models made the right decision, the biased model (model1) was looking at the face of the person to decide if the person was a nurse, whereas the unbiased model was looking at the short sleeves to make the decision. For the example image in the second row, the biased model made the wrong prediction (misclassifying a doctor as a nurse) by looking at the face and the hairstyle, whereas the unbiased model made the right prediction looking at the white coat, and the stethoscope.
图 8:第一行可见,尽管两模型都做了正确决策,有偏模型(model1)看人脸判断是否为护士,无偏模型则看短袖做决策。第二行示例中,有偏模型看脸与发型做出错误预测(把医生误分为护士),无偏模型则看白大褂与听诊器做出正确预测。
Through these intuitions gained from Grad-CAM visualizations, we reduced bias in the training set by adding in images of male nurses and female doctors, while maintaining the same number of images per class as before. The re-trained model not only generalizes better (% test accuracy), but also looks at the right regions (last column of Fig. 8). This experiment demonstrates a proof-of-concept that Grad-CAM can help detect and remove biases in datasets, which is important not just for better generalization, but also for fair and ethical outcomes as more algorithmic decisions are made in society.
借助 Grad-CAM 可视化获得的这些直觉,我们在训练集中加入男护士与女医生图像以减少偏差,同时保持每类图像数不变。重训模型不仅泛化更好(测试准确率 %),也关注正确区域(图 8 最后一列)。该实验给出概念验证:Grad-CAM 可帮助检测并去除数据集偏差;这不仅对更好泛化重要,也随着社会中越来越多算法决策出现,对公平与伦理结果至关重要。
7 Textual Explanations with Grad-CAM
7 用 Grad-CAM 做文本解释
(a)
Equation. (1) gives a way to obtain neuron-importance, , for each neuron in a convolutional layer for a particular class. There have been hypotheses presented in the literature [60, 57] that neurons act as concept ‘detectors’. Higher positive values of the neuron importance indicate that the presence of that concept leads to an increase in the class score, whereas higher negative values indicate that its absence leads to an increase in the score for the class.
公式 (1) 给出获取卷积层中每个神经元对特定类别的神经元重要性 的方式。文献中已有假说 [60, 57] 认为神经元充当概念「检测器」。神经元重要性更高的正值表示该概念的出现会导致类分数上升;更高的负值表示其缺失会导致该类分数上升。
Given this intuition, let’s examine a way to generate textual explanations. In recent work, Bau et al. [4] proposed an approach to automatically name neurons in any convolutional layer of a trained network. These names indicate concepts that the neuron looks for in an image. Using their approach. we first obtain neuron names for the last convolutional layer. Next, we sort and obtain the top-5 and bottom-5 neurons based on their class-specific importance scores, . The names for these neurons can be used as text explanations.
基于这一直觉,我们考察一种生成文本解释的方式。近期工作中,Bau et al. [4] 提出自动命名已训练网络任意卷积层中神经元的方法。这些名称指示神经元在图像中寻找的概念。用他们的方法,我们先得到最后卷积层的神经元名称。再按类特定重要性分数 排序,取 top-5 与 bottom-5 神经元。这些神经元的名称可用作文本解释。
Fig. 9 shows some examples of visual and textual explanations for the image classification model (VGG-16) trained on the Places365 dataset [61]. In (a), the positively important neurons computed by (1) look for intuitive concepts such as book and shelf that are indicative of the class ‘Book-store’. Also note that the negatively important neurons look for concepts such as sky, road, water and car which don’t occur in ‘Book-store’ images. In (b), for predicting ‘waterfall’, both visual and textual explanations highlight ‘water’ and ‘stratified’ which are descriptive of ‘waterfall’ images. (e) is a failure case due to misclassification as the network predicted ‘rope-bridge’ when there is no rope, but still the important concepts (water and bridge) are indicative of the predicted class. In (f), while Grad-CAM correctly looks at the door and the staircase on the paper to predict ‘Elevator door’, the neurons detecting doors did not pass the IoU threshold[^7] of 0.05 (chosen in order to suppress the noise in the neuron names), and hence are not part of the textual explanations. More qualitative examples can be found in the Sec. F.
图 9 给出在 Places365 数据集 [61] 上训练的图像分类模型(VGG-16)的若干视觉与文本解释例子。(a) 中,由 (1) 计算的正向重要神经元寻找书、书架等直观概念,指示「书店」类。也注意负向重要神经元寻找天空、道路、水与车等在「书店」图像中不出现的概念。(b) 中,预测「瀑布」时,视觉与文本解释都高亮「水」与「层状」,描述「瀑布」图像。(e) 是因误分类导致的失败:网络预测「绳桥」但并无绳,重要概念(水与桥)仍指示预测类。(f) 中,Grad-CAM 正确看向门与纸上的楼梯以预测「电梯门」,但检测门的神经元未通过 IoU 阈值[^7] 0.05(为抑制神经元名称噪声而选取),因而未进入文本解释。更多定性例子见第 F 节。
(a) Image captioning explanations
(a) 图像描述解释
(a)
8 Grad-CAM for Image Captioning and VQA
8 面向图像描述与 VQA 的 Grad-CAM
Finally, we apply Grad-CAM to vision & language tasks such as image captioning [7, 29, 55] and Visual Question Answering (VQA) [3, 20, 42, 46]. We find that Grad-CAM leads to interpretable visual explanations for these tasks as compared to baseline visualizations which do not change noticeably across changing predictions. Note that existing visualization techniques either are not class-discriminative (Guided Backpropagation, Deconvolution), or simply cannot be used for these tasks/architectures, or both (CAM, c-MWP).
最后,我们将 Grad-CAM 用于图像描述 [7, 29, 55] 与视觉问答(VQA) [3, 20, 42, 46] 等视觉与语言任务。我们发现相对预测变化时几乎不变的基线可视化,Grad-CAM 能为这些任务带来可解释的视觉解释。注意现有可视化技术要么不是类区分的(Guided Backpropagation、Deconvolution),要么根本无法用于这些任务/结构,或两者皆是(CAM、c-MWP)。
8.1 Image Captioning
8.1 图像描述
In this section, we visualize spatial support for an image captioning model using Grad-CAM. We build Grad-CAM on top of the publicly available neuraltalk2[^8] implementation [31] that uses a finetuned VGG-16 CNN for images and an LSTM-based language model. Note that this model does not have an explicit attention mechanism. Given a caption, we compute the gradient of its log probability w.r.t. units in the last convolutional layer of the CNN ( for VGG-16) and generate Grad-CAM visualizations as described in Sec. 3. See Fig. 10(a). In the first example, Grad-CAM maps for the generated caption localize every occurrence of both the kites and people despite their relatively small size. In the next example, Grad-CAM correctly highlights the pizza and the man, but ignores the woman nearby, since ‘woman’ is not mentioned in the caption. More examples are in Sec. C.
本节用 Grad-CAM 可视化图像描述模型的空间支撑。我们在公开的 neuraltalk2[^8] 实现 [31] 上构建 Grad-CAM,该实现对图像用微调的 VGG-16 CNN,对语言用基于 LSTM 的语言模型。注意该模型没有显式注意力机制。给定一条描述,我们计算其对数概率相对 CNN 最后卷积层单元(VGG-16 的 )的梯度,并按第 3 节生成 Grad-CAM 可视化。见图 10(a)。第一例中,尽管风筝与人都相对较小,生成描述的 Grad-CAM 图仍定位到它们的每次出现。下一例中,Grad-CAM 正确高亮披萨与男人,但忽略附近的女人,因为描述未提及「女人」。更多例子见第 C 节。
Comparison to dense captioning. Johnson et al. [29] recently introduced the Dense Captioning (DenseCap) task that requires a system to jointly localize and caption salient regions in a given image. Their model consists of a Fully Convolutional Localization Network (FCLN) that produces bounding boxes for regions of interest and an LSTM-based language model that generates associated captions, all in a single forward pass. Using DenseCap, we generate 5 region-specific captions per image with associated ground truth bounding boxes. Grad-CAM for a whole-image captioning model (neuraltalk2) should localize the bounding box the region-caption was generated for, which is shown in Fig. 10(b). We quantify this by computing the ratio of mean activation inside vs. outside the box. Higher ratios are better because they indicate stronger attention to the region the caption was generated for. Uniformly highlighting the whole image results in a baseline ratio of whereas Grad-CAM achieves . Adding high-resolution detail gives an improved baseline of 0.08 (Guided Backpropagation) and the best localization at 0.99 (Guided Grad-CAM). Thus, Grad-CAM is able to localize regions in the image that the DenseCap model describes, even though the holistic captioning model was never trained with bounding-box annotations.
与稠密描述对比。Johnson et al. [29] 最近提出稠密描述(DenseCap)任务,要求系统联合定位并描述给定图像中的显著区域。其模型含全卷积定位网络(FCLN)为感兴趣区域生成边界框,以及基于 LSTM 的语言模型生成关联描述,均在单次前向中完成。用 DenseCap,我们每张图生成 5 条区域特定描述及关联真实边界框。面向整图描述模型(neuraltalk2)的 Grad-CAM 应定位生成该区域描述的边界框,见图 10(b)。我们用框内对框外平均激活之比量化;比值越高越好,因为表示对生成描述的区域注意力更强。均匀高亮整图得到基线比值 ,而 Grad-CAM 达到 。加入高分辨率细节后,基线升至 0.08(Guided Backpropagation),最佳定位为 0.99(Guided Grad-CAM)。因此,即使整体描述模型从未用边界框标注训练,Grad-CAM 也能定位 DenseCap 模型所描述的图像区域。
8.1.1 Grad-CAM for individual words of caption
In our experiment we use the Show and Tell model [55] pre-trained on MSCOCO without fine-tuning through the visual representation obtained from Inception [54] architecture. In order to obtain Grad-CAM map for individual words in the ground-truth caption we one-hot encode each of the visual words at the corresponding time-steps and compute the neuron importance score using Eq. (1) and combine with the convolution feature maps using Eq. (2).
8.1.1 面向描述中单个词的 Grad-CAM
实验中我们使用在 MSCOCO 上预训练、未再经 Inception [54] 视觉表示微调的 Show and Tell 模型 [55]。为得到真实描述中单个词的 Grad-CAM 图,我们在对应时间步对每个视觉词做 one-hot 编码,用公式 (1) 计算神经元重要性分数,并用公式 (2) 与卷积特征图组合。
Comparison to Human Attention We manually created an object category to word mapping that maps object categories like person to a list of potential fine-grained labels like [“child”, “man”, "woman", …]. We map a total of 830 visual words existing in COCO captions to 80 COCO categories. We then use the segmentation annotations for the 80 categories as human attention for this subset of matching words.
与人类注意力对比。 我们手工建立物体类别到词的映射,把 person 这类物体类别映射到潜在细粒度标签列表,如 [“child”, “man”, "woman", …]。共把 COCO 描述中 830 个视觉词映射到 80 个 COCO 类别。然后用这 80 类的分割标注,作为匹配词子集的人类注意力。
We then use the pointing evaluation from [58]. For each visual word from the caption, we generate the Grad-CAM map and then extract the maximally activated point. We then evaluate if the point lies within the human attention mapsegmentation for the corresponding COCO category, thereby counting it as a hit or a miss. The pointing accuracy is then calculated as . We perform this experiment on 1000 randomly sampled images from COCO dataset and obtain an accuracy of 30.0%. Some qualitative examples can be found in Fig. 11.
随后使用 [58] 的指点评估。对描述中每个视觉词,生成 Grad-CAM 图并提取最大激活点,再判断该点是否落在对应 COCO 类别的人类注意力图/分割内,据此计为命中或未中。指点准确率按 计算。我们在 COCO 数据集随机抽样的 1000 张图像上做该实验,准确率 30.0%。部分定性例子见图 11。
8.2 Visual Question Answering
8.2 视觉问答
Typical VQA pipelines [3, 20, 42, 46] consist of a CNN to process images and an RNN language model for questions. The image and the question representations are fused to predict the answer, typically with a -way classification ( being the size of the answer space). Since this is a classification problem, we pick an answer (the score in (3)) and use its score to compute Grad-CAM visualizations over the image to explain the answer. Despite the complexity of the task, involving both visual and textual components, the explanations (of the VQA model from Lu et al. [38]) described in Fig. 12 are surprisingly intuitive and informative. We quantify the performance of Grad-CAM via correlation with occlusion maps, as in Sec. 5.3. Grad-CAM achieves a rank correlation (with occlusion maps) of 0.60 0.038 whereas Guided Backpropagation achieves 0.42 0.038, indicating higher faithfulness of our Grad-CAM visualization.
典型 VQA 流水线 [3, 20, 42, 46] 用 CNN 处理图像、用 RNN 语言模型处理问题。图像与问题表示融合后预测答案,通常是 类分类( 为答案空间大小)。因这是分类问题,我们选取一个答案((3) 中的分数 ),用其分数在图像上计算 Grad-CAM 可视化以解释该答案。尽管任务复杂、同时涉及视觉与文本组件,图 12 所示(来自 Lu et al. [38] 的 VQA 模型)的解释仍出人意料地直观且信息丰富。我们像第 5.3 节那样用与遮挡图的相关量化 Grad-CAM 表现。Grad-CAM 与遮挡图的秩相关为 0.60 0.038,而 Guided Backpropagation 为 0.42 0.038,表明我们的 Grad-CAM 可视化更忠实。
(a) Visualizing VQA model from [38]
(a) 可视化 [38] 的 VQA 模型
Comparison to Human Attention. Das et al. [9] collected human attention maps for a subset of the VQA dataset [3]. These maps have high intensity where humans looked in the image in order to answer a visual question. Human attention maps are compared to Grad-CAM visualizations for the VQA model from [38] on 1374 val question-image (QI) pairs from [3] using the rank correlation evaluation protocol as in [9]. Grad-CAM and human attention maps have a correlation of 0.136, which is higher than chance or random attention maps (zero correlation). This shows that despite not being trained on grounded image-text pairs, even non-attention based CNN + LSTM based VQA models are surprisingly good at localizing regions for predicting a particular answer.
与人类注意力对比。Das et al. [9] 为 VQA 数据集 [3] 的一个子集收集了人类注意力图。人类为回答视觉问题而注视的图像区域强度更高。按 [9] 的秩相关评估协议,在来自 [3] 的 1374 个验证问题—图像(QI)对上,将人类注意力图与 [38] 的 VQA 模型的 Grad-CAM 可视化比较。Grad-CAM 与人类注意力图相关为 0.136,高于偶然或随机注意力图(零相关)。这表明即使未在有根基的图文对上训练,非注意力的 CNN + LSTM 式 VQA 模型对预测特定答案的区域定位也出人意料地好。
Visualizing ResNet-based VQA model with co-attention. Lu et al. [39] use a 200 layer ResNet [24] to encode the image, and jointly learn a hierarchical attention mechanism on the question and image. Fig. 12(b) shows Grad-CAM visualizations for this network. As we visualize deeper layers of the ResNet, we see small changes in Grad-CAM for most adjacent layers and larger changes between layers that involve dimensionality reduction. More visualizations for ResNets can be found in Sec. G. To the best of our knowledge, we are the first to visualize decisions from ResNet-based models.
用协同注意力可视化基于 ResNet 的 VQA 模型。Lu et al. [39] 用 200 层 ResNet [24] 编码图像,并联合学习问题与图像上的层次注意力机制。图 12(b) 给出该网络的 Grad-CAM 可视化。随着可视化 ResNet 更深的层,多数相邻层之间 Grad-CAM 变化较小,而涉及降维的层之间变化较大。更多 ResNet 可视化见第 G 节。据我们所知,我们是首个可视化基于 ResNet 的模型决策的工作。
9 Conclusion
9 结论
In this work, we proposed a novel class-discriminative localization technique – Gradient-weighted Class Activation Mapping (Grad-CAM) – for making any CNN-based model more transparent by producing visual explanations. Further, we combined Grad-CAM localizations with existing high-resolution visualization techniques to obtain the best of both worlds – high-resolution and class-discriminative Guided Grad-CAM visualizations. Our visualizations outperform existing approaches on both axes – interpretability and faithfulness to original model. Extensive human studies reveal that our visualizations can discriminate between classes more accurately, better expose the trustworthiness of a classifier, and help identify biases in datasets. Further, we devise a way to identify important neurons through Grad-CAM and provide a way to obtain textual explanations for model decisions. Finally, we show the broad applicability of Grad-CAM to various off-the-shelf architectures for tasks such as image classification, image captioning and visual question answering. We believe that a true AI system should not only be intelligent, but also be able to reason about its beliefs and actions for humans to trust and use it. Future work includes explaining decisions made by deep networks in domains such as reinforcement learning, natural language processing and video applications.
本工作提出一种新颖的类区分定位技术——梯度加权类激活映射(Grad-CAM)——通过生成视觉解释使任意基于 CNN 的模型更透明。进一步,我们把 Grad-CAM 定位与已有高分辨率可视化技术结合,兼得两者之长——高分辨率且类区分的 Guided Grad-CAM 可视化。我们的可视化在可解释性与对原模型的忠实性两个轴上都超过现有方法。大量人体研究表明,我们的可视化能更准确地区分类别,更好地揭示分类器可信度,并帮助识别数据集偏差。此外,我们设计了通过 Grad-CAM 识别重要神经元并获得模型决策文本解释的方式。最后,我们展示 Grad-CAM 可广泛应用于图像分类、图像描述与视觉问答等任务的现成结构。我们相信真正的 AI 系统不仅应智能,还应能就其信念与行动给出理由,以便人类信任并使用。未来工作包括解释强化学习、自然语言处理与视频应用等领域深度网络的决策。
10 Acknowledgements
10 致谢
This work was funded in part by NSF CAREER awards to DB and DP, DARPA XAI grant to DB and DP, ONR YIP awards to DP and DB, ONR Grant N00014-14-1-0679 to DB, a Sloan Fellowship to DP, ARO YIP awards to DB and DP, an Allen Distinguished Investigator award to DP from the Paul G. Allen Family Foundation, ICTAS Junior Faculty awards to DB and DP, Google Faculty Research Awards to DP and DB, Amazon Academic Research Awards to DP and DB, AWS in Education Research grant to DB, and NVIDIA GPU donations to DB. The views and conclusions contained herein are those of the authors and should not be interpreted as necessarily representing the official policies or endorsements, either expressed or implied, of the U.S. Government, or any sponsor.
本工作部分由 NSF CAREER 奖(DB 与 DP)、DARPA XAI 资助(DB 与 DP)、ONR YIP 奖(DP 与 DB)、ONR 资助 N00014-14-1-0679(DB)、Sloan 研究奖学金(DP)、ARO YIP 奖(DB 与 DP)、Paul G. Allen Family Foundation 授予 DP 的 Allen Distinguished Investigator 奖、ICTAS Junior Faculty 奖(DB 与 DP)、Google Faculty Research Awards(DP 与 DB)、Amazon Academic Research Awards(DP 与 DB)、AWS in Education Research 资助(DB)以及 NVIDIA 向 DB 捐赠的 GPU 资助。文中观点与结论属作者,不应被解释为必然代表美国政府或任何资助方的官方政策或背书(明示或暗示)。
Appendix A Appendix Overview
附录 A 附录概览
In the appendix, we provide:
附录中我们提供:
I - Ablation studies evaluating our design choices
I - 评估设计选择的消融研究
II - More qualitative examples for image classification, captioning and VQA
II - 图像分类、描述与 VQA 的更多定性例子
III - More details of Pointing Game evaluation technique
III - 指点游戏评估技术的更多细节
IV - Qualitative comparison to existing visualization techniques
IV - 与现有可视化技术的定性对比
V - More qualitative examples of textual explanations
V - 文本解释的更多定性例子
Appendix B Ablation studies
附录 B 消融研究
We perform several ablation studies to explore and validate our design choices for computing Grad-CAM visualizations. This includes visualizing different layers in the network, understanding importance of ReLU in (2), analyzing different types of gradients (for ReLU backward pass), and different gradient pooling strategies.
我们开展若干消融研究,以探索并验证计算 Grad-CAM 可视化的设计选择。包括可视化网络中不同层、理解 (2) 中 ReLU 的重要性、分析不同类型的梯度(对 ReLU 反向传播),以及不同的梯度池化策略。
1. Grad-CAM for different layers
1. 不同层的 Grad-CAM
We show Grad-CAM visualizations for the “tiger-cat” class at different convolutional layers in AlexNet and VGG-16. As expected, the results from Fig. 13 show that localization becomes progressively worse as we move to earlier convolutional layers. This is because later convolutional layers better capture high-level semantic information while retaining spatial information than earlier layers, that have smaller receptive fields and only focus on local features.
我们展示 AlexNet 与 VGG-16 中不同卷积层上「虎猫」类的 Grad-CAM 可视化。如图 13 所料,越往更早的卷积层,定位越差。因为较晚的卷积层比感受野更小、只关注局部特征的较早层,更好地捕捉高层语义信息同时保留空间信息。
Figure 13: Grad-CAM at different convolutional layers for the ‘tiger cat’ class. This figure analyzes how localizations change qualitatively as we perform Grad-CAM with respect to different feature maps in a CNN (VGG16 [52]). We find that the best looking visualizations are often obtained after the deepest convolutional layer in the network, and localizations get progressively worse at shallower layers. This is consistent with our intuition described in Section 3 of main paper, that deeper convolutional layer capture more semantic concepts.
图 13:对「虎猫」类在不同卷积层上的 Grad-CAM。本图分析相对 CNN(VGG16 [52])中不同特征图做 Grad-CAM 时定位如何定性变化。我们发现最好看的可视化往往来自网络最深的卷积层,更浅层定位逐渐变差。这与主文第 3 节所述直觉一致:更深的卷积层捕捉更多语义概念。
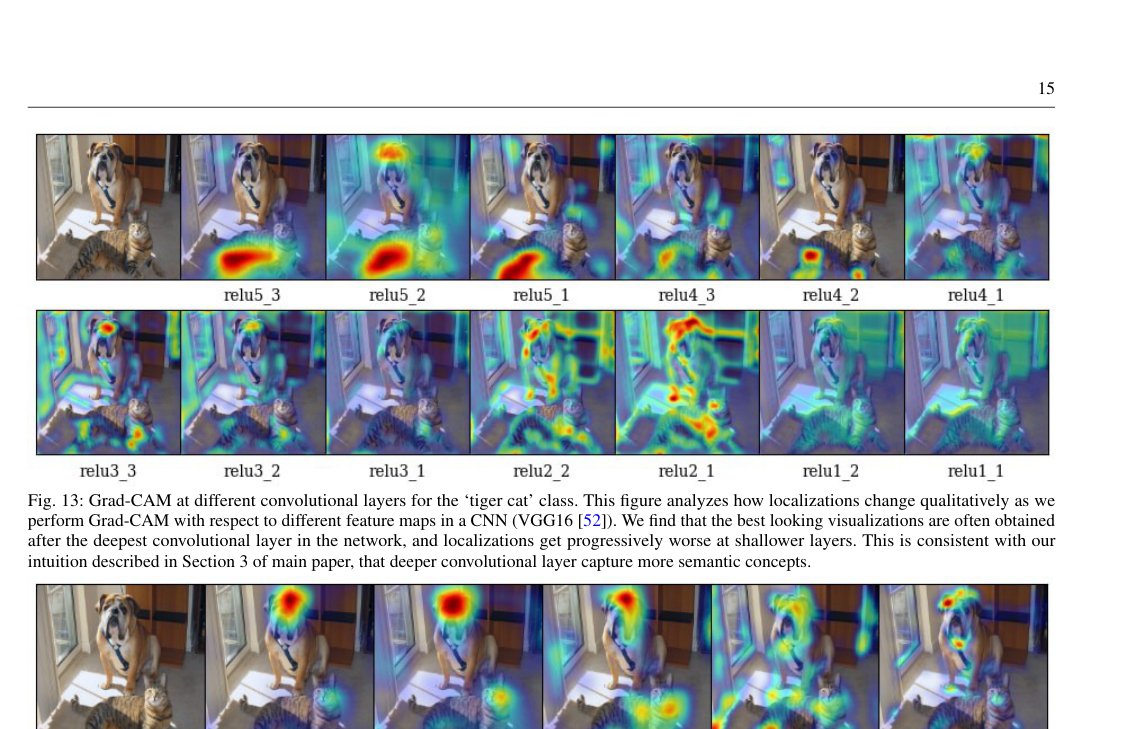
Figure 14: Grad-CAM localizations for “tiger cat” category for different rectified convolutional layer feature maps for AlexNet.
图 14:AlexNet 不同整流卷积层特征图上「虎猫」类别的 Grad-CAM 定位。
2. Design choices
2. 设计选择
| Method | Top-1 Loc error |
|---|---|
| Grad-CAM | 59.65 |
| Grad-CAM without ReLU in Eq.1 | 74.98 |
| Grad-CAM with Absolute gradients | 58.19 |
| Grad-CAM with GMP gradients | 59.96 |
| Grad-CAM with Deconv ReLU | 83.95 |
| Grad-CAM with Guided ReLU | 59.14 |
Table 3: Localization results on ILSVRC-15 val for the ablations. Note that this evaluation is over 10 crops, while visualizations are single crop.
| 方法 | Top-1 定位误差 |
|---|---|
| Grad-CAM | 59.65 |
| Grad-CAM without ReLU in Eq.1 | 74.98 |
| Grad-CAM with Absolute gradients | 58.19 |
| Grad-CAM with GMP gradients | 59.96 |
| Grad-CAM with Deconv ReLU | 83.95 |
| Grad-CAM with Guided ReLU | 59.14 |
表 3:消融在 ILSVRC-15 val 上的定位结果。注意该评估用 10 裁剪,而可视化为单裁剪。
We evaluate different design choices via top-1 localization errors on the ILSVRC-15 val set [14]. See Table. 3.
我们通过 ILSVRC-15 验证集 [14] 上的 top-1 定位误差评估不同设计选择。见表 3。
2.1. Importance of ReLU in (3)
Removing ReLU ((3)) increases error by 15.3%. Negative values in Grad-CAM indicate confusion between multiple occurring classes.
2.1. (3) 中 ReLU 的重要性
去掉 ReLU((3))使误差上升 15.3%。Grad-CAM 中的负值指示多个并存类别之间的混淆。
2.2. Global Average Pooling vs. Global Max Pooling
Instead of Global Average Pooling (GAP) the incoming gradients to the convolutional layer, we tried Global Max Pooling (GMP). We observe that using GMP lowers the localization ability of Grad-CAM. An example can be found in Fig. 15 below. This may be due to the fact that max is statistically less robust to noise compared to the averaged gradient.
2.2. 全局平均池化 对 全局最大池化
我们不用全局平均池化(GAP)汇总流入卷积层的梯度,而尝试全局最大池化(GMP)。观察到使用 GMP 会降低 Grad-CAM 的定位能力。例子见下方图 15。这可能是因为相对平均梯度,最大值在统计上对噪声更不稳健。
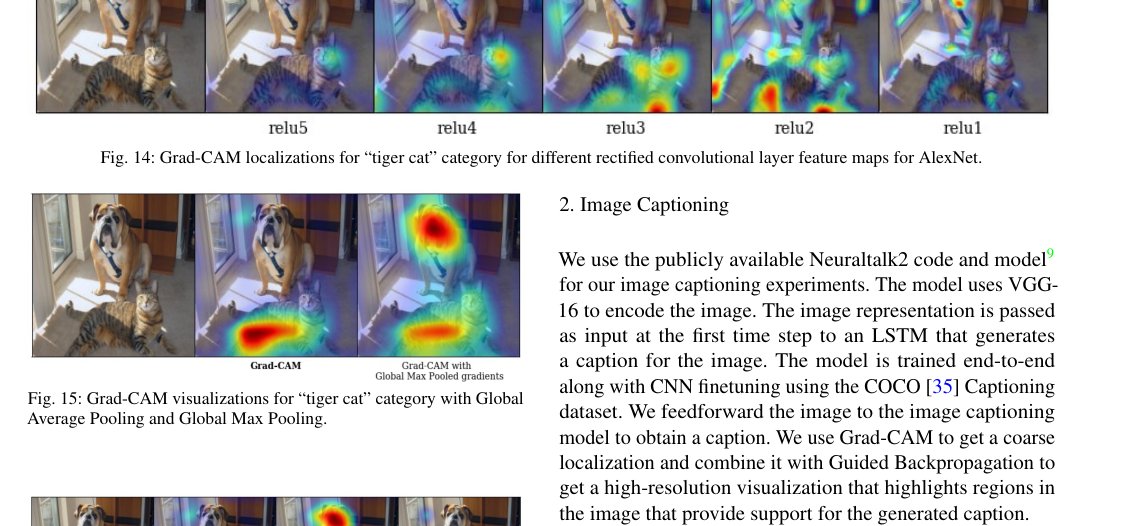
Figure 15: Grad-CAM visualizations for “tiger cat” category with Global Average Pooling and Global Max Pooling.
图 15:「虎猫」类别在全局平均池化与全局最大池化下的 Grad-CAM 可视化。
2.3. Effect of different ReLU on Grad-CAM
We experiment with Guided-ReLU [53] and Deconv-ReLU [57] as modifications to the backward pass of ReLU.
2.3. 不同 ReLU 对 Grad-CAM 的影响
我们尝试 Guided-ReLU [53] 与 Deconv-ReLU [57] 作为 ReLU 反向传播的修改。
Guided-ReLU: Springenberg et al. [53] introduced Guided Backprop, where the backward pass of ReLU is modified to only pass positive gradients to regions of positive activations. Applying this change to the computation of Grad-CAM introduces a drop in the class-discriminative ability as can be seen in Fig. 16, but it marginally improves localization performance as can be seen in Table. 3.
Guided-ReLU: Springenberg et al. [53] 提出 Guided Backprop,其中 ReLU 的反向传播被修改为只把正梯度传到正激活区域。把该改动用于 Grad-CAM 计算会降低类区分能力,见图 16,但如表 3 所示略微改善定位表现。
Deconv-ReLU: In Deconvolution [57], Zeiler and Fergus introduced a modification to the backward pass of ReLU to only pass positive gradients. Applying this modification to the computation of Grad-CAM leads to worse results (Fig. 16). This indicates that negative gradients also carry important information for class-discriminativeness.
Deconv-ReLU: 在 Deconvolution [57] 中,Zeiler and Fergus 提出只传递正梯度的 ReLU 反向修改。把该修改用于 Grad-CAM 计算会导致更差结果(图 16)。这表明负梯度对类区分性也携带重要信息。
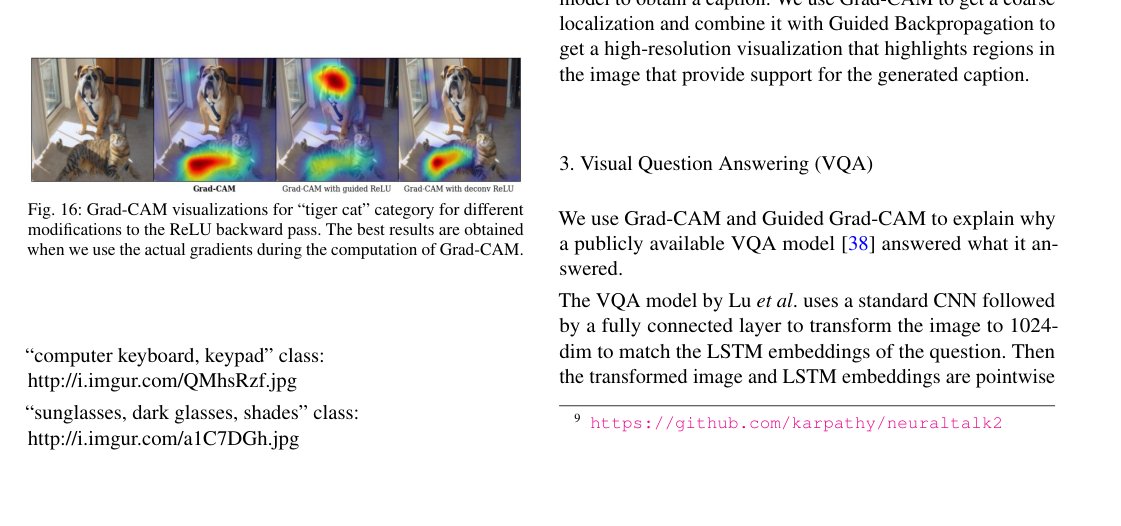
Figure 16: Grad-CAM visualizations for “tiger cat” category for different modifications to the ReLU backward pass. The best results are obtained when we use the actual gradients during the computation of Grad-CAM.
图 16:「虎猫」类别在不同 ReLU 反向传播修改下的 Grad-CAM 可视化。计算 Grad-CAM 时使用实际梯度效果最好。
Appendix C Qualitative results for vision and language tasks
附录 C 视觉与语言任务的定性结果
In this section we provide more qualitative results for Grad-CAM and Guided Grad-CAM applied to the task of image classification, image captioning and VQA.
本节给出 Grad-CAM 与 Guided Grad-CAM 应用于图像分类、图像描述与 VQA 任务的更多定性结果。
1. Image Classification
1. 图像分类
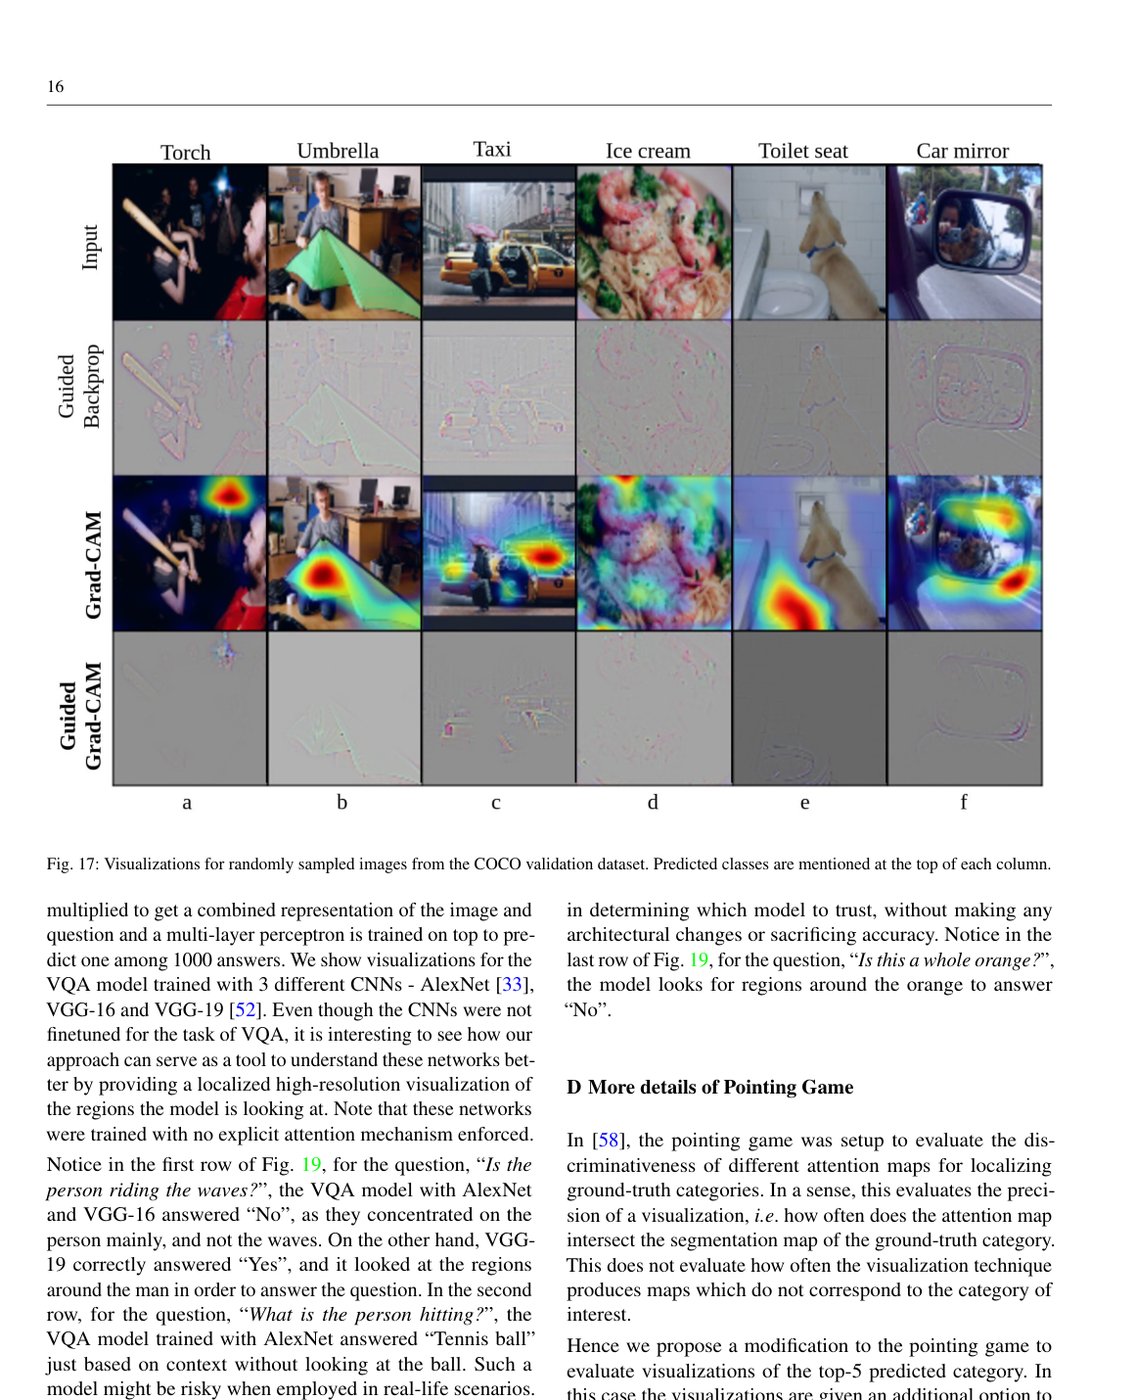
Figure 17: Visualizations for randomly sampled images from the COCO validation dataset. Predicted classes are mentioned at the top of each column.
图 17:从 COCO 验证集随机抽样图像的可视化。预测类别标在每列顶部。
We use Grad-CAM and Guided Grad-CAM to visualize the regions of the image that provide support for a particular prediction. The results reported in Fig. 17 correspond to the VGG-16 [52] network trained on ImageNet.
我们用 Grad-CAM 与 Guided Grad-CAM 可视化为特定预测提供支撑的图像区域。图 17 报告的结果对应在 ImageNet 上训练的 VGG-16 [52] 网络。
Fig. 17 shows randomly sampled examples from COCO [35] validation set. COCO images typically have multiple objects per image and Grad-CAM visualizations show precise localization to support the model’s prediction.
图 17 展示来自 COCO [35] 验证集的随机抽样例子。COCO 图像通常每张含多个物体,Grad-CAM 可视化显示对支撑模型预测的精确定位。
Guided Grad-CAM can even localize tiny objects. For example our approach correctly localizes the predicted class “torch” (Fig. 17.a) inspite of its size and odd location in the image. Our method is also class-discriminative – it places attention only on the “toilet seat” even when a popular ImageNet category “dog” exists in the image (Fig. 17.e).
Guided Grad-CAM 甚至能定位微小物体。例如我们的方法正确对应预测类「火炬」(图 17.a),尽管其尺寸小且位置奇特。方法也是类区分的——即使图像中存在热门 ImageNet 类别「狗」,注意力也只放在「马桶座」上(图 17.e)。
We also visualized Grad-CAM, Guided Backpropagation (GB), Deconvolution (DC), GB + Grad-CAM (Guided Grad-CAM), DC + Grad-CAM (Deconvolution Grad-CAM) for images from the ILSVRC13 detection val set that have at least 2 unique object categories each. The visualizations for the mentioned class can be found in the following links.
我们还为 ILSVRC13 检测验证集中每张至少含 2 个不同物体类别的图像,可视化了 Grad-CAM、Guided Backpropagation(GB)、Deconvolution(DC)、GB + Grad-CAM(Guided Grad-CAM)、DC + Grad-CAM(Deconvolution Grad-CAM)。所述类别的可视化见下列链接。
“computer keyboard, keypad” class: http://i.imgur.com/QMhsRzf.jpg
「computer keyboard, keypad」类:http://i.imgur.com/QMhsRzf.jpg
“sunglasses, dark glasses, shades” class: http://i.imgur.com/a1C7DGh.jpg
「sunglasses, dark glasses, shades」类:http://i.imgur.com/a1C7DGh.jpg
2. Image Captioning
2. 图像描述
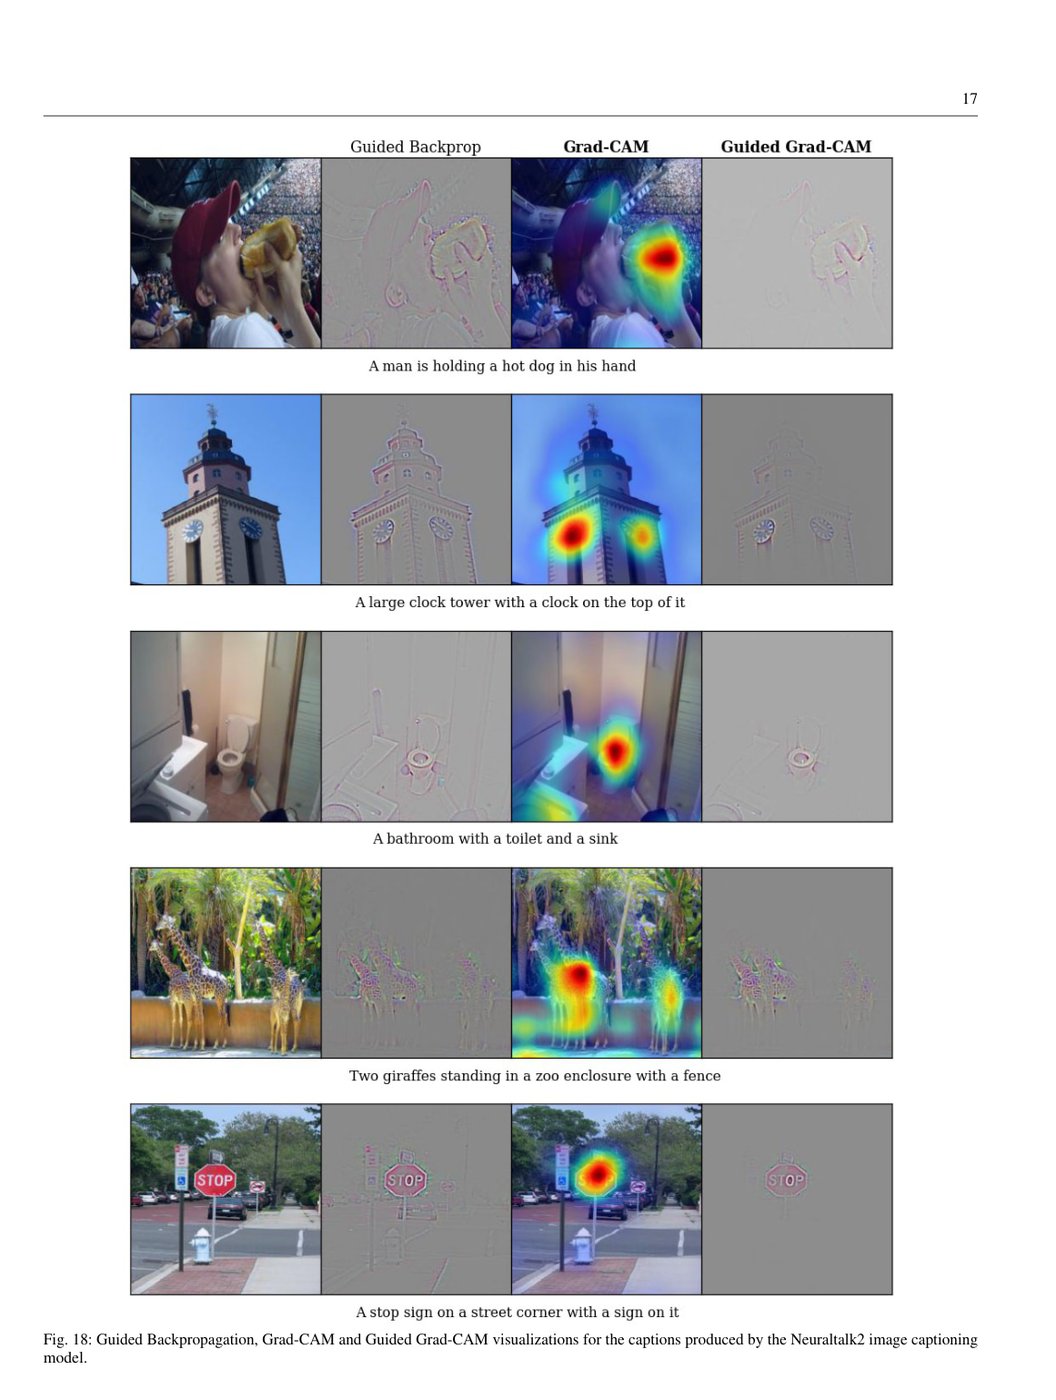
Figure 18: Guided Backpropagation, Grad-CAM and Guided Grad-CAM visualizations for the captions produced by the Neuraltalk2 image captioning model.
图 18:Neuraltalk2 图像描述模型所生成描述的 Guided Backpropagation、Grad-CAM 与 Guided Grad-CAM 可视化。
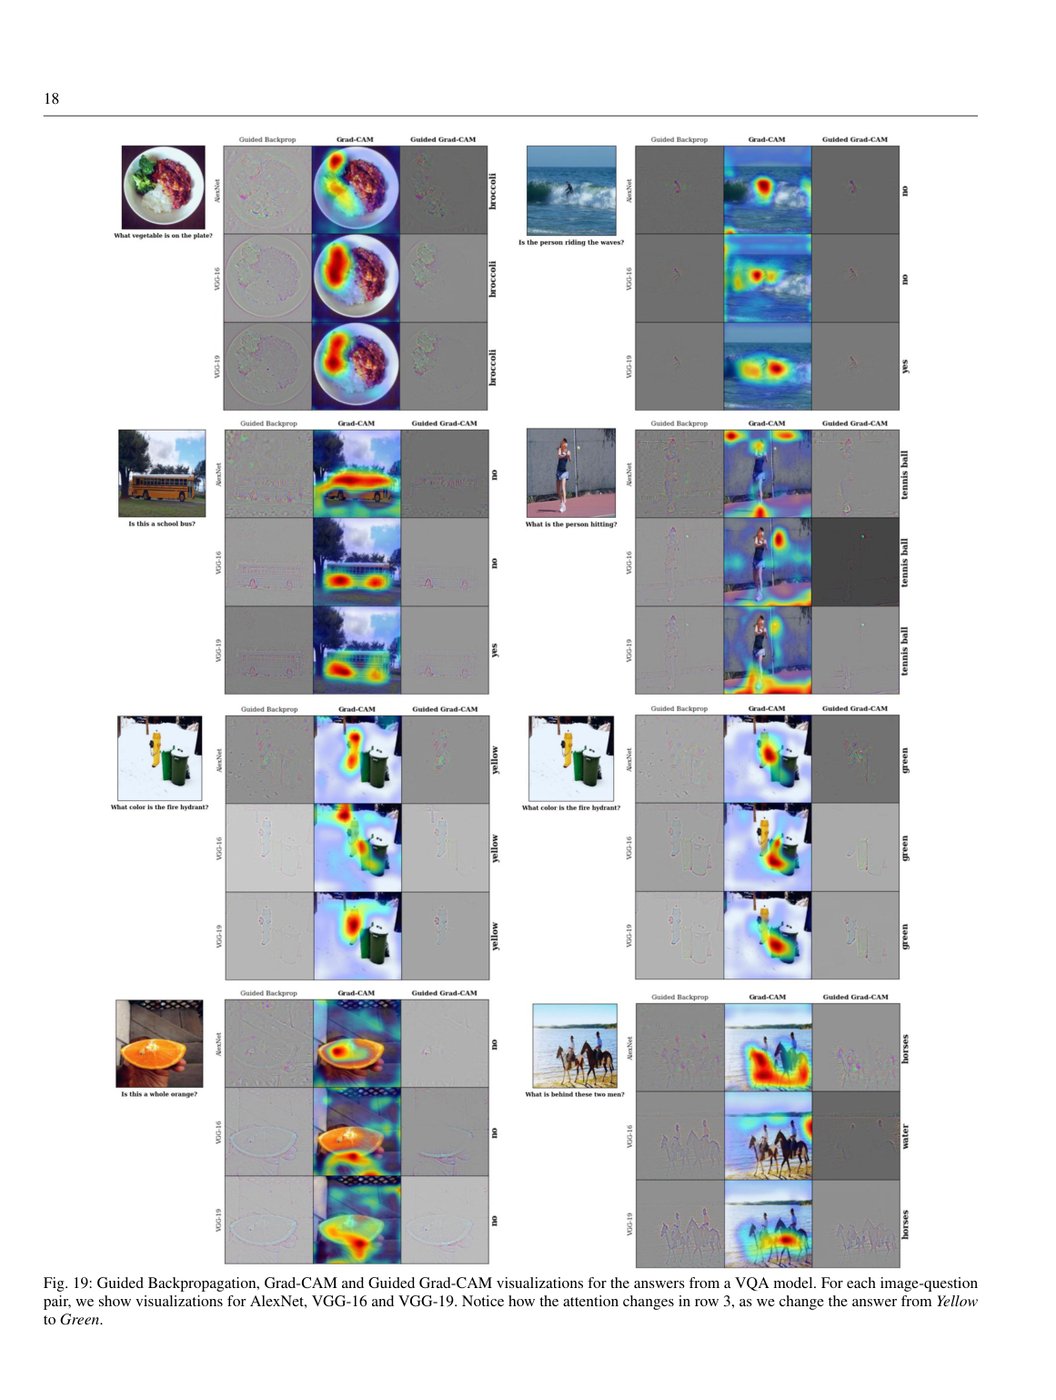
Figure 19: Guided Backpropagation, Grad-CAM and Guided Grad-CAM visualizations for the answers from a VQA model. For each image-question pair, we show visualizations for AlexNet, VGG-16 and VGG-19. Notice how the attention changes in row 3, as we change the answer from Yellow to Green.
图 19:某 VQA 模型答案的 Guided Backpropagation、Grad-CAM 与 Guided Grad-CAM 可视化。对每个图像—问题对,展示 AlexNet、VGG-16 与 VGG-19 的可视化。注意第 3 行当答案从 Yellow 改为 Green 时注意力如何变化。
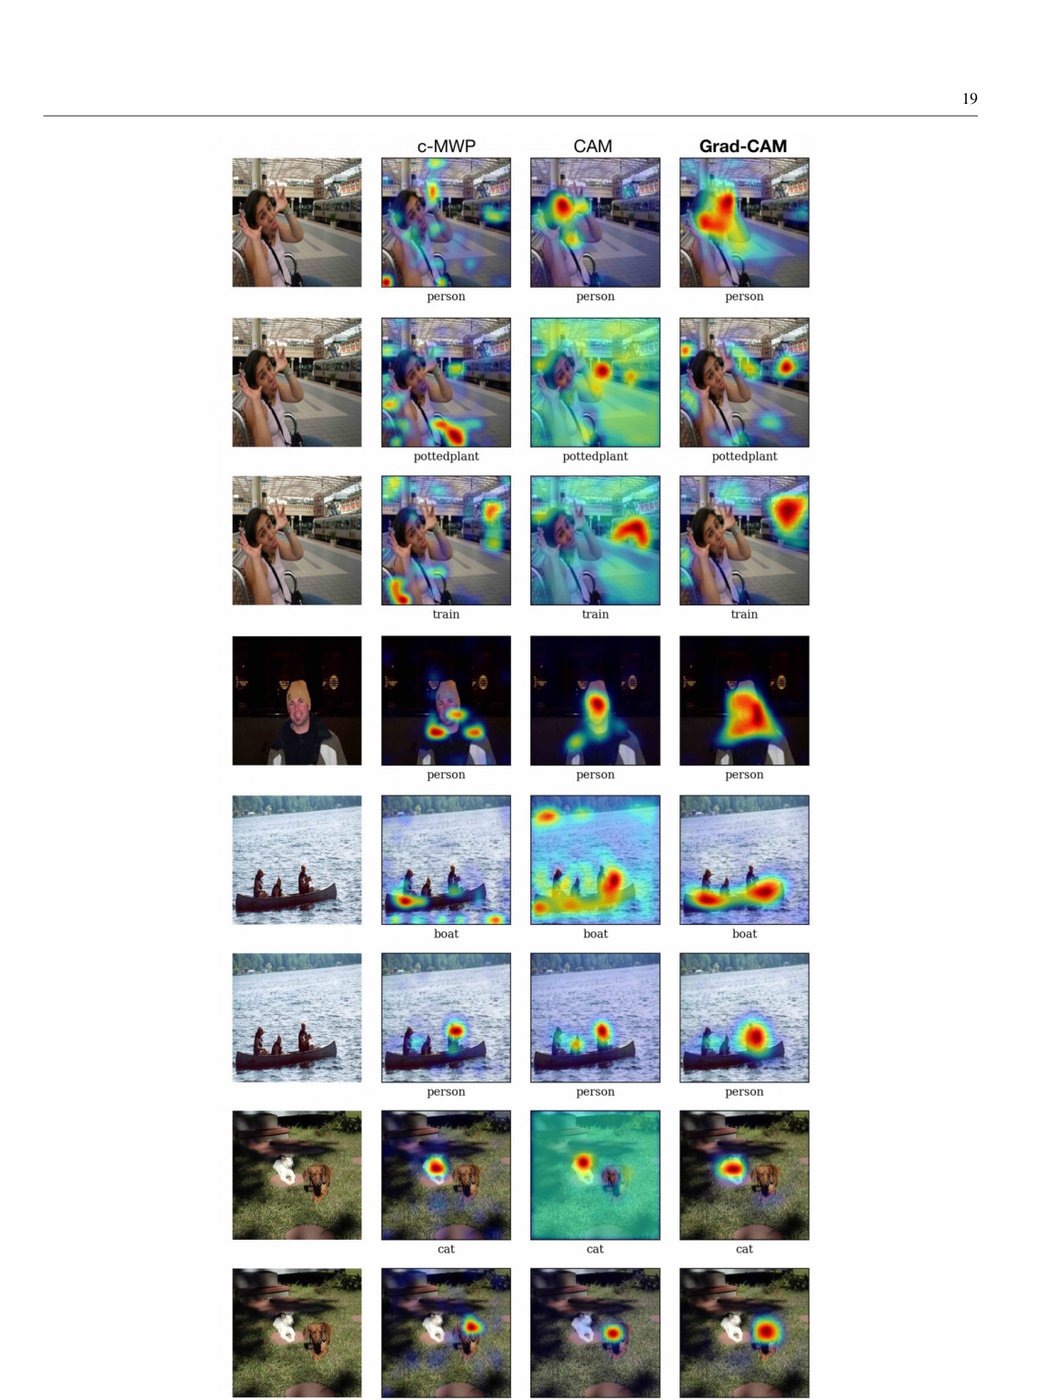
Figure 20: Visualizations for ground-truth categories (shown below each image) for images sampled from the PASCAL [17] validation set.
图 20:从 PASCAL [17] 验证集抽样图像上真实类别(标在每图下方)的可视化。
We use the publicly available Neuraltalk2 code and model[^9] for our image captioning experiments. The model uses VGG-16 to encode the image. The image representation is passed as input at the first time step to an LSTM that generates a caption for the image. The model is trained end-to-end along with CNN finetuning using the COCO [35] Captioning dataset. We feedforward the image to the image captioning model to obtain a caption. We use Grad-CAM to get a coarse localization and combine it with Guided Backpropagation to get a high-resolution visualization that highlights regions in the image that provide support for the generated caption.
图像描述实验使用公开的 Neuraltalk2 代码与模型[^9]。模型用 VGG-16 编码图像。图像表示在第一个时间步作为输入送入 LSTM,为图像生成描述。模型在 COCO [35] Captioning 数据集上端到端训练并微调 CNN。我们把图像前传到图像描述模型得到描述,用 Grad-CAM 得到粗定位,再与 Guided Backpropagation 结合得到高分辨率可视化,高亮支撑生成描述的图像区域。
3. Visual Question Answering (VQA)
3. 视觉问答(VQA)
We use Grad-CAM and Guided Grad-CAM to explain why a publicly available VQA model [38] answered what it answered.
我们用 Grad-CAM 与 Guided Grad-CAM 解释公开 VQA 模型 [38] 为何给出其答案。
The VQA model by Lu et al. uses a standard CNN followed by a fully connected layer to transform the image to 1024-dim to match the LSTM embeddings of the question. Then the transformed image and LSTM embeddings are pointwise multiplied to get a combined representation of the image and question and a multi-layer perceptron is trained on top to predict one among 1000 answers. We show visualizations for the VQA model trained with 3 different CNNs - AlexNet [33], VGG-16 and VGG-19 [52]. Even though the CNNs were not finetuned for the task of VQA, it is interesting to see how our approach can serve as a tool to understand these networks better by providing a localized high-resolution visualization of the regions the model is looking at. Note that these networks were trained with no explicit attention mechanism enforced.
Lu et al. 的 VQA 模型用标准 CNN 后接全连接层,把图像变换到 1024 维以匹配问题的 LSTM 嵌入。再将变换后的图像与 LSTM 嵌入逐点相乘,得到图像与问题的联合表示,其上训练多层感知机在 1000 个答案中预测其一。我们展示用 3 种不同 CNN——AlexNet [33]、VGG-16 与 VGG-19 [52]——训练的 VQA 模型可视化。尽管这些 CNN 未为 VQA 任务微调,有趣的是我们的方法可通过提供模型关注区域的局部高分辨率可视化,作为更好理解这些网络的工具。注意这些网络训练时未强制显式注意力机制。
Notice in the first row of Fig. 19, for the question, “Is the person riding the waves?”, the VQA model with AlexNet and VGG-16 answered “No”, as they concentrated on the person mainly, and not the waves. On the other hand, VGG-19 correctly answered “Yes”, and it looked at the regions around the man in order to answer the question. In the second row, for the question, “What is the person hitting?”, the VQA model trained with AlexNet answered “Tennis ball” just based on context without looking at the ball. Such a model might be risky when employed in real-life scenarios. It is difficult to determine the trustworthiness of a model just based on the predicted answer. Our visualizations provide an accurate way to explain the model’s predictions and help in determining which model to trust, without making any architectural changes or sacrificing accuracy. Notice in the last row of Fig. 19, for the question, “Is this a whole orange?”, the model looks for regions around the orange to answer “No”.
注意图 19 第一行,对问题「Is the person riding the waves?」,带 AlexNet 与 VGG-16 的 VQA 模型回答「No」,因为它们主要关注人而非浪。另一方面,VGG-19 正确回答「Yes」,并为回答问题看向人周围区域。第二行,对问题「What is the person hitting?」,用 AlexNet 训练的 VQA 模型仅凭上下文回答「Tennis ball」而并未看球。这类模型在现实场景中可能有风险。仅凭预测答案很难判断模型可信度。我们的可视化提供准确解释模型预测的方式,并帮助决定信任哪个模型,而无需改结构或牺牲准确率。注意图 19 最后一行,对问题「Is this a whole orange?」,模型看向橙子周围区域以回答「No」。
(a)
Appendix D More details of Pointing Game
附录 D 指点游戏的更多细节
In [58], the pointing game was setup to evaluate the discriminativeness of different attention maps for localizing ground-truth categories. In a sense, this evaluates the precision of a visualization, i.e. how often does the attention map intersect the segmentation map of the ground-truth category. This does not evaluate how often the visualization technique produces maps which do not correspond to the category of interest.
在 [58] 中,指点游戏用于评估不同注意力图定位真实类别的区分性。某种意义上,这评估可视化的精度,即 注意力图与真实类别分割图相交的频率。它不评估可视化技术产生与感兴趣类别不对应的图的频率。
Hence we propose a modification to the pointing game to evaluate visualizations of the top-5 predicted category. In this case the visualizations are given an additional option to reject any of the top-5 predictions from the CNN classifiers. For each of the two visualizations, Grad-CAM and c-MWP, we choose a threshold on the max value of the visualization, that can be used to determine if the category being visualized exists in the image.
因此我们提出对指点游戏的修改,以评估 top-5 预测类别的可视化。此时可视化额外可拒绝 CNN 分类器的任一 top-5 预测。对 Grad-CAM 与 c-MWP 两种可视化,我们在可视化最大值上选取阈值,用于判断被可视化的类别是否存在于图像中。
We compute the maps for the top-5 categories, and based on the maximum value in the map, we try to classify if the map is of the GT label or a category that is absent in the image. As mentioned in Section 4.2 of the main paper, we find that our approach Grad-CAM outperforms c-MWP by a significant margin (70.58% vs 60.30% on VGG-16).
我们为 top-5 类别计算图,并基于图中最大值尝试分类该图属于 GT 标签还是图像中不存在的类别。如主文第 4.2 节所述,我们发现 Grad-CAM 显著优于 c-MWP(在 VGG-16 上 70.58% 对 60.30%)。
Appendix E Qualitative comparison to Excitation Backprop (c-MWP) and CAM
附录 E 与 Excitation Backprop(c-MWP)及 CAM 的定性对比
In this section we provide more qualitative results comparing Grad-CAM with CAM [59] and c-MWP [58] on Pascal [17].
本节给出在 Pascal [17] 上 Grad-CAM 与 CAM [59]、c-MWP [58] 对比的更多定性结果。
We compare Grad-CAM, CAM and c-MWP visualizations from ImageNet trained VGG-16 models finetuned on PASCAL VOC 2012 dataset. While Grad-CAM and c-MWP visualizations can be directly obtained from existing models, CAM requires an architectural change, and requires re-training, which leads to loss in accuracy. Also, unlike Grad-CAM, c-MWP and CAM can only be applied for image classification networks. Visualizations for the ground-truth categories can be found in Fig. 20.
我们比较在 ImageNet 训练、于 PASCAL VOC 2012 数据集微调的 VGG-16 模型上的 Grad-CAM、CAM 与 c-MWP 可视化。Grad-CAM 与 c-MWP 可视化可直接从现有模型获得,而 CAM 需要改结构并重新训练,导致准确率损失。此外,与 Grad-CAM 不同,c-MWP 与 CAM 只能用于图像分类网络。真实类别的可视化见图 20。
(a) Grad-CAM visualizations for the ResNet-200 layer architecture for ’tiger cat’(left) and ’boxer’(right) category.
(a) ResNet-200 层结构上「虎猫」(左)与「拳师犬」(右)类别的 Grad-CAM 可视化。
Appendix F Visual and Textual explanations for Places dataset
附录 F Places 数据集的视觉与文本解释
Fig. 21 shows more examples of visual and textual explanations (Sec. 7) for the image classification model (VGG-16) trained on Places365 dataset ([61]).
图 21 给出在 Places365 数据集([61])上训练的图像分类模型(VGG-16)的更多视觉与文本解释例子(第 7 节)。
Appendix G Analyzing Residual Networks
附录 G 分析残差网络
In this section, we perform Grad-CAM on Residual Networks (ResNets). In particular, we analyze the 200-layer architecture trained on ImageNet[^10].
本节对残差网络(ResNets)做 Grad-CAM。具体分析在 ImageNet 上训练的 200 层结构[^10]。
Current ResNets [24] typically consist of residual blocks. One set of blocks use identity skip connections (shortcut connections between two layers having identical output dimensions). These sets of residual blocks are interspersed with downsampling modules that alter dimensions of propagating signal. As can be seen in Fig. 22 our visualizations applied on the last convolutional layer can correctly localize the cat and the dog. Grad-CAM can also visualize the cat and dog correctly in the residual blocks of the last set. However, as we go towards earlier sets of residual blocks with different spatial resolution, we see that Grad-CAM fails to localize the category of interest (see last row of Fig. 22). We observe similar trends for other ResNet architectures (18 and 50-layer).
当前 ResNets [24] 通常由残差块组成。一类块使用恒等跳跃连接(输出维度相同的两层之间的捷径)。这些残差块集合由改变传播信号维度的下采样模块隔开。如图 22,对最后卷积层的可视化能正确定位猫与狗。Grad-CAM 也能在最后一组残差块中正确可视化猫与狗。但当我们走向空间分辨率不同的更早组残差块时,Grad-CAM 无法定位感兴趣类别(见图 22 最后一行)。对其他 ResNet 结构(18 与 50 层)我们观察到类似趋势。
References
参考文献
(1) A. Agrawal, D. Batra, and D. Parikh. Analyzing the Behavior of Visual Question Answering Models. In EMNLP , 2016.
(2) H. Agrawal, C. S. Mathialagan, Y. Goyal, N. Chavali, P. Banik, A. Mohapatra, A. Osman, and D. Batra. CloudCV: Large Scale Distributed Computer Vision as a Cloud Service. In Mobile Cloud Visual Media Computing , pages 265–290. Springer, 2015.
(3) S. Antol, A. Agrawal, J. Lu, M. Mitchell, D. Batra, C. Lawrence Zitnick, and D. Parikh. VQA: Visual Question Answering. In ICCV , 2015.
(4) D. Bau, B. Zhou, A. Khosla, A. Oliva, and A. Torralba. Network dissection: Quantifying interpretability of deep visual representations. In Computer Vision and Pattern Recognition , 2017.
(5) L. Bazzani, A. Bergamo, D. Anguelov, and L. Torresani. Self-taught object localization with deep networks. In WACV , 2016.
(6) Y. Bengio, A. Courville, and P. Vincent. Representation learning: A review and new perspectives. IEEE transactions on pattern analysis and machine intelligence , 35(8):1798–1828, 2013.
(7) X. Chen, H. Fang, T.-Y. Lin, R. Vedantam, S. Gupta, P. Dollár, and C. L. Zitnick. Microsoft COCO captions: Data Collection and Evaluation Server. arXiv preprint arXiv:1504.00325 , 2015.
(8) R. G. Cinbis, J. Verbeek, and C. Schmid. Weakly supervised object localization with multi-fold multiple instance learning. IEEE transactions on pattern analysis and machine intelligence , 2016.
(9) A. Das, H. Agrawal, C. L. Zitnick, D. Parikh, and D. Batra. Human Attention in Visual Question Answering: Do Humans and Deep Networks Look at the Same Regions? In EMNLP , 2016.
(10) A. Das, S. Datta, G. Gkioxari, S. Lee, D. Parikh, and D. Batra. Embodied Question Answering. In Proceedings of the IEEE Conference on Computer Vision and Pattern Recognition (CVPR) , 2018.
(11) A. Das, S. Kottur, K. Gupta, A. Singh, D. Yadav, J. M. Moura, D. Parikh, and D. Batra. Visual Dialog. In Proceedings of the IEEE Conference on Computer Vision and Pattern Recognition (CVPR) , 2017.
(12) A. Das, S. Kottur, J. M. Moura, S. Lee, and D. Batra. Learning cooperative visual dialog agents with deep reinforcement learning. In Proceedings of the IEEE International Conference on Computer Vision (ICCV) , 2017.
(13) H. de Vries, F. Strub, S. Chandar, O. Pietquin, H. Larochelle, and A. C. Courville. Guesswhat?! visual object discovery through multi-modal dialogue. In Proceedings of the IEEE Conference on Computer Vision and Pattern Recognition (CVPR) , 2017.
(14) J. Deng, W. Dong, R. Socher, L.-J. Li, K. Li, and L. Fei-Fei. ImageNet: A Large-Scale Hierarchical Image Database. In CVPR , 2009.
(15) A. Dosovitskiy and T. Brox. Inverting Convolutional Networks with Convolutional Networks. In CVPR , 2015.
(16) D. Erhan, Y. Bengio, A. Courville, and P. Vincent. Visualizing Higher-layer Features of a Deep Network. University of Montreal , 1341, 2009.
(17) M. Everingham, L. Van Gool, C. K. I. Williams, J. Winn, and A. Zisserman. The PASCAL Visual Object Classes Challenge 2007 (VOC2007) Results. http://www.pascal-network.org/challenges/VOC/voc2007/workshop/index.html, 2009.
(18) H. Fang, S. Gupta, F. Iandola, R. K. Srivastava, L. Deng, P. Dollár, J. Gao, X. He, M. Mitchell, J. C. Platt, et al. From Captions to Visual Concepts and Back. In CVPR , 2015.
(19) C. Gan, N. Wang, Y. Yang, D.-Y. Yeung, and A. G. Hauptmann. Devnet: A deep event network for multimedia event detection and evidence recounting. In CVPR , 2015.
(20) H. Gao, J. Mao, J. Zhou, Z. Huang, L. Wang, and W. Xu. Are You Talking to a Machine? Dataset and Methods for Multilingual Image Question Answering. In NIPS , 2015.
(21) R. Girshick, J. Donahue, T. Darrell, and J. Malik. Rich Feature Hierarchies for Accurate Object Detection and Semantic Segmentation. In CVPR , 2014.
(22) I. J. Goodfellow, J. Shlens, and C. Szegedy. Explaining and harnessing adversarial examples. stat , 2015.
(23) D. Gordon, A. Kembhavi, M. Rastegari, J. Redmon, D. Fox, and A. Farhadi. Iqa: Visual question answering in interactive environments. arXiv preprint arXiv:1712.03316 , 2017.
(24) K. He, X. Zhang, S. Ren, and J. Sun. Deep residual learning for image recognition. In CVPR , 2016.
(25) D. Hoiem, Y. Chodpathumwan, and Q. Dai. Diagnosing Error in Object Detectors. In ECCV , 2012.
(26) P. Jackson. Introduction to Expert Systems . Addison-Wesley Longman Publishing Co., Inc., Boston, MA, USA, 3rd edition, 1998.
(27) Y. Jia, E. Shelhamer, J. Donahue, S. Karayev, J. Long, R. Girshick, S. Guadarrama, and T. Darrell. Caffe: Convolutional Architecture for Fast Feature Embedding. In ACM MM , 2014.
(28) E. Johns, O. Mac Aodha, and G. J. Brostow. Becoming the Expert - Interactive Multi-Class Machine Teaching. In CVPR , 2015.
(29) J. Johnson, A. Karpathy, and L. Fei-Fei. DenseCap: Fully Convolutional Localization Networks for Dense Captioning. In CVPR , 2016.
(30) A. Karpathy. What I learned from competing against a ConvNet on ImageNet. http://karpathy.github.io/2014/09/02/what-i-learned-from-competing-against-a-convnet-on-imagenet/, 2014.
(31) A. Karpathy and L. Fei-Fei. Deep visual-semantic alignments for generating image descriptions. In CVPR , 2015.
(32) A. Kolesnikov and C. H. Lampert. Seed, expand and constrain: Three principles for weakly-supervised image segmentation. In ECCV , 2016.
(33) A. Krizhevsky, I. Sutskever, and G. E. Hinton. Imagenet classification with deep convolutional neural networks. In NIPS , 2012.
(34) M. Lin, Q. Chen, and S. Yan. Network in network. In ICLR , 2014.
(35) T.-Y. Lin, M. Maire, S. Belongie, J. Hays, P. Perona, D. Ramanan, P. Dollár, and C. L. Zitnick. Microsoft coco: Common objects in context. In ECCV . 2014.
(36) Z. C. Lipton. The Mythos of Model Interpretability. ArXiv e-prints , June 2016.
(37) J. Long, E. Shelhamer, and T. Darrell. Fully convolutional networks for semantic segmentation. In CVPR , 2015.
(38) J. Lu, X. Lin, D. Batra, and D. Parikh. Deeper LSTM and normalized CNN Visual Question Answering model. https://github.com/VT-vision-lab/VQA_LSTM_CNN , 2015.
(39) J. Lu, J. Yang, D. Batra, and D. Parikh. Hierarchical question-image co-attention for visual question answering. In NIPS , 2016.
(40) A. Mahendran and A. Vedaldi. Salient deconvolutional networks. In European Conference on Computer Vision , 2016.
(41) A. Mahendran and A. Vedaldi. Visualizing deep convolutional neural networks using natural pre-images. International Journal of Computer Vision , pages 1–23, 2016.
(42) M. Malinowski, M. Rohrbach, and M. Fritz. Ask your neurons: A neural-based approach to answering questions about images. In ICCV , 2015.
(43) M. Oquab, L. Bottou, I. Laptev, and J. Sivic. Learning and transferring mid-level image representations using convolutional neural networks. In CVPR , 2014.
(44) M. Oquab, L. Bottou, I. Laptev, and J. Sivic. Is object localization for free? – weakly-supervised learning with convolutional neural networks. In CVPR , 2015.
(45) P. O. Pinheiro and R. Collobert. From image-level to pixel-level labeling with convolutional networks. In CVPR , 2015.
(46) M. Ren, R. Kiros, and R. Zemel. Exploring models and data for image question answering. In NIPS , 2015.
(47) M. T. Ribeiro, S. Singh, and C. Guestrin. "Why Should I Trust You?": Explaining the Predictions of Any Classifier. In SIGKDD , 2016.
(48) R. R. Selvaraju, P. Chattopadhyay, M. Elhoseiny, T. Sharma, D. Batra, D. Parikh, and S. Lee. Choose your neuron: Incorporating domain knowledge through neuron-importance. In Proceedings of the European Conference on Computer Vision (ECCV) , pages 526–541, 2018.
(49) R. R. Selvaraju, S. Lee, Y. Shen, H. Jin, S. Ghosh, L. Heck, D. Batra, and D. Parikh. Taking a hint: Leveraging explanations to make vision and language models more grounded. In Proceedings of the International Conference on Computer Vision (ICCV) , 2019.
(50) D. Silver, A. Huang, C. J. Maddison, A. Guez, L. Sifre, G. Van Den Driessche, J. Schrittwieser, I. Antonoglou, V. Panneershelvam, M. Lanctot, et al. Mastering the game of go with deep neural networks and tree search. Nature , 529(7587):484–489, 2016.
(51) K. Simonyan, A. Vedaldi, and A. Zisserman. Deep inside convolutional networks: Visualising image classification models and saliency maps. CoRR , abs/1312.6034, 2013.
(52) K. Simonyan and A. Zisserman. Very Deep Convolutional Networks for Large-Scale Image Recognition. In ICLR , 2015.
(53) J. T. Springenberg, A. Dosovitskiy, T. Brox, and M. A. Riedmiller. Striving for Simplicity: The All Convolutional Net. CoRR , abs/1412.6806, 2014.
(54) C. Szegedy, V. Vanhoucke, S. Ioffe, J. Shlens, and Z. Wojna. Rethinking the inception architecture for computer vision. In Proceedings of the IEEE conference on computer vision and pattern recognition , pages 2818–2826, 2016.
(55) O. Vinyals, A. Toshev, S. Bengio, and D. Erhan. Show and tell: A neural image caption generator. In CVPR , 2015.
(56) C. Vondrick, A. Khosla, T. Malisiewicz, and A. Torralba. HOGgles: Visualizing Object Detection Features. ICCV , 2013.
(57) M. D. Zeiler and R. Fergus. Visualizing and understanding convolutional networks. In ECCV , 2014.
(58) J. Zhang, Z. Lin, J. Brandt, X. Shen, and S. Sclaroff. Top-down Neural Attention by Excitation Backprop. In ECCV , 2016.
(59) B. Zhou, A. Khosla, L. A., A. Oliva, and A. Torralba. Learning Deep Features for Discriminative Localization. In CVPR , 2016.
(60) B. Zhou, A. Khosla, À. Lapedriza, A. Oliva, and A. Torralba. Object detectors emerge in deep scene cnns. CoRR , abs/1412.6856, 2014.
(61) B. Zhou, A. Lapedriza, A. Khosla, A. Oliva, and A. Torralba. Places: A 10 million image database for scene recognition. IEEE Transactions on Pattern Analysis and Machine Intelligence , 2017.