GQA: A New Dataset for Real-World Visual Reasoning and Compositional Question Answering
GQA: A New Dataset for Real-World Visual Reasoning
and Compositional Question Answering
visualreasoning.net
Abstract
摘要
We introduce GQA, a new dataset for real-world visual reasoning and compositional question answering, seeking to address key shortcomings of previous VQA datasets. We have developed a strong and robust question engine that leverages Visual Genome scene graph structures to create 22M diverse reasoning questions, which all come with functional programs that represent their semantics. We use the programs to gain tight control over the answer distribution and present a new tunable smoothing technique to mitigate question biases. Accompanying the dataset is a suite of new metrics that evaluate essential qualities such as consistency, grounding and plausibility. A careful analysis is performed for baselines as well as state-of-the-art models, providing fine-grained results for different question types and topologies. Whereas a blind LSTM obtains a mere 42.1%, and strong VQA models achieve 54.1%, human performance tops at 89.3%, offering ample opportunity for new research to explore. We hope GQA will provide an enabling resource for the next generation of models with enhanced robustness, improved consistency, and deeper semantic understanding of vision and language.
我们提出 GQA,一套面向真实世界视觉推理与组合问答的新数据集,旨在补上以往视觉问答(VQA)数据集的关键不足。我们开发了一套稳健的问题引擎,借助 Visual Genome 的场景图结构,生成 2200 万条多样化的推理问题,每条都带有表示其语义的函数程序。我们用这些程序对答案分布做严格控制,并提出一种可调节的平滑方法,以减轻问题偏差。数据集还配有一套新指标,用于评估一致性、接地和合理性等关键性质。我们对基线以及当时最先进的模型做了细致分析,按不同问题类型和拓扑给出细粒度结果。盲 LSTM 准确率只有 42.1%,较强的 VQA 模型达到 54.1%,人类表现则高达 89.3%,为后续研究留下了充分空间。我们希望 GQA 能成为下一代模型的助力,使它们在稳健性、一致性,以及对视觉与语言的深层语义理解上更进一步。
- Introduction
- 引言
It takes more than a smart guess to answer a good question. The ability to assimilate knowledge and use it to draw inferences is among the holy grails of artificial intelligence. A tangible form of this goal is embodied in the task of Visual Question Answering (VQA), where a system has to answer free-form questions by reasoning about presented images. The task demands a rich set of abilities as varied as object recognition, commonsense understanding and relation extraction, spanning both the visual and linguistic domains. In recent years, it has sparked substantial interest throughout the research community, becoming extremely popular across the board, with a host of datasets being constructed [3, 9, 13, 36, 17] and numerous models being proposed [4, 33, 5, 8, 10].
回答一个好问题,不能只靠聪明的猜测。吸收知识并据此作出推断,一直是人工智能追求的核心目标之一。视觉问答(Visual Question Answering,VQA)把这一目标落到了可操作的任务上:系统必须通过对给定图像的推理,来回答自由形式的问题。这项任务需要识别物体、运用常识、抽取关系等一整套能力,同时跨越视觉和语言两个领域。近年来,它在研究社区中引起了广泛兴趣,各类数据集相继出现[3, 9, 13, 36, 17],大量模型也被提出[4, 33, 5, 8, 10]。
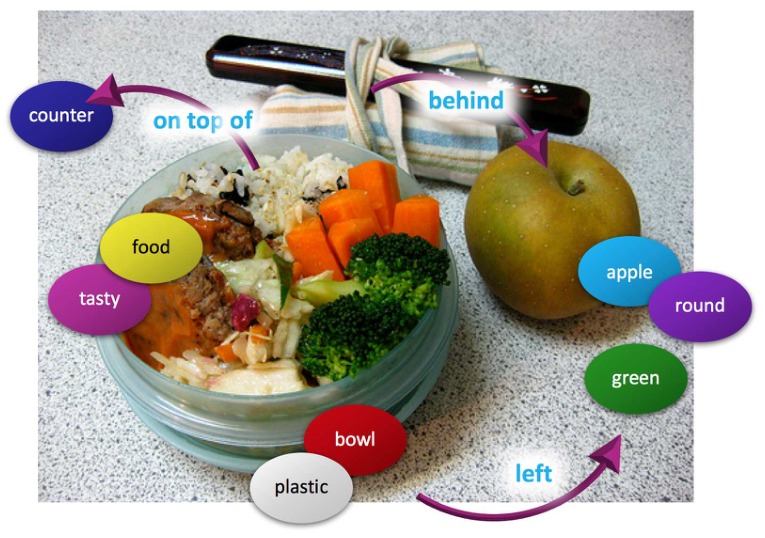
Figure 1: Examples from the new GQA dataset for visual reasoning and compositional question answering: Is the bowl to the right of the green apple? What type of fruit in the image is round? What color is the fruit on the right side, red or green? Is there any milk in the bowl to the left of the apple?
图 1:新的视觉推理与组合问答数据集 GQA 中的例子:碗在青苹果的右边吗?图中哪一种水果是圆的?右边的水果是红色还是绿色?左边那个碗里有牛奶吗?
The multi-modal nature of the task and the diversity of skills required to address different questions make VQA particularly challenging. Yet, designing a good test that will reflect its full qualities and complications may not be that trivial. Despite the great strides that the field recently made, it has been established through a series of studies that existing benchmarks suffer from critical vulnerabilities that render them highly unreliable in measuring the actual degree of visual understanding capacities [34, 9, 1, 7, 2, 11, 16].
这项任务的多模态性质,以及回答不同问题所需技能的多样性,使 VQA 格外困难。然而,要设计出一份能够充分体现其品质与难点的测验,却并不简单。尽管这一领域近来进展很大,一系列研究已经表明,现有基准存在严重缺陷,很难可靠地衡量系统真正的视觉理解能力[34, 9, 1, 7, 2, 11, 16]。
Most notable among the flaws of current benchmarks is the strong and prevalent real-world priors displayed throughout the data [34, 9, 2] – most tomatoes are red and most tables are wooden. These in turn are exploited by VQA models, which become heavily reliant upon such statistical biases and tendencies within the answer distribution to largely circumvent the need for true visual scene understanding [1, 9, 13, 7]. This situation is exacerbated by the simplicity of many of the questions, from both linguistic and semantic perspectives, which in practice rarely require much beyond object recognition [28]. Consequently, early benchmarks led to an inflated sense of the state of scene understanding, severely diminishing their credibility [32]. Aside from that, the lack of annotations regarding question structure and content leaves it difficult to understand the factors affecting models’ behavior and performance and to identify the root causes behind their mistakes.
现有基准最突出的问题,是数据中广泛而强烈的现实世界先验[34, 9, 2]——番茄多半是红的,桌子多半是木头的。VQA 模型正是抓住了答案分布里的这类统计偏差和倾向,从而在很大程度上绕开了对视觉场景的真正理解[1, 9, 13, 7]。许多问题从语言和语义上看都比较简单,实际往往很少超出物体识别[28],使这一情况更加严重。结果是,早期基准让人高估了场景理解的水平,其可信度也大打折扣[32]。除此之外,由于缺少关于问题结构和内容的标注,也很难弄清影响模型行为与表现的因素,并找到错误的根因。
To address these shortcomings, while retaining the visual and semantic richness of real-world images, we introduce GQA, a new dataset for visual reasoning and compositional question answering. We have developed and carefully refined a robust question engine, leveraging content: information about objects, attributes and relations provided through Visual Genome Scene Graphs [17], along with structure: a newly-created extensive linguistic grammar which couples hundreds of structural patterns and detailed lexical semantic resources. Together, they are combined in our engine to generate over 22 million novel and diverse questions, which all come with structured representations in the form of functional programs that specify their contents and semantics, and are visually grounded in the image scene graphs.
为了补上这些不足,同时又保留真实图像在视觉和语义上的丰富性,我们提出 GQA,一套面向视觉推理与组合问答的新数据集。我们开发并仔细打磨了一套稳健的问题引擎,它同时利用内容与结构:内容来自 Visual Genome 场景图提供的物体、属性和关系信息[17];结构则来自我们新编写的大规模语法,把数百种结构模式与细致的词汇语义资源结合在一起。二者在引擎中汇合,生成超过 2200 万条新颖而多样的问题。每条问题都带有函数程序形式的结构化表示,用来标明内容和语义,并在图像场景图中视觉接地。
GQA questions involve varied reasoning skills, and multi-step inference in particular. We further use the associated semantic representations to greatly reduce biases within the dataset and control for its question type composition, downsampling it to create a 1.7M balanced dataset. Contrary to VQA 2.0, here we balance not only binary questions, but also open ones, by applying a tunable smoothing technique that makes the answer distribution for each question group more uniform. Just like a well-designed exam, our benchmark makes the educated guesses strategy far less rewarding, and demands instead more refined comprehension of both the visual and linguistic contents.
GQA 的问题涉及多种推理技能,尤其是多步推理。我们还利用与之配套的语义表示,大幅降低数据集中的偏差,并控制问题类型构成,再下采样得到 170 万条平衡数据集。与 VQA 2.0 不同,这里不仅平衡是非题,也对开放题做可调节的平滑,使每个问题组的答案分布更加均匀。就像一份设计得当的试卷,我们的基准让“凭经验猜”的策略不再那么合算,而要求对视觉和语言内容都有更细致的理解。
Along with the dataset, we have designed a suite of new metrics, which include consistency, validity, plausibility, grounding and distribution scores, to complement the standard accuracy measure commonly used in assessing methods’ performance. Indeed, studies have shown that the accuracy metric alone does not account for a range of anomalous behaviors that models demonstrate, such as ignoring key question words or attending to irrelevant image regions [1, 7]. Other works have argued for the need to devise new evaluation measures and techniques to shed more light on systems’ inner workings [16, 29, 30, 15]. In fact, beyond providing new metrics, GQA can even directly support the development of more interpretable models, as it provides a sentence-long explanation that corroborates each answer, and further associates each word from both the questions and the responses with a visual pointer to the relevant region in the image, similar in nature to datasets by Zhu et al. [36], Park et al. [26], and Li et al. [19]. These in turn can serve as a strong supervision signal to train models with enhanced transparency and accessibility.
除了数据集本身,我们还设计了一套新指标,包括一致性、有效性、合理性、接地和分布分数,用来补充评估方法时常用的准确率。的确,已有研究表明,单看准确率解释不了模型表现出的一类异常行为,例如忽略问题中的关键词,或把注意力放到无关的图像区域[1, 7]。也有工作主张,需要设计新的评价方式,才能更清楚地观察系统的内部机制[16, 29, 30, 15]。事实上,GQA 还不只是提供新指标:它可以为每条答案配上一句解释,并把问题和回答中的每个词,与图像中的相关区域用视觉指针对应起来,性质上接近 Zhu 等人[36]、Park 等人[26]以及 Li 等人[19]的数据集。这些指针进而可以作为强监督信号,用来训练更透明、更可检查的模型。
GQA combines the best of both worlds, having clearly defined and crisp semantic representations on the one hand but enjoying the semantic and visual richness of real-world images on the other. Our three main contributions are (1) the GQA dataset as a resource for studying visual reasoning; (2) development of an effective method for generating a large number of semantically varied questions, which marries scene graph representations with computational linguistic methods; (3) new metrics for GQA, that allow for better assessment of system success and failure modes, as demonstrated through a comprehensive performance analysis of existing models on this task. We hope that the GQA dataset will provide fertile ground for the development of novel methods that push the boundaries of question answering and visual reasoning.
GQA 想把两方面的长处合在一起:一方面有清晰明确的语义表示,另一方面又享有真实世界图像的语义与视觉丰富性。我们的三项主要贡献是:(1)把 GQA 数据集作为研究视觉推理的资源;(2)发展出一种能生成大量语义多样问题的有效方法,把场景图表示与计算语言学方法结合起来;(3)为 GQA 提出新的指标,以便更好地评估系统的成败模式,并通过对现有模型的全面性能分析加以展示。我们希望 GQA 数据集能为新方法的发展提供土壤,把问答和视觉推理的边界再往前推一步。
- Related Work
- 相关工作
Recent years have witnessed tremendous progress in visual understanding. Multiple attempts have been made to mitigate the systematic biases of VQA datasets as discussed in section 1 [9, 34, 2, 13], but they fall short in providing an adequate solution: Some approaches operate over constrained and synthetic images [34, 13], neglecting the realism and diversity natural photos provide. Meanwhile, Goyal et al. [9] associate most of the questions in VQA1.0 with a pair of similar pictures that result in different answers. While offering partial relief, this technique fails to address open questions, leaving their answer distribution largely unbalanced. In fact, since the method does not cover 29% of the questions due to limitations of the annotation process, even within the binary ones biases still remain.1
近年来,视觉理解取得了很大进展。如第 1 节所述,已有多项工作试图减轻 VQA 数据集中的系统性偏差[9, 34, 2, 13],但都还没有给出充分的解决办法:有些方法只在受限的合成图像上操作[34, 13],忽略了自然照片所提供的真实感和多样性。与此同时,Goyal 等人[9]把 VQA1.0 中的大多数问题与一对相似、答案却不同的图片对应起来。这一做法能带来部分缓解,却处理不了开放题,使其答案分布在很大程度上仍不平衡。事实上,由于标注过程的限制,该方法未能覆盖 29% 的问题,即便在是非题内部,偏差也仍然存在。
1For VQA1.0, blind models achieve 50% in accuracy without even considering the images whatsoever [3]. Similarly, for VQA2.0, 67% and 27% of the binary and open questions respectively are answered correctly by such models [9].
1在 VQA1.0 上,盲模型即使完全不看图像,准确率也能达到 50%[3]。类似地,在 VQA2.0 上,这类模型对是非题和开放题的正确率分别约为 67% 和 27%[9]。
At the other extreme, Agrawal et al. [2] partition the questions into training and validation sets such that their respective answer distributions become intentionally dissimilar. While undoubtedly challenging, these adversarial settings penalize models, maybe unjustly, for learning salient properties of the training data. In the absence of other information, making an educated guess is a legitimate choice – a valid and beneficial strategy pursued by machines and people alike [24, 6, 23]. What we essentially need is a balanced test that is more resilient to such gaming strategies, as we strive to achieve with GQA.
另一个极端是,Agrawal 等人[2]把问题划分到训练集和验证集,使两边的答案分布被故意做得不像。这样的对抗设置无疑更难,但也可能不公平地惩罚那些只是学到了训练数据显著性质的模型。在缺少其他信息时,做一个有根据的猜测本是合理的选择——机器和人都会采用这种有效策略[24, 6, 23]。我们真正需要的,是一份对这类投机策略更有韧性的平衡测验,这也正是 GQA 力求达到的目标。
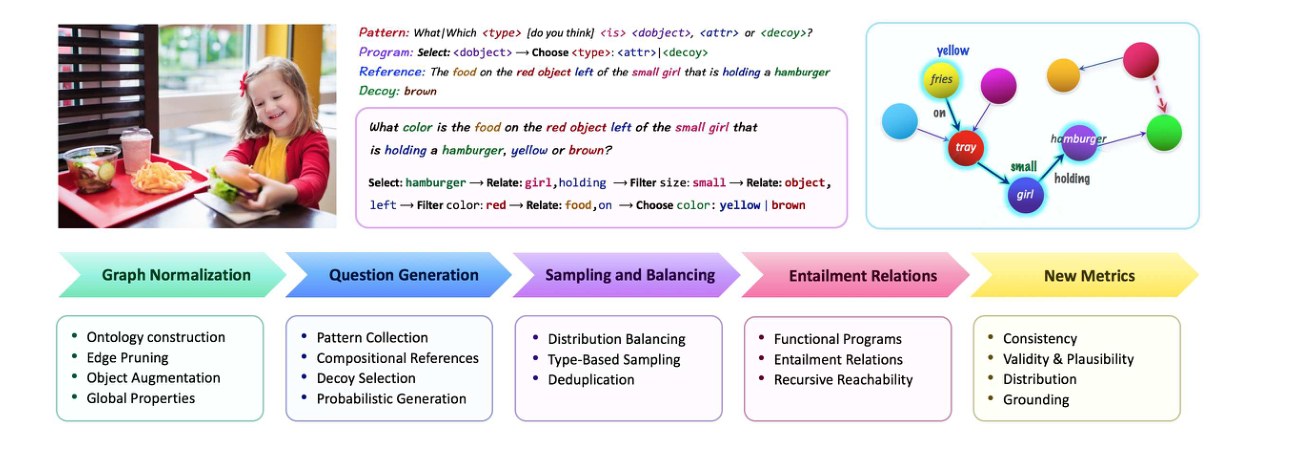
Figure 2: Overview of the GQA construction process. Given an image annotated with a scene graph of its objects, attributes and relations, we produce compositional questions by traversing the graph. Each question has both a standard natural-language form and a functional program representing its semantics. Please refer to section 3 for further detail.
图 2:GQA 构建过程概览。给定一幅标有物体、属性和关系场景图的图像,我们通过遍历该图来生成组合问题。每条问题既有标准的自然语言形式,也有表示其语义的函数程序。细节请见第 3 节。
In creating GQA, we drew inspiration from the CLEVR task [13], which consists of compositional questions over synthetic images. However, its artificial nature and low diversity, with only a handful of object classes and properties, makes it particularly vulnerable to memorization of all combinations, thereby reducing its effective degree of compositionality. Conversely, GQA operates over real images and a large semantic space, making it much more challenging. Even though our questions are not natural as in other VQA datasets [9, 36], they display a rich vocabulary and diverse linguistic and grammatical structures. They may serve in fact as a cleaner benchmark to assess models in a more controlled and comprehensive fashion, as discussed below.
在创建 GQA 时,我们从 CLEVR 任务[13]中获得了启发,后者是在合成图像上提出组合问题。不过,CLEVR 的人工性质和较低多样性——只有少数物体类别和属性——使它特别容易被把所有组合都记住,从而降低了有效的组合程度。相反,GQA 作用于真实图像和更大的语义空间,挑战要高得多。尽管我们的问题并不像其他 VQA 数据集那样自然[9, 36],它们仍展现出丰富的词汇以及多样的语言和语法结构。如下文所述,它们实际上可以作为一个更干净的基准,在更受控、也更全面的条件下评估模型。
The task of question generation has been explored in earlier work, mostly for the purpose of data augmentation. Contrary to GQA, those datasets are either small in scale [22] or use only a restricted set of objects and a handful of non-compositional templates [15, 21]. Neural alternatives to visual question generation have been recently proposed [25, 12, 35], but they aim at a quite different goal of creating engaging but potentially inaccurate questions about the wider context of the image such as subjective evoked feelings or speculative events that may lead to or result from the depicted scenes [25].
问题生成这一任务在较早工作中已有探讨,大多是为了做数据增强。与 GQA 不同,那些数据集要么规模较小[22],要么只用受限制的一组物体和少量非组合模板[15, 21]。近来也有人提出用神经网络做视觉问题生成[25, 12, 35],但其目标相当不同:它们希望造出更吸引人、却未必准确的问题,去问图像更宽的语境,例如主观唤起的感受,或可能导向、或由所绘场景引发的推测性事件[25]。
- The GQA Dataset
- GQA 数据集
The GQA dataset centers around real-world reasoning, scene understanding and compositional question answering. It consists of 113K images and 22M questions of assorted types and varying compositionality degrees, measuring performance on an array of reasoning skills such as object and attribute recognition, transitive relation tracking, spatial reasoning, logical inference and comparisons. Figure 2 provides a brief overview of the GQA components and generation process, and figure 3 presents multiple instances from the dataset. The dataset along with further information are available at visualreasoning.net.
GQA 数据集围绕真实世界推理、场景理解和组合问答展开。它包含 11.3 万幅图像和 2200 万条类型各异、组合程度不等的问题,用来衡量物体与属性识别、传递关系追踪、空间推理、逻辑推断和比较等一系列推理技能。图 2 简要展示了 GQA 的组成部分和生成过程,图 3 给出了数据集中的若干实例。数据集及更多信息可在 visualreasoning.net 获取。
The images, questions and corresponding answers are all accompanied by matching semantic representations: Each image is annotated with a dense Scene Graph [14, 17], representing the objects, attributes and relations it contains. Each question is associated with a functional program which lists the series of reasoning steps needed to be performed to arrive at the answer. Each answer is augmented with both textual and visual justifications, pointing to the relevant region within the image.
图像、问题和相应答案都配有匹配的语义表示:每幅图像标注有稠密场景图[14, 17],表示其中的物体、属性和关系。每条问题配有一个函数程序,列出为得到答案所需执行的一系列推理步骤。每条答案还补充了文本和视觉上的说明,指向图像中的相关区域。
The structured representations and detailed annotations for images and questions offer multiple advantages. They enable tight control over the answer distribution, which allows us to create a balanced set of challenging questions, and support the formulation of a suite of new metrics that aim to provide deeper insight into models’ behavior. They facilitate performance assessment along various axes of question type and topology, and may open the door for the development of novel methods with more grounded and transparent knowledge representation and reasoning.
图像和问题上的结构化表示与细致标注带来多方面好处。它们使我们可以严格控制答案分布,从而构造出一组有挑战性的平衡问题,并支撑一套旨在更深入观察模型行为的新指标。它们便于按问题类型和拓扑的不同轴线评估表现,也可能为发展知识表示与推理更落地、更透明的新方法打开大门。
We proceed by describing the GQA question engine and the four-step dataset construction pipeline: First, we thoroughly clean, normalize, consolidate and augment the Visual Genome scene graphs [17] linked to each image. Then, we traverse the objects and relations within the graphs, and marry them with grammatical patterns gleaned from VQA 2.0 [9] and sundry probabilistic grammar rules to produce a semantically-rich and diverse set of questions. In the third stage, we use the underlying semantic forms to reduce biases in the conditional answer distribution, resulting in a balanced dataset that is more robust against shortcuts and guesses. Finally, we discuss the question functional representation, and explain how we use it to compute entailment between questions, supporting new evaluation metrics.
接下来我们说明 GQA 的问题引擎,以及四步数据集构建流程:首先,对与每幅图像关联的 Visual Genome 场景图[17]做彻底的清理、规范化、合并和增强。然后,遍历图中的物体和关系,把它们与从 VQA 2.0[9]中归纳出的语法模式以及若干概率语法规则结合起来,生成语义丰富、形式多样的问题。第三步,我们利用底层语义形式来减少条件答案分布中的偏差,得到一套对捷径和猜测更有韧性的平衡数据集。最后,我们讨论问题的函数表示,并说明如何用它计算问题之间的蕴涵,以支持新的评价指标。
3.1. Scene Graph Normalization
3.1. 场景图规范化
Our starting point in creating the GQA dataset is the Visual Genome Scene Graph annotations [17] that cover 113k images from COCO [20] and Flickr [31].2 The scene graph serves as a formalized representation of the image: each node denotes an object, a visual entity within the image, like a person, an apple, grass or clouds. It is linked to a bounding box specifying its position and size, and is marked up with about 1–3 attributes, properties of the object: e.g., its color, shape, material or activity. The objects are connected by relation edges, representing actions (verbs), spatial relations (prepositions), and comparatives.
创建 GQA 数据集的起点,是覆盖来自 COCO[20]和 Flickr[31]的 11.3 万幅图像的 Visual Genome 场景图标注[17]。场景图是图像的形式化表示:每个节点表示一个物体,也就是图像中的一个视觉实体,例如人、苹果、草或云。它与标明位置和大小的边界框相连,并标有大约 1 到 3 个属性,即该物体的性质,例如颜色、形状、材质或活动。物体之间由关系边连接,表示动作(动词)、空间关系(介词)以及比较关系。
2We extend Visual Genome dataset with 5k hidden scene graphs collected through crowdsourcing, used for the test set.
2我们通过众包为 Visual Genome 数据集增补了 5000 个隐藏场景图,用于测试集。
The scene graphs are annotated with free-form natural language. In order to use them for question generation we first have to normalize the graphs and their vocabulary. We provide here a brief overview of the normalization process, and present a more detailed description in the supplementary. First, we create a clean, consolidated and unambiguous ontology over the graph with 2690 classes including various objects, attributes and relations. We further augment it with semantic and linguistic information which will aid us in creating grammatical questions. Then, we prune inaccurate or unnatural edges, using combination of object detection confidences, n-gram frequencies, co-occurrence statistics, word embedding distances, category-based rules, and manual curation. Finally, we enrich the graph with positional information (absolute and relative) as well as semantic properties (location, weather). By the end of this stage, the resulting scene graphs have clean, unified, rich and unambiguous semantics for both the nodes and the edges.
这些场景图是用自由形式的自然语言标注的。为了把它们用于问题生成,我们首先必须对图及其词汇做规范化。这里只给出规范化过程的简要概述,更详细的说明放在补充材料中。首先,我们在图上建立一套干净、合并且无歧义的本体,共 2690 个类别,涵盖各类物体、属性和关系。我们还为它补充将有助于生成合乎语法的问题的语义和语言学信息。随后,我们结合物体检测置信度、n 元语法频率、共现统计、词向量距离、基于类别的规则以及人工整理,删去不准确或不自然的边。最后,我们为图补充位置信息(绝对位置和相对位置)以及语义性质(地点、天气)。到这一阶段结束时,得到的场景图在节点和边上都合乎清晰、统一、丰富且无歧义的语义。
3.2. The Question Engine
3.2. 问题引擎
At the heart of our pipeline is the question engine, responsible for producing diverse, relevant and grammatical questions with varying degrees of compositionality. The generation process harnesses two resources: one is the scene graphs which fuel the engine with rich content – information about objects, attributes and relationships; the other is the structural patterns, a mold that shapes the content, casting it into a question.
整个流程的核心是问题引擎,负责生成多样、相关且合乎语法、组合程度不等的问题。生成过程依靠两类资源:一类是为引擎提供丰富内容的场景图,即关于物体、属性和关系的信息;另一类是结构模式,它像模具一样为内容赋形,把内容铸成问题。
Our engine operates over 524 patterns, spanning 117 question groups, and 1878 answers which are based on the scene graphs. Each group is associated with three components: (1) a functional program that represents its semantics; (2) A set of textual rephrases which express it in natural language, e.g., “What|Which [do you think] ?”; (3) A pair of short and long answers: e.g., and “The .” respectively.3
我们的引擎基于 524 种模式,覆盖 117 个问题组,以及 1878 个由场景图得到的答案。每个组对应三个组成部分:(1)表示其语义的函数程序;(2)一组用自然语言表达该语义的文本复述,例如 “What|Which [do you think] ?”;(3)一对短答案和长答案:例如 以及 “The 。”。
3Note that the long answers can serve as textual justifications, especially for questions that require increased reasoning such as logical inference, where a question like “Is there a red apple in the picture?” may have the answer: “No, there is an apple, but it is green”
3需要指出的是,长答案可以用作文本说明,尤其是对那些需要更多推理的问题。
4For instance, a question-answer pair in VQA1.0 such as “What color is the apple? red” turns after templatization into “What the ? ”.
4例如,VQA1.0 中像 “What color is the apple? red” 这样的问答对,经过模板化后会变成相应的模式。
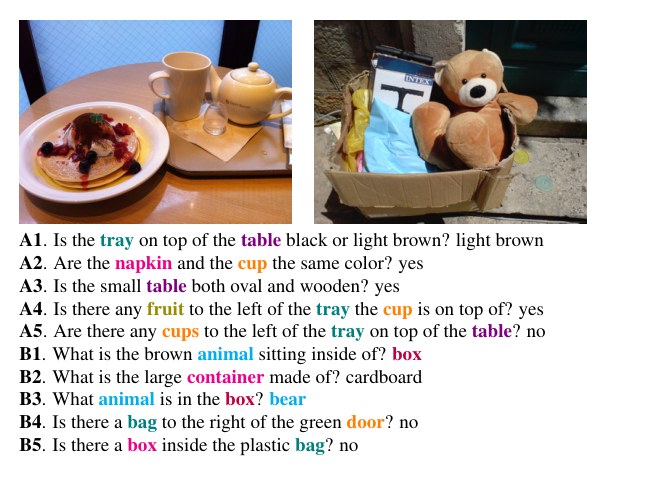
Figure 3: Examples of questions from the GQA dataset.
图 3:GQA 数据集中的问题示例。
We begin from a seed set of 250 manually constructed patterns, and extend it with 274 natural patterns derived from VQA1.0 [3] through templatization of words from our ontology.4 To increase the question diversity, apart from using synonyms for objects and attributes, we incorporate probabilistic sections into the patterns, such as optional phrases [x] and alternate expressions (x|y), which get instantiated at random.
我们从手工构造的 250 个种子模式出发,再通过把本体中的词做模板化,从 VQA1.0[3]中得到 274 个自然模式加以扩充。为了提高问题多样性,除了为物体和属性使用同义词,我们还在模式中加入概率性片段,例如可选短语 [x] 和交替表达 (x|y),并在实例化时随机取值。
It is important to note that the patterns do not strictly limit the structure or depth of each question, but only outline their high-level form, as many of the template fields can be populated with nested compositional references. For instance, in the pattern above, we may replace with “the apple to the left of the white refrigerator”.
需要强调的是,这些模式并不严格限制每个问题的结构或深度,而只勾勒其高层形式,因为许多模板槽位都可以填入嵌套的组合指称。例如,在上面的模式里,我们可能把 替换成 “the apple to the left of the white refrigerator”。
To achieve that compositionality, we compute for each object a set of candidate references, which can either be direct, e.g. the bear, this animal, or indirect, using modifiers, e.g. the white bear, the bear on the left, the animal behind the tree, the bear that is wearing a coat. Direct references are used when the uniqueness of the object can be confidently confirmed by object detectors, making the corresponding references unambiguous. Alternatively, we use indirect references, leading to multi-step questions as varied as Who is looking at the animal that is wearing the red coat in front of the window?, and thus greatly increasing the patterns’ effective flexibility. This is the key ingredient behind the automatic generation of compositional questions.
为了实现这种组合性,我们为每个物体计算一组候选指称,既可以是直接的,例如 the bear、this animal,也可以是带修饰语的间接指称,例如 the white bear、the bear on the left、the animal behind the tree、the bear that is wearing a coat。当物体检测器能够较有把握地确认该物体的唯一性、从而使相应指称没有歧义时,就使用直接指称。否则我们使用间接指称,从而产生像 Who is looking at the animal that is wearing the red coat in front of the window? 这样多步、形式各异的问题,也大大增加了模式实际上的灵活性。这正是自动生成组合问题的关键。
Finally, we compute a set of decoys for the scene graph elements. Indeed, some questions, such as negative ones or those that involve logical inference, pertain to the absence of an object or to an incorrect attribute. Examples include Is the apple green? for a red apple, or Is the girl eating ice cream? when she is in fact eating a cake. Given a triplet (s, r, o), (e.g. (girl, eating, cake) we select a distractor ˆo considering its likelihood to be in relation with s and its plausibility to co-occur in the context of the other objects in the depicted scene. A similar technique is applied in selecting attribute decoys (e.g. a green apple). While choosing distractors, we exclude from consideration candidates that we deem too similar (e.g. pink and orange), based on a manually defined list for each concept in the ontology.
最后,我们为场景图中的元素计算一组干扰项。的确,有些问题,例如否定问题或涉及逻辑推断的问题,问的是某个物体不存在,或属性不正确。例子包括:对红苹果问 Is the apple green?,或在女孩实际上在吃蛋糕时问 Is the girl eating ice cream?。给定三元组 (s, r, o)(例如 (girl, eating, cake)),我们在选择干扰项 ˆo 时,会考虑它与 s 构成该关系的可能性,以及它在所绘场景中其他物体的语境里共现是否合理。选择属性干扰项(例如青苹果)时也用类似方法。在挑选干扰项时,我们会根据本体中为每个概念手工定义的列表,把我们认为过于相近的候选项排除在外(例如 pink 和 orange)。
Having all resources prepared: (1) the clean scene graphs, (2) the structural patterns, (3) the object references and (4) the decoys, we can proceed to generating the questions! We traverse the graph, and for each object, object-attribute pair or subject-relation-object triplet, we produce relevant questions by instantiating a randomly selected question pattern, e.g. “What is , or ?”, populating all the fields with the matching information, yielding, for example, the question: “What (color) (is) the (apple on the table), (red) or (green)?”. When choosing object references, we avoid selecting those that disclose the answer or repeat information, e.g. “What color is the red apple?” or “Which dessert sits besides the apple to the left of the cake?”. We also avoid asking about relations that tend to have multiple instances for the same object, e.g. asking what object is on the table, as there may be multiple valid answers.
在所有资源都准备好之后:(1)干净的场景图,(2)结构模式,(3)物体指称,(4)干扰项,我们就可以开始生成问题。我们遍历图,对每个物体、物体-属性对或主语-关系-宾语三元组,通过实例化一个随机选取的问题模式来产生相关问题,例如 “What is , or ?”,再用匹配的信息填满各个槽位,从而得到例如这样的问题:“What (color) (is) the (apple on the table), (red) or (green)?”。在选择物体指称时,我们避免选用会泄露答案或重复已知信息的指称,例如 “What color is the red apple?” 或 “Which dessert sits besides the apple to the left of the cake?”。对于同一物体上往往有多个实例的关系,例如问桌子上有什么物体,因为可能有多个有效答案,我们也避免提问。
By the end of this stage, we obtain a diverse set of 22M interesting, challenging and grammatical questions, pertaining to each and every aspect of the image.
到这一阶段结束时,我们得到了 2200 万条多样、有趣、有挑战性且合乎语法的问题,覆盖图像的方方面面。
3.3. Functional Representation and Entailment
3.3. 函数表示与蕴涵
Each question pattern is associated with a structured representation in the form of a functional program. For instance, the question What color is the apple on the white table? is semantically equivalent to the following program: select: table →filter: white →relate(subject,on): apple →query: color. As we can see, these programs are composed of atomic operations such as object selection, traversal along a relation edge, or an attribute verification, which are then chained together to create challenging reasoning questions.
每种问题模式都对应一种函数程序形式的结构化表示。例如,问题 What color is the apple on the white table? 在语义上等价于如下程序:select: table →filter: white →relate(subject,on): apple →query: color。可以看出,这些程序由物体选择、沿关系边遍历、或属性核验等原子操作组成,再把它们串联起来,形成有挑战性的推理问题。
The semantically unambiguous representations offer multiple advantages over free-form unrestricted questions. For one thing, they enable comprehensive assessment of methods by dissecting their performance along different axes of question textual and semantic lengths, type and topology, thus facilitating the diagnosis of their success and failure modes (section 4.2). Second, they aid us in balancing the dataset distribution, mitigating its question-conditional priors and guarding against educated guesses (section 3.4). Finally, they allow us to identify entailment and equivalence relations between different questions: knowing the answer to the question What color is the apple? allows a coherent learner to infer the answer to the questions Is the apple red? Is it green? etc. The same goes especially for questions that involve logical inference like or and and operations or spatial reasoning, e.g. left and right.
与自由形式、不受限制的问题相比,这种语义上无歧义的表示有多方面好处。首先,它们使我们可以沿问题的文本长度和语义长度、类型和拓扑等不同轴线剖析方法的表现,从而更全面地评估方法,也便于诊断其成败模式(第 4.2 节)。其次,它们帮助我们平衡数据集分布,减轻问题条件先验,防止凭经验猜测(第 3.4 节)。最后,它们让我们能够识别不同问题之间的蕴涵和等价关系:知道 What color is the apple? 的答案,一个连贯的学习者就应能推断出 Is the apple red?、Is it green? 等问题的答案。对于涉及 or 和 and 等逻辑推断,或 left 和 right 等空间推理的问题,尤其如此。
As further discussed in section 4.4, this entailment property can be used to measure the coherence and consistency of the models, shedding new light on their inner workings, compared to the widespread but potentially misleading accuracy metric. We define direct entailment relations between the various functional programs and use these to recursively compute all the questions that can be entailed from a given source. A complete catalog of the functions, their associated question types, and the entailment relations between them is provided in the supplementary.
如第 4.4 节将进一步讨论的,这种蕴涵性质可以用来衡量模型的连贯性和一致性,从而比广泛使用、却可能产生误导的准确率指标,更能说明模型内部是如何工作的。我们在不同函数程序之间定义直接蕴涵关系,并据此递归计算出可由给定源问题推出的全部问题。各函数、与之对应的问题类型,以及它们之间的蕴涵关系的完整目录,见补充材料。
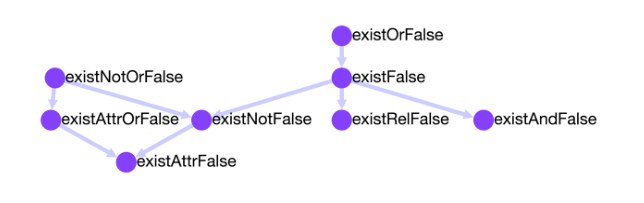
Figure 4: Examples of entailment relations between different question types. Refer to section 3.3 for further detail.
图 4:不同问题类型之间的蕴涵关系示例。进一步说明见第 3.3 节。
3.4. Sampling and Balancing
3.4. 采样与平衡
One of the main issues of existing VQA datasets is the prevalent question-conditional biases that allow learners to make educated guesses without truly understanding the presented images, as explained in section 1. However, precise representation of the question semantics can allow tighter control over these biases, having the potential to greatly alleviate the problem. We leverage this observation and use the functional programs attached to each question to smooth out the answer distribution.
现有 VQA 数据集的一个主要问题,是普遍存在的问题条件偏差,使学习者可以在并未真正理解所给图像的情况下做出有根据的猜测,这一点已在第 1 节说明。不过,对问题语义的精确表示可以更严格地控制这些偏差,从而有可能大大缓解这一问题。我们正是利用这一观察,借助每条问题所附的函数程序,来平滑答案分布。
Given a question’s functional program, we derive two labels, global and local: The global label assigns the question to its answer type, e.g. color for What color is the apple?. The local label further considers the main subject/s of the question, e.g. apple-color or table-material. We use these labels to partition the questions into groups, and smooth the answer distribution of each group within the two levels of granularity, first globally, and then locally.
给定问题的函数程序,我们导出两个标签,分别是全局标签和局部标签:全局标签把问题归到其答案类型,例如对 What color is the apple? 归为 color。局部标签进一步考虑问题的主体,例如 apple-color 或 table-material。我们用这些标签把问题划分成组,并在这两个粒度上平滑每组的答案分布,先做全局,再做局部。
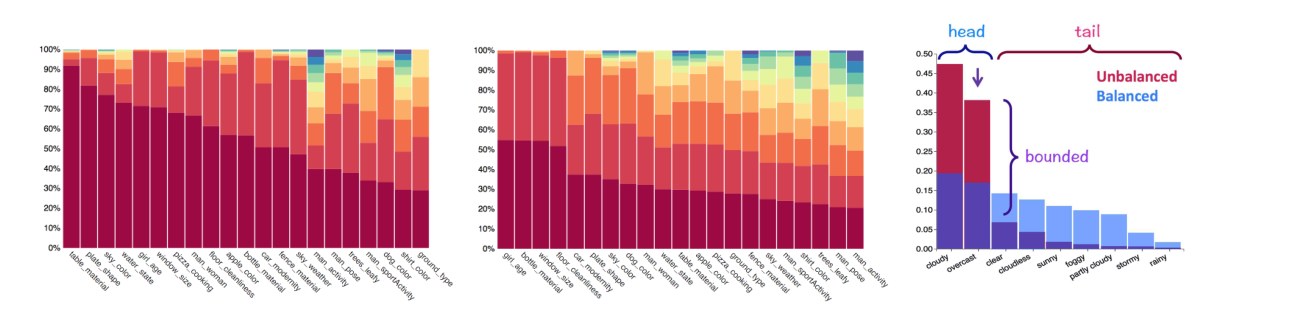
Figure 5: Visualization of the balancing process. The conditional answer distribution before (left) and after (middle) the balancing for a selection of question groups. We show the top 10 answers, where the column height corresponds to the relative frequency of each answer. We can see that on the left the distributions are heavily biased, while on the middle it is more uniform and with heavier tails, while intentionally retaining the original real-world tendencies up to a tunable degree. Right: An illustration of the balancing process.
图 5:平衡过程的可视化。对若干问题组,给出平衡前(左)和平衡后(中)的条件答案分布。我们展示前 10 个答案,柱高对应各答案的相对频率。可以看到,左侧分布偏差很大,中间则更均匀、尾部更厚,同时在可调节的程度上有意保留了原来的现实世界倾向。右图是对平衡过程的示意。
For each group, we first compute its answer distribution , which we then downsample (formally, using rejection-sampling) to fit a smoother answer distribution derived through the following procedure: We iterate over the answers of that group in decreasing frequency order, and reweight ’s head up to the current iteration to make it more comparable to the tail size. While repeating this operation as we go through the answers, iteratively “moving” probability from the head into the tail [27], we also maintain minimum and maximum ratios between each pair of subsequent answers (sorted by frequency). This ensures that the relative frequency-based answer ranking stays the same.
对每个组,我们首先计算其答案分布 ,再对其进行下采样(形式上采用拒绝采样),使其拟合由如下步骤得到的更平滑的答案分布 :我们按频率从高到低遍历该组的答案,并重新加权截至当前迭代的 的头部,使其与尾部规模更为接近。在我们逐个经过这些答案、重复这一操作、从而把概率从头部“移”向尾部的过程中[27],我们还对(按频率排序后的)每一对相邻答案维持最小和最大比率。这保证了基于相对频率的答案排序保持不变。
The advantage of this scheme is that it retains the general real-world tendencies, smoothing them out up to a tunable degree to make the benchmark more challenging and less biased. Refer to figure 5 for a visualization and to the supplementary for a precise depiction of the procedure. Since balancing is performed in two granularity levels, the obtained answer distributions are made more uniform both locally and globally. Quantitatively, the entropy of the answer distribution is increased by 72%, confirming the success of this stage.
这一方案的好处在于,它保留了总体的现实世界倾向,只在可调节的程度上把它们抹平,从而使基准更有挑战性、偏差更小。可视化见图 5,该过程的精确描述见补充材料。由于平衡是在两个粒度上进行的,得到的答案分布在局部和全局都会更加均匀。从数量上看,答案分布的熵增加了 72%,证实了这一阶段的效果。
Finally, we downsample the questions based on their type to control the dataset type composition, and filter out redundant questions that are too semantically similar to existing ones. We split the dataset into 70% train, 10% validation, 10% test and 10% challenge, making sure that all the questions about a given image appear in the same split.
最后,我们按类型对问题做下采样,以控制数据集的类型构成,并过滤掉与已有问题语义过于相近的冗余问题。我们把数据集划分为 70% 训练、10% 验证、10% 测试和 10% 挑战,并保证关于同一幅图像的全部问题都出现在同一个划分中。
- Analysis and Baseline Experiments
- 分析与基线实验
In the following, we provide an analysis of the GQA dataset and evaluate the performance of baselines, state-of-the-art models and human subjects, revealing a large gap from the latter. To establish the diversity and realism of GQA questions, we test transfer performance between the GQA and VQA datasets. We then introduce the new metrics that complement our dataset, present quantitative results and discuss their implications and merits. In the supplementary, we perform a head-to-head comparison between GQA and the popular VQA 2.0 dataset [9], and proceed with further diagnosis of the current top-performing model, MAC [10], evaluating it along multiple axes such as training-set size, question length and compositionality degree.
接下来,我们对 GQA 数据集进行分析,并评估基线、当时最先进的模型以及人类被试的表现,结果显示与人类之间仍有很大差距。为了确认 GQA 问题的多样性和真实感,我们测试了 GQA 与 VQA 数据集之间的迁移表现。随后我们介绍补充本数据集的新指标,给出定量结果,并讨论它们的含义与价值。在补充材料中,我们还对 GQA 与流行的 VQA 2.0 数据集[9]做了直接比较,并进一步诊断当时表现最好的模型 MAC[10],沿训练集规模、问题长度和组合程度等多个轴线对它进行评估。
4.1. Dataset Analysis and Comparison
4.1. 数据集分析与比较
The GQA dataset consists of 22,669,678 questions over 113,018 images, which cover wide range of reasoning skills and vary in length and number of required inference-steps (figure 6). The dataset has a vocabulary size of 3097 words and 1878 possible answers. While smaller than natural language datasets, further investigation reveals that it covers 88.8% and 70.6% of VQA questions and answers respectively, corroborating its wide diversity. A wide selection of dataset visualizations is provided in the supplementary.
GQA 数据集包含 22,669,678 条问题,覆盖 113,018 幅图像,涉及广泛的推理技能,问题长度和所需推理步数也各不相同(图 6)。数据集的词汇量为 3097 个词,可能的答案有 1878 个。虽然比自然语言数据集小,但进一步考察表明,它分别覆盖了 VQA 问题的 88.8% 和答案的 70.6%,印证了其广泛的多样性。补充材料中提供了大量数据集可视化。
We associate each question with two types: structural and semantic. The structural type is derived from the final operation in the question’s functional program. It can be (1) verify for yes/no questions, (2) query for all open questions, (3) choose for questions that present two alternatives to choose from, e.g. “Is it red or blue?”; (4) logical which involve logical inference, and (5) compare for comparison questions between two or more objects. The semantic type refers to the main subject of the question: (1) object: for existence questions, (2) attribute: consider the properties or position of an object, (3) category: related to object identification within some class, (4) relation: for questions asking about the subject or object of a described relation (e.g. “what is the girl wearing?”), and (5) global: about overall properties of the scene such as weather or place. As shown in figure 6, the questions’ types vary at both the semantic and structural levels.
我们为每条问题关联两类类型:结构类型和语义类型。结构类型由问题函数程序中的最后一步操作导出。它可以是:(1)verify,用于是否问题;(2)query,用于所有开放问题;(3)choose,用于给出两个备选项供选择的问题,例如 “Is it red or blue?”;(4)logical,涉及逻辑推断;(5)compare,用于两个或多个物体之间的比较问题。语义类型指问题的主要对象:(1)object:存在性问题;(2)attribute:考虑物体的性质或位置;(3)category:在某一类中做物体识别;(4)relation:询问所描述关系的主语或宾语(例如 “what is the girl wearing?”);(5)global:关于场景的整体性质,例如天气或地点。如图 6 所示,问题类型在语义和结构两个层面都有变化。
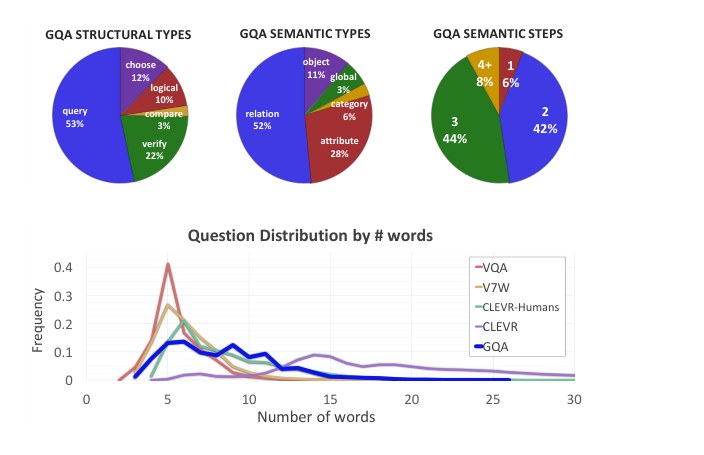
Figure 6: Top: Dataset statistics, partitioned into structural types, semantic types, and the number of reasoning steps. Bottom: VQA datasets question length distribution.
图 6:上:按结构类型、语义类型和推理步数划分的数据集统计。下:各 VQA 数据集的问题长度分布。
4.2. Baseline Experiments
4.2. 基线实验
We analyze an assortment of models as well as human subjects on GQA. The evaluation results are shown in table 1. Baselines include a “blind” LSTM model with access to the questions only, a “deaf” CNN model with access to the images only, an LSTM+CNN model, and two prior models based on the question group, local or global, which return the most common answer for each group, as defined in section 3.3. We can see that they all achieve low results of 17.82%–41.07%. For the LSTM model, inspection of specific question types reveals that it achieves only 22.7% for open query questions, and not far above chance for binary question types. We also evaluate the performance of the bottom-up attention model [4] – the winner of the 2017 VQA challenge, and the MAC model [10] – a state-of-the-art compositional attention model for CLEVR [13]. While surpassing the baselines, they still perform well below human scores5, offering ample opportunity for further research in the visual reasoning domain.
我们在 GQA 上分析了一系列模型以及人类被试。评价结果见表 1。基线包括:只能看到问题的“盲”LSTM 模型、只能看到图像的“聋”CNN 模型、LSTM+CNN 模型,以及两个基于问题组(局部或全局)的先验模型,它们返回第 3.3 节所定义的每个组中最常见的答案。可以看到,它们的成绩都较低,只有 17.82%–41.07%。对 LSTM 模型,按具体问题类型检查可以发现,它在开放的 query 问题上只有 22.7%,在是非类问题类型上也不远高于随机水平。我们还评估了自下而上注意力模型[4]——2017 年 VQA 挑战的获胜者,以及 MAC 模型[10]——当时在 CLEVR[13]上最先进的组合注意力模型。它们虽然超过了基线,但仍然明显低于人类分数,为视觉推理领域的后续研究留下了充分空间。
5To evaluate human performance, we used Amazon Mechanical Turk to collect human responses for 4000 random questions, taking the majority over 5 answers per question.
5为了评估人类表现,我们通过 Amazon Mechanical Turk 为 4000 条随机问题收集了人类回答,每条问题取 5 个答案中的多数。
4.3. Transfer Performance
4.3. 迁移表现
We tested the transfer performance between the GQA and VQA datasets, training on one and testing on the other: A MAC model trained on GQA achieves 52.1% on VQA before fine-tuning and 60.5% afterwards. Compare these with 51.6% for LSTM+CNN and 68.3% for MAC, when both are trained and tested on VQA. These quite good results demonstrate the realism and diversity of GQA questions, showing that the dataset can serve as a good proxy for human-like questions. In contrast, MAC trained on VQA gets 39.8% on GQA before fine-tuning and 46.5% afterwards, illustrating the further challenge GQA poses.
我们测试了 GQA 与 VQA 数据集之间的迁移表现,在其中一个上训练、在另一个上测试:在 GQA 上训练的 MAC 模型,在微调前于 VQA 上达到 52.1%,微调后达到 60.5%。相比之下,LSTM+CNN 和 MAC 若都在 VQA 上训练并测试,成绩分别是 51.6% 和 68.3%。这些相当不错的结果说明了 GQA 问题的真实感和多样性,表明该数据集可以较好地代理接近人类风格的问题。相反,在 VQA 上训练的 MAC,在微调前于 GQA 上只有 39.8%,微调后为 46.5%,说明 GQA 带来了进一步的挑战。
4.4. New Evaluation Metrics
4.4. 新的评价指标
Apart from the standard accuracy metric and the more detailed type-based diagnosis our dataset supports, we introduce five new metrics to get further insight into visual reasoning methods and point to missing capabilities we believe coherent reasoning models should possess.
除了标准的准确率指标,以及本数据集所支持的更细致的按类型诊断之外,我们还引入五项新指标,以便进一步观察视觉推理方法,并指出我们认为连贯的推理模型应当具备、却往往缺失的能力。
Consistency. This metric measures responses consistency across different questions. Recall that in section 3.3, we used the questions’ semantic representation to derive equivalence and entailment relations between them. When being presented with a new question, any learner striving to be trustworthy should not contradict its previous answers. It should not answer green to a new question about an apple it has just identified as red.
一致性。这一指标衡量模型在不同问题上回答是否一致。请回忆第 3.3 节,我们曾用问题的语义表示导出它们之间的等价和蕴涵关系。当面对一个新问题时,任何力求可信的学习者不应当与自己先前的答案相矛盾。它刚刚把一只苹果识别为红色,就不该在新问题里又回答绿色。
For each question-answer pair (q, a), we define a set Eq = q1, q2, . . . , qn of entailed questions, the answers to which can be unambiguously inferred given (q, a). For instance, given the question-answer pair Is there a red apple to the left of the white plate? yes, we can infer the answers to questions such as Is the plate to the right of the apple?, Is there a red fruit to the left of the plate?, What is the white thing to the right of the apple?, etc. For each question q in Q – the set of questions the model answered correctly, we measure the model’s accuracy over the entailed questions Eq and then average these scores across all questions in Q.
对每个问答对 ,我们定义一组蕴涵问题 ,其答案可由 无歧义地推出。例如,给定问答对 Is there a red apple to the left of the white plate? yes,我们就可以推断出 Is the plate to the right of the apple?、Is there a red fruit to the left of the plate?、What is the white thing to the right of the apple? 等问题的答案。对模型答对的问题集合 中的每个问题 ,我们衡量模型在蕴涵问题 上的准确率,再对 中的全部问题取平均。
We see that while people have exceptional consistency of 98.4%, even the best models are inconsistent in about 1 out of 5 questions, and models such as LSTM contradict themselves almost half the time. Achieving high consistency may require deeper understanding of the question semantics in the context of the image, and, in contrast with accuracy, is more robust against educated guesses as it inspects connections between related questions, and thus may serve as a better measure of models’ true visual understanding skills.
可以看到,人的一致性极高,达到 98.4%,即便最好的模型也大约每 5 个问题就会有一次不一致,而像 LSTM 这样的模型几乎一半时间会自相矛盾。要达到高一致性,可能需要对图像语境中的问题语义有更深的理解;与准确率不同,它在考察相关问题之间的联系,因而对凭经验猜测更有韧性,也因此可能更好地衡量模型真正的视觉理解能力。
Validity and Plausibility. The validity metric checks whether a given answer is in the question scope, e.g. responding some color to a color question. The plausibility score goes a step further, measuring whether the answer is reasonable, or makes sense, given the question (e.g. elephant usually do not eat, say, pizza). Specifically, we check whether the answer occurs at least once in relation with the question’s subject, across the whole dataset. Thus, we consider e.g., red and green as plausible apple colors and, conversely, purple as implausible.6 The experiments show that models fail to respond with plausible or even valid answers at least 5–15% of the times, indicating limited comprehension of some questions. Given that these properties are noticeable statistics of the dataset’s conditional answer distribution, not even depending on the specific images, we would expect a sound method to achieve higher scores.
有效性与合理性。有效性指标检查给定答案是否落在问题的范围内,例如对颜色问题回答某种颜色。合理性分数则更进一步,衡量该答案在给定问题上是否合理、说得通(例如大象通常不会去吃披萨)。具体来说,我们检查在整个数据集中,该答案是否至少与问题的主体一起出现过一次。因此,我们把红色和绿色视为合理的苹果颜色,而把紫色视为不合理。实验表明,模型至少在 5%–15% 的情况下会给出不合理、甚至无效的答案,说明它们对一些问题的理解仍然有限。鉴于这些性质是数据集条件答案分布中可观察到的统计,甚至并不依赖于具体图像,我们会期望一个健全的方法取得更高的分数。
6While the plausibility metric may not be fully precise especially for infrequent objects due to potential data scarcity issues, it may provide a good sense of the general level of world knowledge the model has acquired.
6由于潜在的数据稀疏问题,合理性指标对不常见物体可能并不完全精确,但它仍可以较好地反映模型所获得的世界知识的总体水平。
Distribution. To get further insight into the extent to which methods manage to model the conditional answer distribution, we define the distribution metric, which measures the overall match between the true answer distribution and the model predicted distribution, using Chi-Square statistic [18]. It allows us to see if the model predicts not only the most common answers but also the less frequent ones. Indeed, the experiments demonstrate that the leading SOTA models score lower than the baselines (for this metric, lower is better), indicating increased capacity in fitting more subtle trends of the dataset’s distribution.
分布。为了进一步观察方法在多大程度上建模了条件答案分布,我们定义分布指标,用卡方统计量[18]衡量真实答案分布与模型预测分布的总体吻合程度。它让我们看到,模型是否不仅能预测最常见的答案,也能预测较少出现的答案。实验表明,领先的当时最先进模型在这一指标上低于基线(对该指标而言,越低越好),说明它们拟合数据集分布中更细微趋势的能力更强。
Grounding. For attention-based models, the grounding score checks whether the model attends to regions within the image that are relevant to the question. For each dataset instance, we define a pointer r to the visual region which the question or answer refer to, and measure the model’s visual attention (probability) over that region. This metric allows us to evaluate the degree to which the model grounds its reasoning in the image, rather than just making educated guesses based on question priors or world tendencies.
接地。对基于注意力的模型,接地分数检查模型是否把注意力放到了与问题相关的图像区域上。对每个数据实例,我们定义一个指向问题或答案所涉及的视觉区域的指针 ,并衡量模型在该区域上的视觉注意力(概率)。这一指标让我们评估模型在多大程度上把推理建立在图像上,而不是仅仅依据问题先验或世界倾向做有根据的猜测。
Indeed, the models mostly attend to the relevant regions in the image, with grounding scores of about 80%. To verify the reliability of the metric, we further perform experiments with spatial features instead of the object-informed ones used by BottomUp [4] and MAC [10], which lead to a much lower 43% score, demonstrating that object-based features provide models with better granularity for the task, allowing them to focus on more pertinent regions than with the coarser spatial features.
的确,这些模型大多把注意力放到了图像中的相关区域,接地分数约为 80%。为了验证该指标的可靠性,我们还做了用空间特征代替 BottomUp[4]和 MAC[10]所用的物体相关特征的实验,得到的分数低得多,只有 43%。这说明基于物体的特征为该任务提供了更好的粒度,使模型能够比更粗糙的空间特征更准确地聚焦于相关区域。
| Metric | Global Prior | Local Prior | CNN | LSTM | CNN+LSTM | BottomUp | MAC | Humans |
|---|---|---|---|---|---|---|---|---|
| Open | 16.52 | 16.99 | 1.74 | 22.69 | 31.80 | 34.83 | 38.91 | 87.4 |
| Binary | 42.99 | 47.53 | 36.05 | 61.90 | 63.26 | 66.64 | 71.23 | 91.2 |
| Query | 16.52 | 16.99 | 1.55 | 22.69 | 31.80 | 34.83 | 38.91 | 87.4 |
| Compare | 35.59 | 41.91 | 36.34 | 57.79 | 56.62 | 56.32 | 60.04 | 93.1 |
| Choose | 17.45 | 26.58 | 0.85 | 57.15 | 61.40 | 66.56 | 70.59 | 94.3 |
| Logical | 50.32 | 50.11 | 47.18 | 61.73 | 62.05 | 64.03 | 69.99 | 88.5 |
| Verify | 53.40 | 58.80 | 47.02 | 65.78 | 67.00 | 71.45 | 75.45 | 90.1 |
| Global | 24.70 | 20.19 | 8.64 | 27.22 | 56.57 | 60.29 | 60.82 | 92.3 |
| Object | 49.96 | 54.00 | 47.33 | 74.33 | 75.90 | 78.45 | 81.49 | 88.1 |
| Attribute | 34.89 | 42.67 | 22.66 | 48.28 | 50.91 | 53.88 | 59.82 | 90.7 |
| Relation | 22.88 | 20.16 | 11.60 | 33.24 | 39.45 | 42.84 | 46.16 | 89.2 |
| Category | 15.26 | 17.31 | 3.56 | 22.33 | 37.49 | 41.18 | 44.38 | 90.3 |
| Distribution | 130.86 | 21.56 | 19.99 | 17.93 | 7.46 | 5.98 | 5.34 | - |
| Grounding | - | - | - | - | - | 78.47 | 82.24 | - |
| Validity | 89.02 | 84.44 | 35.78 | 96.39 | 96.02 | 96.18 | 96.16 | 98.9 |
| Plausibility | 75.34 | 84.42 | 34.84 | 87.30 | 84.25 | 84.57 | 84.48 | 97.2 |
| Consistency | 51.78 | 54.34 | 62.40 | 68.68 | 74.57 | 78.71 | 81.59 | 98.4 |
| Accuracy | 28.93 | 31.31 | 17.82 | 41.07 | 46.55 | 49.74 | 54.06 | 89.3 |
Table 1: Results for baselines and state-of-the-art models on the GQA dataset. All results refer to the test set. Models are evaluated for overall accuracy as well as accuracy per type. In addition, they are evaluated by validity, plausibility, distribution, consistency, and when possible, grounding metrics. Please refer to the text for further detail.
| 指标 | 全局先验 | 局部先验 | CNN | LSTM | CNN+LSTM | BottomUp | MAC | 人类 |
|---|---|---|---|---|---|---|---|---|
| 开放 | 16.52 | 16.99 | 1.74 | 22.69 | 31.80 | 34.83 | 38.91 | 87.4 |
| 是非 | 42.99 | 47.53 | 36.05 | 61.90 | 63.26 | 66.64 | 71.23 | 91.2 |
| 询问 | 16.52 | 16.99 | 1.55 | 22.69 | 31.80 | 34.83 | 38.91 | 87.4 |
| 比较 | 35.59 | 41.91 | 36.34 | 57.79 | 56.62 | 56.32 | 60.04 | 93.1 |
| 选择 | 17.45 | 26.58 | 0.85 | 57.15 | 61.40 | 66.56 | 70.59 | 94.3 |
| 逻辑 | 50.32 | 50.11 | 47.18 | 61.73 | 62.05 | 64.03 | 69.99 | 88.5 |
| 核实 | 53.40 | 58.80 | 47.02 | 65.78 | 67.00 | 71.45 | 75.45 | 90.1 |
| 全局 | 24.70 | 20.19 | 8.64 | 27.22 | 56.57 | 60.29 | 60.82 | 92.3 |
| 物体 | 49.96 | 54.00 | 47.33 | 74.33 | 75.90 | 78.45 | 81.49 | 88.1 |
| 属性 | 34.89 | 42.67 | 22.66 | 48.28 | 50.91 | 53.88 | 59.82 | 90.7 |
| 关系 | 22.88 | 20.16 | 11.60 | 33.24 | 39.45 | 42.84 | 46.16 | 89.2 |
| 类别 | 15.26 | 17.31 | 3.56 | 22.33 | 37.49 | 41.18 | 44.38 | 90.3 |
| 分布 | 130.86 | 21.56 | 19.99 | 17.93 | 7.46 | 5.98 | 5.34 | - |
| 接地 | - | - | - | - | - | 78.47 | 82.24 | - |
| 有效性 | 89.02 | 84.44 | 35.78 | 96.39 | 96.02 | 96.18 | 96.16 | 98.9 |
| 合理性 | 75.34 | 84.42 | 34.84 | 87.30 | 84.25 | 84.57 | 84.48 | 97.2 |
| 一致性 | 51.78 | 54.34 | 62.40 | 68.68 | 74.57 | 78.71 | 81.59 | 98.4 |
| 准确率 | 28.93 | 31.31 | 17.82 | 41.07 | 46.55 | 49.74 | 54.06 | 89.3 |
表 1:基线与当时最先进模型在 GQA 数据集上的结果。全部结果均针对测试集。模型既按总体准确率评估,也按类型评估准确率。此外还评估有效性、合理性、分布、一致性,以及在可能时的接地指标。细节请见正文。
- Conclusion
- 结论
In this paper, we introduced the GQA dataset for real-world visual reasoning and compositional question answering. We described the dataset generation process, provided baseline experiments and defined new measures to get more insight into models’ behavior and performance. We believe this benchmark can help drive VQA research in the right directions of deeper semantic understanding, sound reasoning, enhanced robustness and improved consistency. A potential avenue towards such goals may involve more intimate integration between visual knowledge extraction and question answering, two flourishing fields that oftentimes have been pursued independently. We strongly hope that GQA will motivate and support the development of more compositional, interpretable and cogent reasoning models, to advance research in scene understanding and visual question answering.
本文提出了面向真实世界视觉推理与组合问答的 GQA 数据集。我们描述了数据集的生成过程,给出了基线实验,并定义了新的度量,以便更深入地观察模型的行为与表现。我们相信,这一基准有助于把 VQA 研究推向更深的语义理解、更可靠的推理、更强的稳健性和更好的一致性。通向这些目标的一条可能途径,是把视觉知识抽取与问答更紧密地结合起来——这两个活跃领域常常被分开推进。我们由衷希望 GQA 能够推动并支持发展更具组合性、可解释性和说服力的推理模型,从而推进场景理解与视觉问答的研究。
- Acknowledgments
- 致谢
We wish to thank Justin Johnson for discussions about the early versions of this work, and Ross Girshick for his inspirational talk at the VQA workshop 2018. We thank Ranjay Krishna, Eric Cosatto, Alexandru Niculescu-Mizil and the anonymous reviewers for helpful suggestions and comments. Stanford University gratefully acknowledges Facebook Inc., Samsung Electronics Co., Ltd., and the Defense Advanced Research Projects Agency (DARPA) Communicating with Computers (CwC) program under ARO prime contract no. W911NF15-1-0462 for generously supporting this work.
我们感谢 Justin Johnson 就本工作早期版本进行的讨论,以及 Ross Girshick 在 2018 年 VQA 研讨会上富有启发的报告。我们感谢 Ranjay Krishna、Eric Cosatto、Alexandru Niculescu-Mizil 以及匿名审稿人提出的有益建议和意见。斯坦福大学衷心感谢 Facebook Inc.、三星电子株式会社,以及国防高级研究计划局(DARPA)“与计算机交流”(Communicating with Computers,CwC)项目(ARO 主合同编号 W911NF15-1-0462)对本工作的慷慨支持。
References
[1] A. Agrawal, D. Batra, and D. Parikh. Analyzing the behavior of visual question answering models. In EMNLP, pages 1955–1960, 2016. 1, 2
[2] A. Agrawal, D. Batra, D. Parikh, and A. Kembhavi. Don’t just assume; look and answer: Overcoming priors for visual question answering. In Proceedings of the IEEE Conference on Computer Vision and Pattern Recognition (CVPR), pages 4971–4980, 2018. 1, 2
[3] A. Agrawal, J. Lu, S. Antol, M. Mitchell, C. L. Zitnick, D. Parikh, and D. Batra. VQA: Visual question answering. International Journal of Computer Vision, 123(1):4–31, 2017. 1, 2, 4
[4] P. Anderson, X. He, C. Buehler, D. Teney, M. Johnson, S. Gould, and L. Zhang. Bottom-up and top-down attention for image captioning and VQA. arXiv preprint arXiv:1707.07998, 2017. 1, 7, 8
[5] J. Andreas, M. Rohrbach, T. Darrell, and D. Klein. Neural module networks. In Proceedings of the IEEE Conference on Computer Vision and Pattern Recognition (CVPR), pages 39–48, 2016. 1
[6] Y. Attali and M. Bar-Hillel. Guess where: The position of correct answers in multiple-choice test items as a psychometric variable. Journal of Educational Measurement, 40(2):109–128, 2003. 2
[7] A. Das, H. Agrawal, L. Zitnick, D. Parikh, and D. Batra. Human attention in visual question answering: Do humans and deep networks look at the same regions? Computer Vision and Image Understanding, 163:90–100, 2017. 1, 2
[8] A. Fukui, D. H. Park, D. Yang, A. Rohrbach, T. Darrell, and M. Rohrbach. Multimodal compact bilinear pooling for visual question answering and visual grounding. Conference on Empirical Methods in Natural Language Processing (EMNLP), 2016. 1
[9] Y. Goyal, T. Khot, D. Summers-Stay, D. Batra, and D. Parikh. Making the V in VQA matter: Elevating the role of image understanding in visual question answering. In Proceedings of the IEEE Conference on Computer Vision and Pattern Recognition (CVPR), pages 6325–6334, 2017. 1, 2, 3, 6
[10] D. A. Hudson and C. D. Manning. Compositional attention networks for machine reasoning. International Conference for Representation Learning (ICLR), 2018. 1, 6, 7, 8
[11] A. Jabri, A. Joulin, and L. van der Maaten. Revisiting visual question answering baselines. In European conference on computer vision, pages 727–739. Springer, 2016. 1
[12] U. Jain, Z. Zhang, and A. G. Schwing. Creativity: Generating diverse questions using variational autoencoders. In Proceedings of the IEEE Conference on Computer Vision and Pattern Recognition (CVPR), pages 5415–5424, 2017. 3
[13] J. Johnson, B. Hariharan, L. van der Maaten, L. Fei-Fei, C. L. Zitnick, and R. Girshick. Clevr: A diagnostic dataset for compositional language and elementary visual reasoning. In Proceedings of the IEEE Conference on Computer Vision and Pattern Recognition (CVPR), pages 1988–1997, 2017. 1, 2, 3, 7
[14] J. Johnson, R. Krishna, M. Stark, L.-J. Li, D. Shamma, M. Bernstein, and L. Fei-Fei. Image retrieval using scene graphs. In Proceedings of the IEEE Conference on Computer Vision and Pattern Recognition (CVPR), pages 3668–3678, 2015. 3
[15] K. Kafle and C. Kanan. An analysis of visual question answering algorithms. In Computer Vision (ICCV), 2017 IEEE International Conference on, pages 1983–1991. IEEE, 2017. 2, 3
[16] K. Kafle and C. Kanan. Visual question answering: Datasets, algorithms, and future challenges. Computer Vision and Image Understanding, 163:3–20, 2017. 1, 2
[17] R. Krishna, Y. Zhu, O. Groth, J. Johnson, K. Hata, J. Kravitz, S. Chen, Y. Kalantidis, L.-J. Li, D. A. Shamma, et al. Visual genome: Connecting language and vision using crowdsourced dense image annotations. International Journal of Computer Vision, 123(1):32–73, 2017. 1, 2, 3, 4
[18] H. O. Lancaster and E. Seneta. Chi-square distribution. Encyclopedia of biostatistics, 2, 2005. 8
[19] Q. Li, Q. Tao, S. Joty, J. Cai, and J. Luo. VQA-E: Explaining, elaborating, and enhancing your answers for visual questions. arXiv preprint arXiv:1803.07464, 2018. 2
[20] T.-Y. Lin, M. Maire, S. Belongie, J. Hays, P. Perona, D. Ramanan, P. Dollár, and C. L. Zitnick. Microsoft COCO: Common objects in context. In European conference on computer vision, pages 740–755. Springer, 2014. 4
[21] A. Mahendru, V. Prabhu, A. Mohapatra, D. Batra, and S. Lee. The promise of premise: Harnessing question premises in visual question answering. arXiv preprint arXiv:1705.00601, 2017. 3
[22] M. Malinowski and M. Fritz. A multi-world approach to question answering about real-world scenes based on uncertain input. In Advances in neural information processing systems, pages 1682–1690, 2014. 3
[23] J. Millman, C. H. Bishop, and R. Ebel. An analysis of test-wiseness. Educational and Psychological Measurement, 25(3):707–726, 1965. 2
[24] J. J. Mondak and B. C. Davis. Asked and answered: Knowledge levels when we won’t take ‘don’t know’ for an answer. Political Behavior, 23(3):199–224, 2001. 2
[25] N. Mostafazadeh, I. Misra, J. Devlin, M. Mitchell, X. He, and L. Vanderwende. Generating natural questions about an image. arXiv preprint arXiv:1603.06059, 2016. 3
[26] D. H. Park, L. A. Hendricks, Z. Akata, A. Rohrbach, B. Schiele, T. Darrell, and M. Rohrbach. Multimodal explanations: Justifying decisions and pointing to the evidence. In Proceedings of the IEEE Conference on Computer Vision and Pattern Recognition (CVPR), 2018. 2
[27] Y. Rubner, C. Tomasi, and L. J. Guibas. The earth mover’s distance as a metric for image retrieval. International journal of computer vision, 40(2):99–121, 2000. 6
[28] A. Suhr, S. Zhou, I. Zhang, H. Bai, and Y. Artzi. A corpus for reasoning about natural language grounded in photographs. arXiv preprint arXiv:1811.00491, 2018. 2
[29] D. Teney, P. Anderson, X. He, and A. van den Hengel. Tips and tricks for visual question answering: Learnings from the 2017 challenge. arXiv preprint arXiv:1708.02711, 2017. 2
[30] D. Teney, L. Liu, and A. van den Hengel. Graph-structured representations for visual question answering. arXiv preprint, 2017. 2
[31] B. Thomee, D. A. Shamma, G. Friedland, B. Elizalde, K. Ni, D. Poland, D. Borth, and L.-J. Li. Yfcc100m: The new data in multimedia research. arXiv preprint arXiv:1503.01817, 2015. 4
[32] A. Torralba and A. A. Efros. Unbiased look at dataset bias. In Proceedings of the IEEE Conference on Computer Vision and Pattern Recognition (CVPR), pages 1521–1528. IEEE, 2011. 2
[33] Z. Yang, X. He, J. Gao, L. Deng, and A. Smola. Stacked attention networks for image question answering. In Proceedings of the IEEE Conference on Computer Vision and Pattern Recognition (CVPR), pages 21–29, 2016. 1
[34] P. Zhang, Y. Goyal, D. Summers-Stay, D. Batra, and D. Parikh. Yin and yang: Balancing and answering binary visual questions. In Proceedings of the IEEE Conference on Computer Vision and Pattern Recognition (CVPR), pages 5014–5022, 2016. 1, 2
[35] S. Zhang, L. Qu, S. You, Z. Yang, and J. Zhang. Automatic generation of grounded visual questions. arXiv preprint arXiv:1612.06530, 2016. 3
[36] Y. Zhu, O. Groth, M. Bernstein, and L. Fei-Fei. Visual7W: Grounded question answering in images. In Proceedings of the IEEE Conference on Computer Vision and Pattern Recognition (CVPR), pages 4995–5004, 2016. 1, 2, 3