FCOS: Fully Convolutional One-Stage Object Detection
FCOS: Fully Convolutional One-Stage Object Detection
FCOS:全卷积单阶段目标检测
Zhi Tian Chunhua Shen Hao Chen Tong He Thanks: Corresponding author, email: 𝚌𝚑𝚞𝚗𝚑𝚞𝚊 . 𝚜𝚑𝚎𝚗 @ 𝚊𝚍𝚎𝚕𝚊𝚒𝚍𝚎 . 𝚎𝚍𝚞 . 𝚊𝚞 {{\tt chunhua.shen@adelaide.edu.au}} Affiliation: The University of Adelaide, Australia
Abstract
摘要
We propose a fully convolutional one-stage object detector (FCOS) to solve object detection in a per-pixel prediction fashion, analogue to semantic segmentation. Almost all state-of-the-art object detectors such as RetinaNet, SSD, YOLOv3, and Faster R-CNN rely on pre-defined anchor boxes. In contrast, our proposed detector FCOS is anchor box free, as well as proposal free. By eliminating the pre-defined set of anchor boxes, FCOS completely avoids the complicated computation related to anchor boxes such as calculating overlapping during training. More importantly, we also avoid all hyper-parameters related to anchor boxes, which are often very sensitive to the final detection performance. With the only post-processing non-maximum suppression (NMS), FCOS with ResNeXt-64x4d-101 achieves in AP with single-model and single-scale testing, surpassing previous one-stage detectors with the advantage of being much simpler. For the first time, we demonstrate a much simpler and flexible detection framework achieving improved detection accuracy. We hope that the proposed FCOS framework can serve as a simple and strong alternative for many other instance-level tasks. Code is available at:
我们提出一种全卷积单阶段目标检测器(FCOS),用类似语义分割的逐像素预测来做目标检测。几乎所有当时最好的检测器,例如 RetinaNet、SSD、YOLOv3 和 Faster R-CNN,都依赖预先定义的锚框。与它们不同,FCOS 既不使用锚框,也不使用候选区域。去掉预设锚框之后,训练时那些和锚框有关的复杂计算——比如重叠计算——就全部可以省掉。更重要的是,所有和锚框相关、往往对最终检测精度非常敏感的超参数也不再需要。只保留非极大值抑制(NMS)这一后处理,FCOS 搭配 ResNeXt-64x4d-101,在单模型、单尺度测试下即可达到 AP,超过以往的单阶段检测器,同时结构简单得多。我们第一次表明:一套更简单、也更灵活的检测框架可以拿到更高的检测精度。我们希望 FCOS 也能成为许多其他实例级任务的一种简单而有力的替代方案。代码见:
1 Introduction
1 引言
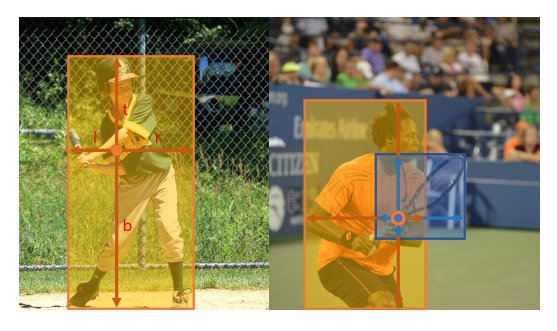
Figure 1: As shown in the left image, FCOS works by predicting a 4D vector encoding the location of a bounding box at each foreground pixel (supervised by ground-truth bounding box information during training). The right plot shows that when a location residing in multiple bounding boxes, it can be ambiguous in terms of which bounding box this location should regress.
图 1:如左图所示,FCOS 的做法是在每个前景像素上预测一个 4 维向量 ,用来表示边界框的位置(训练时由真值框来监督)。右图说明:当某个位置同时落在多个边界框里时,它应该回归哪一个框,就会变得含糊。
Object detection is a fundamental yet challenging task in computer vision, which requires the algorithm to predict a bounding box with a category label for each instance of interest in an image. All current mainstream detectors such as Faster R-CNN [24], SSD [18] and YOLOv2, v3 [23] rely on a set of pre-defined anchor boxes and it has long been believed that the use of anchor boxes is the key to detectors’ success. Despite their great success, it is important to note that anchor-based detectors suffer some drawbacks: 1) As shown in [15, 24], detection performance is sensitive to the sizes, aspect ratios and number of anchor boxes. For example, in RetinaNet [15], varying these hyper-parameters affects the performance up to in AP on the COCO benchmark [16]. As a result, these hyper-parameters need to be carefully tuned in anchor-based detectors. 2) Even with careful design, because the scales and aspect ratios of anchor boxes are kept fixed, detectors encounter difficulties to deal with object candidates with large shape variations, particularly for small objects. The pre-defined anchor boxes also hamper the generalization ability of detectors, as they need to be re-designed on new detection tasks with different object sizes or aspect ratios. 3) In order to achieve a high recall rate, an anchor-based detector is required to densely place anchor boxes on the input image (e.g., more than 180K anchor boxes in feature pyramid networks (FPN) [14] for an image with its shorter side being 800). Most of these anchor boxes are labelled as negative samples during training. The excessive number of negative samples aggravates the imbalance between positive and negative samples in training. 4) Anchor boxes also involve complicated computation such as calculating the intersection-over-union (IoU) scores with ground-truth bounding boxes.
目标检测是计算机视觉里一项基础又困难的任务:算法需要为图像中每一个感兴趣的实例预测边界框,并给出类别标签。当时的主流检测器,例如 Faster R-CNN [24]、SSD [18] 以及 YOLOv2、v3 [23],都依赖一组预先定义的锚框,人们也长期认为锚框是检测器成功的关键。尽管这些方法很成功,锚框检测器仍有几处明显的负担:1)如 [15, 24] 所示,检测性能对锚框的尺寸、长宽比和数量都很敏感。以 RetinaNet [15] 为例,改这些超参数会让 COCO 基准 [16] 上的 AP 最多相差 。因此锚框检测器必须仔细调节这些超参数。2)即便设计得很用心,锚框的尺度和长宽比仍然是固定的,面对形状变化很大的候选物体——尤其是小目标——会遇到困难。预设锚框也会削弱检测器的泛化能力,因为换到物体尺寸或长宽比不同的新检测任务时,锚框往往要重新设计。3)为了拿到高召回,锚框检测器需要在输入图像上密密麻麻地放置锚框(例如,在特征金字塔网络(FPN)[14] 里,短边为 800 的图像会超过 18 万个锚框)。训练时其中绝大多数被标成负样本。负样本过多,会加重训练中的正负样本不平衡。4)锚框还会引入复杂计算,例如与真值框计算交并比(IoU)。
Recently, fully convolutional networks (FCNs) [20] have achieved tremendous success in dense prediction tasks such as semantic segmentation [20, 28, 9, 19], depth estimation [17, 31], keypoint detection [3] and counting [2]. As one of high-level vision tasks, object detection might be the only one deviating from the neat fully convolutional per-pixel prediction framework mainly due to the use of anchor boxes. It is nature to ask a question: Can we solve object detection in the neat per-pixel prediction fashion, analogue to FCN for semantic segmentation, for example? Thus those fundamental vision tasks can be unified in (almost) one single framework. We show that the answer is affirmative. Moreover, we demonstrate that, for the first time, the much simpler FCN-based detector achieves even better performance than its anchor-based counterparts.
近年来,全卷积网络(FCN)[20] 在语义分割 [20, 28, 9, 19]、深度估计 [17, 31]、关键点检测 [3] 和计数 [2] 等稠密预测任务上取得了很大成功。作为高层视觉任务之一,目标检测几乎是唯一仍偏离这种干净的全卷积逐像素预测框架的任务,主要原因正是使用了锚框。于是很自然会问:我们能不能像 FCN 做语义分割那样,用干净的逐像素预测来解决目标检测? 这样一来,这些基础视觉任务就可以(几乎)统一到同一套框架里。我们表明答案是肯定的。而且我们还表明:这种更简单的、基于 FCN 的检测器,第一次取得了比对应锚框方法更好的性能。
In the literature, some works attempted to leverage the FCNs-based framework for object detection such as DenseBox [12]. Specifically, these FCN-based frameworks directly predict a 4D vector plus a class category at each spatial location on a level of feature maps. As shown in Fig. 1 (left), the 4D vector depicts the relative offsets from the four sides of a bounding box to the location. These frameworks are similar to the FCNs for semantic segmentation, except that each location is required to regress a 4D continuous vector. However, to handle the bounding boxes with different sizes, DenseBox [12] crops and resizes training images to a fixed scale. Thus DenseBox has to perform detection on image pyramids, which is against FCN’s philosophy of computing all convolutions once. Besides, more significantly, these methods are mainly used in special domain objection detection such as scene text detection [33, 10] or face detection [32, 12], since it is believed that these methods do not work well when applied to generic object detection with highly overlapped bounding boxes. As shown in Fig. 1 (right), the highly overlapped bounding boxes result in an intractable ambiguity: it is not clear w.r.t. which bounding box to regress for the pixels in the overlapped regions.
文献里已有工作尝试把基于 FCN 的框架用于目标检测,例如 DenseBox [12]。这些框架会在某一层特征图的每个空间位置上,直接预测一个 4 维向量外加一个类别。如图 1(左)所示,这个 4 维向量刻画的是边界框四条边到该位置的相对偏移。它们和用于语义分割的 FCN 很像,只是每个位置还要回归一个连续的 4 维向量。不过,为了处理不同大小的边界框,DenseBox [12] 会把训练图像裁剪并缩放到固定尺度。于是它必须在图像金字塔上做检测,这违背了 FCN“所有卷积只计算一次”的思路。更重要的是,这类方法主要用于场景文本检测 [33, 10] 或人脸检测 [32, 12] 等特定领域,因为人们普遍认为:一旦拿到高度重叠的边界框,把它们用到通用目标检测上效果并不好。如图 1(右)所示,高度重叠的边界框会带来很难处理的歧义:重叠区域里的像素究竟该回归哪一个框,并不清楚。
In the sequel, we take a closer look at the issue and show that with FPN this ambiguity can be largely eliminated. As a result, our method can already obtain comparable detection accuracy with those traditional anchor based detectors. Furthermore, we observe that our method may produce a number of low-quality predicted bounding boxes at the locations that are far from the center of an target object. In order to suppress these low-quality detections, we introduce a novel “center-ness” branch (only one layer) to predict the deviation of a pixel to the center of its corresponding bounding box, as defined in Eq. (3). This score is then used to down-weight low-quality detected bounding boxes and merge the detection results in NMS. The simple yet effective center-ness branch allows the FCN-based detector to outperform anchor-based counterparts under exactly the same training and testing settings.
下文我们会更仔细地看这个问题,并表明:借助 FPN,这种歧义可以在很大程度上被消掉。这样一来,我们的方法已经能拿到和传统锚框检测器相当的检测精度。我们还观察到,在远离目标物体中心的位置上,该方法可能会产生一批低质量的预测框。为了压住这些低质量检测,我们引入一条新的“中心度”分支(只有一层),用来预测某个像素偏离其对应边界框中心的程度,定义见式 (3)。这个分数随后被用来降低低质量检测框的权重,并在 NMS 里合并检测结果。这条简单却有效的中心度分支,让基于 FCN 的检测器在完全相同的训练和测试设定下超过了对应的锚框方法。
This new detection framework enjoys the following advantages.
这套新的检测框架有下面这些好处。
- • Detection is now unified with many other FCN-solvable tasks such as semantic segmentation, making it easier to re-use ideas from those tasks.
- • 检测现在可以和语义分割等许多 FCN 能处理的任务统一起来,也更容易复用那些任务里的想法。
- • Detection becomes proposal free and anchor free, which significantly reduces the number of design parameters. The design parameters typically need heuristic tuning and many tricks are involved in order to achieve good performance. Therefore, our new detection framework makes the detector, particularly its training, considerably simpler.
- • 检测不再依赖候选区域,也不再依赖锚框,设计参数明显减少。这些设计参数通常需要靠启发式去调,还常常夹杂许多技巧才能取得好结果。因此,这套新框架让检测器、尤其是它的训练,明显更简单。
- • By eliminating the anchor boxes, our new detector completely avoids the complicated computation related to anchor boxes such as the IOU computation and matching between the anchor boxes and ground-truth boxes during training, resulting in faster training and testing as well as less training memory footprint than its anchor-based counterpart.
- • 去掉锚框之后,训练时那些和锚框有关的复杂计算——例如 IoU 计算,以及锚框与真值框之间的匹配——就全部可以省掉,训练和测试都更快,训练显存占用也比对应的锚框方法更少。
- • Without bells and whistles, we achieve state-of-the-art results among one-stage detectors. We also show that the proposed FCOS can be used as a Region Proposal Networks (RPNs) in two-stage detectors and can achieve significantly better performance than its anchor-based RPN counterparts. Given the even better performance of the much simpler anchor-free detector, we encourage the community to rethink the necessity of anchor boxes in object detection, which are currently considered as the de facto standard for detection.
- • 不加花哨模块,我们在单阶段检测器里取得了当时最好的结果。我们还表明,FCOS 可以在两阶段检测器里当作区域提议网络(RPN)来用,并且明显超过对应的锚框 RPN。既然更简单的无锚框检测器效果更好,我们希望社区重新思考目标检测里锚框是否仍有必要——眼下它们仍被当成检测的既成标准。
- • The proposed detector can be immediately extended to solve other vision tasks with minimal modification, including instance segmentation and key-point detection. We believe that this new method can be the new baseline for many instance-wise prediction problems.
- • 所提出的检测器只需很少改动,就可以马上推广到实例分割和关键点检测等其他视觉任务。我们相信,这种方法可以成为许多实例级预测问题的新基线。
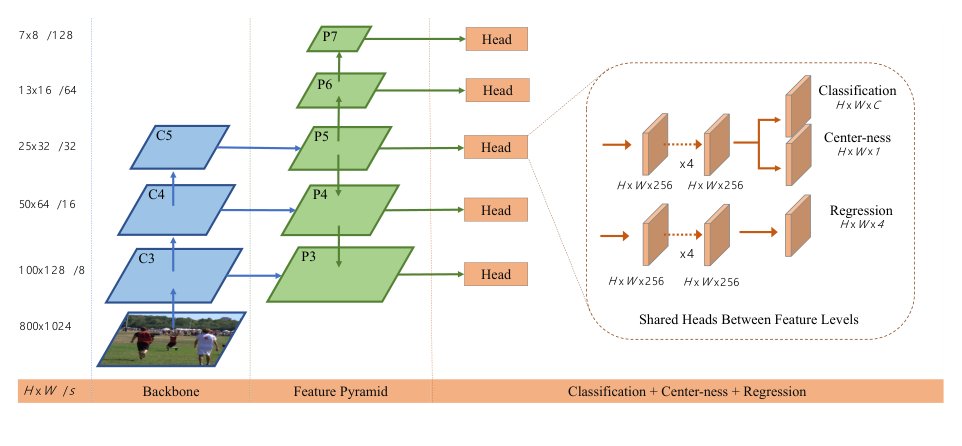
Figure 2: The network architecture of FCOS, where C3, C4, and C5 denote the feature maps of the backbone network and P3 to P7 are the feature levels used for the final prediction. is the height and width of feature maps. ‘/’ () is the down-sampling ratio of the feature maps at the level to the input image. As an example, all the numbers are computed with an input.
图 2:FCOS 的网络结构。、 和 表示骨干网络的特征图, 到 是用于最终预测的特征层。 是特征图的高和宽。‘/’()是该层特征图相对于输入图像的下采样倍率。图中数字以 的输入为例计算。
2 Related Work
2 相关工作
Anchor-based Detectors.
Anchor-based detectors inherit the ideas from traditional sliding-window and proposal based detectors such as Fast R-CNN [6]. In anchor-based detectors, the anchor boxes can be viewed as pre-defined sliding windows or proposals, which are classified as positive or negative patches, with an extra offsets regression to refine the prediction of bounding box locations. Therefore, the anchor boxes in these detectors may be viewed as training samples. Unlike previous detectors like Fast RCNN, which compute image features for each sliding window/proposal repeatedly, anchor boxes make use of the feature maps of CNNs and avoid repeated feature computation, speeding up detection process dramatically. The design of anchor boxes are popularized by Faster R-CNN in its RPNs [24], SSD [18] and YOLOv2 [22], and has become the convention in a modern detector.
基于锚框的检测器。
锚框检测器继承了传统滑动窗口以及基于候选区域的检测器(例如 Fast R-CNN [6])的思路。在这些检测器里,锚框可以被看成预先定义好的滑动窗口或候选框:它们被分成正样本或负样本图块,再额外回归一组偏移,用来微调边界框位置。因此,这些检测器里的锚框也可以被看成训练样本。和 Fast R-CNN 那种对每个滑动窗口/候选框反复计算图像特征的做法不同,锚框直接使用 CNN 的特征图,避免了重复的特征计算,从而大幅加快检测。锚框的设计因 Faster R-CNN 中的 RPN [24]、SSD [18] 和 YOLOv2 [22] 而流行起来,并成为现代检测器的惯例。
However, as described above, anchor boxes result in excessively many hyper-parameters, which typically need to be carefully tuned in order to achieve good performance. Besides the above hyper-parameters describing anchor shapes, the anchor-based detectors also need other hyper-parameters to label each anchor box as a positive, ignored or negative sample. In previous works, they often employ intersection over union (IOU) between anchor boxes and ground-truth boxes to determine the label of an anchor box (e.g., a positive anchor if its IOU is in ). These hyper-parameters have shown a great impact on the final accuracy, and require heuristic tuning. Meanwhile, these hyper-parameters are specific to detection tasks, making detection tasks deviate from a neat fully convolutional network architectures used in other dense prediction tasks such as semantic segmentation.
不过,如上文所述,锚框会带来过多超参数,通常必须仔细调节才能取得好结果。除了描述锚框形状的那些超参数,锚框检测器还需要另外的超参数,用来把每个锚框标成正样本、忽略样本或负样本。以往工作常常用锚框与真值框的交并比(IoU)来决定标签(例如,IoU 落在 里就标成正锚框)。这些超参数对最终精度影响很大,需要靠启发式去调。同时,它们是检测任务特有的,也让检测偏离了语义分割等其他稠密预测任务里那种干净的全卷积网络结构。
Anchor-free Detectors.
The most popular anchor-free detector might be YOLOv1 [21]. Instead of using anchor boxes, YOLOv1 predicts bounding boxes at points near the center of objects. Only the points near the center are used since they are considered to be able to produce higher-quality detection. However, since only points near the center are used to predict bounding boxes, YOLOv1 suffers from low recall as mentioned in YOLOv2 [22]. As a result, YOLOv2 [22] employs anchor boxes as well. Compared to YOLOv1, FCOS takes advantages of all points in a ground truth bounding box to predict the bounding boxes and the low-quality detected bounding boxes are suppressed by the proposed “center-ness” branch. As a result, FCOS is able to provide comparable recall with anchor-based detectors as shown in our experiments.
无锚框检测器。
最广为人知的无锚框检测器大概是 YOLOv1 [21]。YOLOv1 不使用锚框,而是在靠近物体中心的点上预测边界框。只有靠近中心的点会被用到,因为人们认为这些点能给出更高质量的检测。可正因为只用中心附近的点来预测边界框,YOLOv1 的召回偏低,YOLOv2 [22] 也提到了这一点。于是 YOLOv2 [22] 仍然采用了锚框。和 YOLOv1 相比,FCOS 利用真值框内的所有点来预测边界框,再用所提出的“中心度”分支压住低质量检测框。因此,如实验所示,FCOS 能够提供与锚框检测器相当的召回。
CornerNet [13] is a recently proposed one-stage anchor-free detector, which detects a pair of corners of a bounding box and groups them to form the final detected bounding box. CornerNet requires much more complicated post-processing to group the pairs of corners belonging to the same instance. An extra distance metric is learned for the purpose of grouping.
CornerNet [13] 是当时新提出的单阶段无锚框检测器:它检测边界框的一对角点,再把它们组合起来形成最终检测框。CornerNet 需要更复杂的后处理,才能把属于同一实例的角点对组合在一起,并为此额外学习一种距离度量。
Another family of anchor-free detectors such as [32] are based on DenseBox [12]. The family of detectors have been considered unsuitable for generic object detection due to difficulty in handling overlapping bounding boxes and the recall being relatively low. In this work, we show that both problems can be largely alleviated with multi-level FPN prediction. Moreover, we also show together with our proposed center-ness branch, the much simpler detector can achieve even better detection performance than its anchor-based counterparts.
另一类无锚框检测器,例如 [32],建立在 DenseBox [12] 之上。由于难以处理重叠边界框,而且召回相对偏低,这类检测器一直被认为不适合通用目标检测。本文表明,借助多层 FPN 预测,这两个问题都可以在很大程度上得到缓解。我们还表明,再加上所提出的中心度分支,这种更简单的检测器甚至可以超过对应的锚框方法。
3 Our Approach
3 我们的方法
In this section, we first reformulate object detection in a per-pixel prediction fashion. Next, we show that how we make use of multi-level prediction to improve the recall and resolve the ambiguity resulted from overlapped bounding boxes. Finally, we present our proposed “center-ness” branch, which helps suppress the low-quality detected bounding boxes and improves the overall performance by a large margin.
本节先把目标检测重新表述成逐像素预测。接着说明我们如何用多层预测来提高召回,并化解重叠边界框带来的歧义。最后介绍所提出的“中心度”分支:它帮助压住低质量检测框,并大幅提高整体性能。
3.1 Fully Convolutional One-Stage Object Detector
3.1 全卷积单阶段目标检测器
Let be the feature maps at layer of a backbone CNN and be the total stride until the layer. The ground-truth bounding boxes for an input image are defined as , where . Here and denote the coordinates of the left-top and right-bottom corners of the bounding box. is the class that the object in the bounding box belongs to. is the number of classes, which is for MS-COCO dataset.
设 为骨干 CNN 第 层的特征图, 为到该层为止的总步幅。输入图像的真值边界框记为 ,其中 。这里 和 分别是边界框左上角和右下角的坐标。 是该框中物体所属的类别。 是类别数,在 MS-COCO 数据集上为 。
For each location on the feature map , we can map it back onto the input image as , which is near the center of the receptive field of the location . Different from anchor-based detectors, which consider the location on the input image as the center of (multiple) anchor boxes and regress the target bounding box with these anchor boxes as references, we directly regress the target bounding box at the location. In other words, our detector directly views locations as training samples instead of anchor boxes in anchor-based detectors, which is the same as FCNs for semantic segmentation [20].
对特征图 上的每个位置 ,我们可以把它映射回输入图像上的 ,该点靠近位置 感受野的中心。锚框检测器把输入图像上的这个位置看成(多个)锚框的中心,并以这些锚框为参考去回归目标框;我们则直接在该位置回归目标边界框。换句话说,我们的检测器直接把位置看成训练样本,而不像锚框检测器那样把锚框当成训练样本,这一点和用于语义分割的 FCN [20] 是一样的。
Specifically, location is considered as a positive sample if it falls into any ground-truth box and the class label of the location is the class label of the ground-truth box. Otherwise it is a negative sample and (background class). Besides the label for classification, we also have a 4D real vector being the regression targets for the location. Here , , and are the distances from the location to the four sides of the bounding box, as shown in Fig. 1 (left). If a location falls into multiple bounding boxes, it is considered as an ambiguous sample. We simply choose the bounding box with minimal area as its regression target. In the next section, we will show that with multi-level prediction, the number of ambiguous samples can be reduced significantly and thus they hardly affect the detection performance. Formally, if location is associated to a bounding box , the training regression targets for the location can be formulated as,
具体来说,如果位置 落进任何一个真值框,它就被当成正样本,该位置的类别标签 就是这个真值框的类别;否则它是负样本,且 (背景类)。除了分类标签,我们还有一个 4 维实向量 作为该位置的回归目标。这里 、、 和 是该位置到边界框四条边的距离,如图 1(左)所示。如果一个位置落进多个边界框,它就被看成歧义样本。我们简单地选择面积最小的那个边界框作为回归目标。下一节会表明,有了多层预测,歧义样本的数量会显著下降,因而几乎不会影响检测性能。形式上,如果位置 被关联到边界框 ,该位置的训练回归目标可以写成
It is worth noting that FCOS can leverage as many foreground samples as possible to train the regressor. It is different from anchor-based detectors, which only consider the anchor boxes with a highly enough IOU with ground-truth boxes as positive samples. We argue that it may be one of the reasons that FCOS outperforms its anchor-based counterparts.
值得注意的是,FCOS 可以尽可能多地利用前景样本来训练回归器。 这一点和锚框检测器不同:后者只把与真值框有足够高 IoU 的锚框当成正样本。我们认为,这可能是 FCOS 超过对应锚框方法的原因之一。
Network Outputs.
Corresponding to the training targets, the final layer of our networks predicts an 80D vector of classification labels and a 4D vector bounding box coordinates. Following [15], instead of training a multi-class classifier, we train binary classifiers. Similar to [15], we add four convolutional layers after the feature maps of the backbone networks respectively for classification and regression branches. Moreover, since the regression targets are always positive, we employ to map any real number to on the top of the regression branch. It is worth noting that FCOS has fewer network output variables than the popular anchor-based detectors [15, 24] with 9 anchor boxes per location.
Loss Function.
We define our training loss function as follows:
损失函数。
我们把训练损失函数定义如下:
where is focal loss as in [15] and is the IOU loss as in UnitBox [32]. denotes the number of positive samples and being in this paper is the balance weight for . The summation is calculated over all locations on the feature maps . is the indicator function, being if and otherwise.
其中 是 [15] 中的 focal loss, 是 UnitBox [32] 中的 IoU 损失。 表示正样本数量, 是 的平衡权重,本文取 。求和遍历特征图 上的所有位置。 是示性函数:当 时为 ,否则为 。
Inference.
The inference of FCOS is straightforward. Given an input images, we forward it through the network and obtain the classification scores and the regression prediction for each location on the feature maps . Following [15], we choose the location with as positive samples and invert Eq. (1) to obtain the predicted bounding boxes.
推理。
FCOS 的推理很直接。给定一张输入图像,我们把它送进网络,得到特征图 上每个位置的分类分数 和回归预测 。沿用 [15],我们把 的位置当成正样本,并反解式 (1) 得到预测的边界框。
3.2 Multi-level Prediction with FPN for FCOS
3.2 用 FPN 为 FCOS 做多层预测
Here we show that how two possible issues of the proposed FCOS can be resolved with multi-level prediction with FPN [14]. 1) The large stride (e.g., 16) of the final feature maps in a CNN can result in a relatively low best possible recall (BPR)[^1]. For anchor based detectors, low recall rates due to the large stride can be compensated to some extent by lowering the required IOU scores for positive anchor boxes. For FCOS, at the first glance one may think that the BPR can be much lower than anchor-based detectors because it is impossible to recall an object which no location on the final feature maps encodes due to a large stride. Here, we empirically show that even with a large stride, FCN-based FCOS is still able to produce a good BPR, and it can even better than the BPR of the anchor-based detector RetinaNet [15] in the official implementation Detectron [7] (refer to Table 1). Therefore, the BPR is actually not a problem of FCOS. Moreover, with multi-level FPN prediction [14], the BPR can be improved further to match the best BPR the anchor-based RetinaNet can achieve. 2) Overlaps in ground-truth boxes can cause intractable ambiguity , i.e., which bounding box should a location in the overlap regress? This ambiguity results in degraded performance of FCN-based detectors. In this work, we show that the ambiguity can be greatly resolved with multi-level prediction, and the FCN-based detector can obtain on par, sometimes even better, performance compared with anchor-based ones.
这里我们说明,如何借助 FPN [14] 的多层预测,化解 FCOS 可能遇到的两个问题。1)CNN 最终特征图较大的步幅(例如 16 倍)可能导致相对偏低的最好可能召回(BPR)[^1]。对锚框检测器来说,大步幅造成的低召回,可以在一定程度上通过降低正锚框所需的 IoU 阈值来补偿。对 FCOS 而言,乍一看会觉得它的 BPR 会比锚框检测器低得多:如果最终特征图上没有任何位置编码到某个物体,这个物体就不可能被召回。我们用实验表明,即便步幅较大,基于 FCN 的 FCOS 仍然能够给出很好的 BPR,甚至可以高于官方实现 Detectron [7] 里锚框检测器 RetinaNet [15] 的 BPR(见表 1)。因此,BPR 其实并不是 FCOS 的问题。再借助多层 FPN 预测 [14],BPR 还能进一步提高,达到锚框版 RetinaNet 所能取得的最好 BPR。2)真值框之间的重叠会造成很难处理的歧义,也就是:重叠处的某个位置应该回归哪一个边界框?这种歧义会降低基于 FCN 的检测器的性能。本文表明,借助多层预测,这种歧义可以在很大程度上被化解,基于 FCN 的检测器可以取得与锚框方法相当、有时甚至更好的性能。
Following FPN [14], we detect different sizes of objects on different levels of feature maps. Specifically, we make use of five levels of feature maps defined as . , and are produced by the backbone CNNs’ feature maps , and followed by a convolutional layer with the top-down connections in [14], as shown in Fig. 2. and are produced by applying one convolutional layer with the stride being 2 on and , respectively. As a result, the feature levels , , , and have strides 8, 16, 32, 64 and 128, respectively.
沿用 FPN [14],我们在不同层的特征图上检测不同尺寸的物体。具体来说,我们使用五层特征图 。如图 2 所示,、 和 由骨干 CNN 的特征图 、 和 接一层 卷积,再加上 [14] 中的自顶向下连接得到。 和 则分别在 和 上再做一层步幅为 2 的卷积。因此,、、、 和 的步幅分别是 8、16、32、64 和 128。
Unlike anchor-based detectors, which assign anchor boxes with different sizes to different feature levels, we directly limit the range of bounding box regression for each level. More specifically, we firstly compute the regression targets , , and for each location on all feature levels. Next, if a location satisfies or , , it is set as a negative sample and is thus not required to regress a bounding box anymore. Here is the maximum distance that feature level needs to regress. In this work, , , , , and are set as , , , , and , respectively. Since objects with different sizes are assigned to different feature levels and most overlapping happens between objects with considerably different sizes. If a location, even with multi-level prediction used, is still assigned to more than one ground-truth boxes, we simply choose the ground-truth box with minimal area as its target. As shown in our experiments, the multi-level prediction can largely alleviate the aforementioned ambiguity and improve the FCN-based detector to the same level of anchor-based ones.
锚框检测器把不同尺寸的锚框分配到不同特征层;我们则直接限制每一层边界框回归的范围。更具体地说,我们先在所有特征层的每个位置上计算回归目标 、、 和 。接着,如果某个位置满足 或 ,它就被设成负样本,因而不再需要回归边界框。这里 是特征层 需要回归的最大距离。本文中,、、、、 和 分别设为 、、、、 和 。由于不同尺寸的物体被分配到不同特征层,而大多数重叠发生在尺寸相差相当大的物体之间。即便使用了多层预测,如果一个位置仍然被分配到不止一个真值框,我们就简单地选择面积最小的真值框作为目标。如实验所示,多层预测能够在很大程度上缓解前述歧义,并把基于 FCN 的检测器提高到与锚框方法同一水平。
Finally, following [14, 15], we share the heads between different feature levels, not only making the detector parameter-efficient but also improving the detection performance. However, we observe that different feature levels are required to regress different size range (e.g., the size range is for and for ), and therefore it is not reasonable to make use of identical heads for different feature levels. As a result, instead of using the standard , we make use of with a trainable scalar to automatically adjust the base of the exponential function for feature level , which slightly improves the detection performance.
最后,沿用 [14, 15],我们在不同特征层之间共享检测头,这样既节省参数,也能提高检测性能。不过我们观察到,不同特征层需要回归的尺寸范围并不相同(例如 的范围是 , 是 ),因此让不同层使用完全相同的检测头并不合理。于是,我们不再使用标准的 ,而是使用 ,其中 是可学习的标量,用来自动调节特征层 上指数函数的底,这会略微提高检测性能。
3.3 Center-ness for FCOS
3.3 FCOS 的中心度
After using multi-level prediction in FCOS, there is still a performance gap between FCOS and anchor-based detectors. We observed that it is due to a lot of low-quality predicted bounding boxes produced by locations far away from the center of an object.
在 FCOS 中使用多层预测之后,它和锚框检测器之间仍有性能差距。我们观察到,原因在于远离物体中心的位置会产生大量低质量的预测边界框。
We propose a simple yet effective strategy to suppress these low-quality detected bounding boxes without introducing any hyper-parameters. Specifically, we add a single-layer branch, in parallel with the classification branch (as shown in Fig. 2) to predict the ‘‘center-ness” of a location[^2]. The center-ness depicts the normalized distance from the location to the center of the object that the location is responsible for, as shown Fig. 7. Given the regression targets , , and for a location, the center-ness target is defined as,
我们提出一种简单却有效的策略,用来压住这些低质量检测框,并且不引入任何超参数。具体来说,我们与分类支路并行地增加一条单层分支(如图 2 所示),用来预测某个位置的“中心度”[^2]。中心度刻画的是该位置到它所负责的物体中心的归一化距离,如图 7 所示。给定某个位置的回归目标 、、 和 ,中心度目标定义为
We employ here to slow down the decay of the center-ness. The center-ness ranges from to and is thus trained with binary cross entropy (BCE) loss. The loss is added to the loss function Eq. (3.1). When testing, the final score (used for ranking the detected bounding boxes) is computed by multiplying the predicted center-ness with the corresponding classification score. Thus the center-ness can down-weight the scores of bounding boxes far from the center of an object. As a result, with high probability, these low-quality bounding boxes might be filtered out by the final non-maximum suppression (NMS) process, improving the detection performance remarkably.
我们在这里使用平方根,是为了让中心度衰减得慢一些。中心度的取值范围是 到 ,因此用二元交叉熵(BCE)损失来训练。这项损失被加到式 (3.1) 的损失函数中。测试时,用于给检测框排序的最终分数,由预测的中心度乘以相应的分类分数得到。这样,中心度就能降低那些远离物体中心的边界框的分数。于是这些低质量边界框很有可能在最后的非极大值抑制(NMS)过程中被滤掉,从而显著提高检测性能。
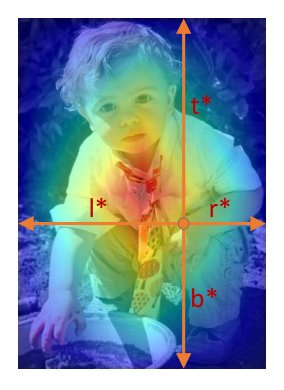
Figure 3: Center-ness. Red, blue, and other colors denote 1, 0 and the values between them, respectively. Center-ness is computed by Eq. (3) and decays from 1 to 0 as the location deviates from the center of the object. When testing, the center-ness predicted by the network is multiplied with the classification score thus can down-weight the low-quality bounding boxes predicted by a location far from the center of an object.
图 3:中心度。 红色、蓝色和其他颜色分别表示 1、0 以及介于两者之间的取值。中心度由式 (3) 计算,并随着位置偏离物体中心,从 1 衰减到 0。测试时,网络预测的中心度会与分类分数相乘,从而降低由远离物体中心的位置预测出的低质量边界框的权重。
An alternative of the center-ness is to make use of only the central portion of ground-truth bounding box as positive samples with the price of one extra hyper-parameter, as shown in works [12, 33]. After our submission, it has been shown in [1] that the combination of both methods can achieve a much better performance. The experimental results can be found in Table 3.
中心度的一种替代做法,是只把真值边界框的中心部分当成正样本,代价是多引入一个超参数,如 [12, 33] 所示。在我们投稿之后,[1] 表明把两种方法结合起来可以取得好得多的性能。实验结果见表 3。
4 Experiments
4 实验
Our experiments are conducted on the large-scale detection benchmark COCO [16]. Following the common practice [15, 14, 24], we use the COCO split (115K images) for training and split (5K images) as validation for our ablation study. We report our main results on the split (20K images) by uploading our detection results to the evaluation server.
我们的实验在大规模检测基准 COCO [16] 上进行。沿用常见做法 [15, 14, 24],消融实验使用 COCO 划分(11.5 万张图像)训练,并用 划分(5 千张图像)做验证。主要结果在 划分(2 万张图像)上报告,做法是把检测结果上传到评测服务器。
Training Details.
Unless specified, ResNet-50 [8] is used as our backbone networks and the same hyper-parameters with RetinaNet [15] are used. Specifically, our network is trained with stochastic gradient descent (SGD) for 90K iterations with the initial learning rate being 0.01 and a mini-batch of 16 images. The learning rate is reduced by a factor of 10 at iteration 60K and 80K, respectively. Weight decay and momentum are set as 0.0001 and 0.9, respectively. We initialize our backbone networks with the weights pre-trained on ImageNet [4]. For the newly added layers, we initialize them as in [15]. Unless specified, the input images are resized to have their shorter side being 800 and their longer side less or equal to 1333.
训练细节。
除非另有说明,我们使用 ResNet-50 [8] 作为骨干网络,并采用与 RetinaNet [15] 相同的超参数。具体来说,网络用随机梯度下降(SGD)训练 9 万次迭代,初始学习率为 0.01,每个小批次 16 张图像。学习率分别在第 6 万次和第 8 万次迭代时降低 10 倍。权重衰减和动量分别设为 0.0001 和 0.9。骨干网络用在 ImageNet [4] 上预训练的权重初始化。新增加的层按 [15] 来初始化。除非另有说明,输入图像被缩放到短边为 800、长边不超过 1333。
Inference Details.
We firstly forward the input image through the network and obtain the predicted bounding boxes with a predicted class. Unless specified, the following post-processing is exactly the same with RetinaNet [15] and we directly make use of the same post-processing hyper-parameters of RetinaNet. We use the same sizes of input images as in training. We hypothesize that the performance of our detector may be improved further if we carefully tune the hyper-parameters.
推理细节。
我们首先把输入图像送进网络,得到带预测类别的边界框。除非另有说明,后续后处理与 RetinaNet [15] 完全相同,我们也直接使用 RetinaNet 的后处理超参数。输入图像尺寸与训练时相同。我们猜想,如果仔细调节这些超参数,检测器的性能还可以进一步提高。
4.1 Ablation Study
4.1 消融实验
4.1.1 Multi-level Prediction with FPN
| Method | w/ FPN | Low-quality matches | BPR (%) |
|---|---|---|---|
| RetinaNet | ✓ | None | 86.82 |
| RetinaNet | ✓ | 90.92 | |
| RetinaNet | ✓ | All | 99.23 |
| FCOS | - | 95.55 | |
| FCOS | ✓ | - | 98.40 |
Table 1: The BPR for anchor-based RetinaNet under a variety of matching rules and the BPR for FCN-based FCOS. FCN-based FCOS has very similar recall to the best anchor-based one and has much higher recall than the official implementation in Detectron [7], where only low-quality matches with IOU are considered.
4.1.1 用 FPN 做多层预测
| 方法 | 使用 FPN | 低质量匹配 | BPR (%) |
|---|---|---|---|
| RetinaNet | ✓ | 无 | 86.82 |
| RetinaNet | ✓ | 90.92 | |
| RetinaNet | ✓ | 全部 | 99.23 |
| FCOS | - | 95.55 | |
| FCOS | ✓ | - | 98.40 |
表 1:锚框版 RetinaNet 在多种匹配规则下的 BPR,以及基于 FCN 的 FCOS 的 BPR。基于 FCN 的 FCOS 的召回与最好的锚框方法非常接近,并且远高于 Detectron [7] 官方实现中的召回——那里只考虑 IoU 的低质量匹配。
| w/ FPN | Amb. samples (%) | Amb. samples (diff.) (%) |
|---|---|---|
| 23.16 | 17.84 | |
| ✓ | 7.14 | 3.75 |
Table 2: Amb. samples denotes the ratio of the ambiguous samples to all positive samples. Amb. samples (diff.) is similar but excludes those ambiguous samples in the overlapped regions but belonging to the same category as the kind of ambiguity does not matter when inferring. We can see that with FPN, this percentage of ambiguous samples is small (3.75%).
| 使用 FPN | 歧义样本 (%) | 歧义样本(不同类)(%) |
|---|---|---|
| 23.16 | 17.84 | |
| ✓ | 7.14 | 3.75 |
表 2:Amb. samples 表示歧义样本占全部正样本的比例。Amb. samples (diff.) 类似,但排除了重叠区域里属于同一类别的歧义样本,因为这种歧义在推理时并不要紧。可以看到,使用 FPN 之后,歧义样本的比例已经很小(3.75%)。
| Method | / | w/ GN | nms thr. | AP | AP50 | AP75 | APS | APM | APL | AR1 | AR10 | AR100 |
|---|---|---|---|---|---|---|---|---|---|---|---|---|
| RetinaNet | .50 | 35.9 | 56.0 | 38.2 | 20.0 | 39.8 | 47.4 | 31.0 | 49.4 | 52.5 | ||
| FCOS | .50 | 36.3 | 54.8 | 38.7 | 20.5 | 39.8 | 47.8 | 31.5 | 50.6 | 53.5 | ||
| FCOS | .50 | 36.4 | 54.9 | 38.8 | 19.7 | 39.7 | 48.8 | 31.4 | 50.6 | 53.4 | ||
| FCOS | .60 | 36.5 | 54.5 | 39.2 | 19.8 | 40.0 | 48.9 | 31.3 | 51.2 | 54.5 | ||
| FCOS | ✓ | .60 | 37.1 | 55.9 | 39.8 | 21.3 | 41.0 | 47.8 | 31.4 | 51.4 | 54.9 | |
| Improvements | ||||||||||||
| + ctr. on reg. | ✓ | .60 | 37.4 | 56.1 | 40.3 | 21.8 | 41.2 | 48.8 | 31.5 | 51.7 | 55.2 | |
| + ctr. sampling [1] | ✓ | .60 | 38.1 | 56.7 | 41.4 | 22.6 | 41.6 | 50.4 | 32.1 | 52.8 | 56.3 | |
| + GIoU [1] | ✓ | .60 | 38.3 | 57.1 | 41.0 | 21.9 | 42.4 | 49.5 | 32.0 | 52.9 | 56.5 | |
| + Normalization | ✓ | .60 | 38.6 | 57.4 | 41.4 | 22.3 | 42.5 | 49.8 | 32.3 | 53.4 | 57.1 |
Table 3: FCOS vs. RetinaNet on the split with ResNet-50-FPN as the backbone. Directly using the training and testing settings of RetinaNet, our anchor-free FCOS achieves even better performance than anchor-based RetinaNet both in AP and AR. With Group Normalization (GN) in heads and NMS threshold being 0.6, FCOS can achieve in AP. After our submission, some almost cost-free improvements have been made for FCOS and the performance has been improved by a large margin, as shown by the rows below “Improvements”. “ctr. on reg.”: moving the center-ness branch to the regression branch. “ctr. sampling”: only sampling the central portion of ground-truth boxes as positive samples. “GIoU”: penalizing the union area over the circumscribed rectangle’s area in IoU Loss. “Normalization”: normalizing the regression targets in Eq. (1) with the strides of FPN levels. Refer to our code for details.
| 方法 | / | 使用 GN | nms 阈值 | AP | AP50 | AP75 | APS | APM | APL | AR1 | AR10 | AR100 |
|---|---|---|---|---|---|---|---|---|---|---|---|---|
| RetinaNet | .50 | 35.9 | 56.0 | 38.2 | 20.0 | 39.8 | 47.4 | 31.0 | 49.4 | 52.5 | ||
| FCOS | .50 | 36.3 | 54.8 | 38.7 | 20.5 | 39.8 | 47.8 | 31.5 | 50.6 | 53.5 | ||
| FCOS | .50 | 36.4 | 54.9 | 38.8 | 19.7 | 39.7 | 48.8 | 31.4 | 50.6 | 53.4 | ||
| FCOS | .60 | 36.5 | 54.5 | 39.2 | 19.8 | 40.0 | 48.9 | 31.3 | 51.2 | 54.5 | ||
| FCOS | ✓ | .60 | 37.1 | 55.9 | 39.8 | 21.3 | 41.0 | 47.8 | 31.4 | 51.4 | 54.9 | |
| 改进 | ||||||||||||
| + 中心度放到回归支路 | ✓ | .60 | 37.4 | 56.1 | 40.3 | 21.8 | 41.2 | 48.8 | 31.5 | 51.7 | 55.2 | |
| + 中心采样 [1] | ✓ | .60 | 38.1 | 56.7 | 41.4 | 22.6 | 41.6 | 50.4 | 32.1 | 52.8 | 56.3 | |
| + GIoU [1] | ✓ | .60 | 38.3 | 57.1 | 41.0 | 21.9 | 42.4 | 49.5 | 32.0 | 52.9 | 56.5 | |
| + 归一化 | ✓ | .60 | 38.6 | 57.4 | 41.4 | 22.3 | 42.5 | 49.8 | 32.3 | 53.4 | 57.1 |
表 3:在 划分上,以 ResNet-50-FPN 为骨干,比较 FCOS 与 RetinaNet。直接采用 RetinaNet 的训练和测试设定,我们的无锚框 FCOS 在 AP 和 AR 上都超过了锚框版 RetinaNet。检测头使用组归一化(GN),并把 NMS 阈值设为 0.6 时,FCOS 可以达到 AP。在我们投稿之后,FCOS 又加入了一些几乎不增加代价的改进,性能进一步提高,见“改进”下方各行。“中心度放到回归支路”:把中心度分支移到回归支路。“中心采样”:只把真值框的中心部分采样为正样本。“GIoU”:在 IoU 损失中额外惩罚并集面积相对外接矩形面积的关系。“归一化”:用各 FPN 层的步幅对式 (1) 中的回归目标做归一化。细节见我们的代码。
As mentioned before, the major concerns of an FCN-based detector are low recall rates and ambiguous samples resulted from overlapping in ground-truth bounding boxes. In the section, we show that both issues can be largely resolved with multi-level prediction.
如前所述,基于 FCN 的检测器主要令人担心的是召回偏低,以及真值边界框重叠带来的歧义样本。本节表明,这两个问题都可以借助多层预测在很大程度上得到化解。
Best Possible Recalls.
The first concern about the FCN-based detector is that it might not provide a good best possible recall (BPR). In the section, we show that the concern is not necessary. Here BPR is defined as the ratio of the number of ground-truth boxes a detector can recall at the most divided by all ground-truth boxes. A ground-truth box is considered being recalled if the box is assigned to at least one sample (i.e., a location in FCOS or an anchor box in anchor-based detectors) during training. As shown in Table 1, only with feature level with stride being 16 (i.e., no FPN), FCOS can already obtain a BPR of . The BPR is much higher than the BPR of of the anchor-based detector RetinaNet in the official implementation Detectron, where only the low-quality matches with IOU are used. With the help of FPN, FCOS can achieve a BPR of , which is very close to the best BPR that the anchor-based detector can achieve by using all low-quality matches. Due to the fact that the best recall of current detectors are much lower than , the small BPR gap (less than ) between FCOS and the anchor-based detector will not actually affect the performance of detector. It is also confirmed in Table 3, where FCOS achieves even better AR than its anchor-based counterparts under the same training and testing settings. Therefore, the concern about low BPR may not be necessary.
最好可能召回。
对基于 FCN 的检测器的第一个担心,是它可能无法提供很好的最好可能召回(BPR)。本节表明,这种担心并不必要。这里的 BPR 定义为:检测器最多能够召回的真值框数量,除以全部真值框数量。如果一个真值框在训练时被分配到至少一个样本(也就是 FCOS 中的一个位置,或锚框检测器中的一个锚框),就认为它被召回了。如表 1 所示,即便只用步幅为 16 的特征层 (也就是不用 FPN),FCOS 已经可以取得 的 BPR。这个数字远高于官方实现 Detectron 里锚框检测器 RetinaNet 的 BPR——那里只使用 IoU 的低质量匹配。借助 FPN,FCOS 可以达到 的 BPR,已经非常接近锚框检测器在使用全部低质量匹配时所能取得的最好 BPR。由于当前检测器的最好召回远低于 ,FCOS 与锚框检测器之间不到 的 BPR 差距,实际上并不会影响检测器的性能。表 3 也印证了这一点:在完全相同的训练和测试设定下,FCOS 的 AR 甚至高于对应的锚框方法。因此,关于 BPR 偏低的担心可能并不必要。
Ambiguous Samples.
Another concern about the FCN-based detector is that it may have a large number of ambiguous samples due to the overlapping in ground-truth bounding boxes, as shown in Fig. 1 (right). In Table 2, we show the ratios of the ambiguous samples to all positive samples on split. As shown in the table, there are indeed a large amount of ambiguous samples () if FPN is not used and only feature level is used. However, with FPN, the ratio can be significantly reduced to only since most of overlapped objects are assigned to different feature levels. Moreover, we argue that the ambiguous samples resulted from overlapping between objects of the same category do not matter. For instance, if object A and B with the same class have overlap, no matter which object the locations in the overlap predict, the prediction is correct because it is always matched with the same category. The missed object can be predicted by the locations only belonging to it. Therefore, we only count the ambiguous samples in overlap between bounding boxes with different categories. As shown in Table 2, the multi-level prediction reduces the ratio of ambiguous samples from to . In order to further show that the overlapping in ground truth boxes is not a problem of our FCN-based FCOS, we count that when inferring how many detected bounding boxes come from the ambiguous locations. We found that only detected bounding boxes are produced by the ambiguous locations. By further only considering the overlap between different categories, the ratio is reduced to . Note that it does not imply that there are locations where FCOS cannot work. As mentioned before, these locations are associated with the ground-truth boxes with minimal area. Therefore, these locations only take the risk of missing some larger objects. As shown in the following experiments, they do not make our FCOS inferior to anchor-based detectors.
歧义样本。
对基于 FCN 的检测器的另一个担心,是真值边界框重叠可能导致大量歧义样本,如图 1(右)所示。表 2 给出了 划分上歧义样本占全部正样本的比例。如表所示,如果不使用 FPN、只使用特征层 ,歧义样本确实很多()。不过使用 FPN 之后,由于大多数重叠物体被分配到不同特征层,这一比例可以显著降到只有 。我们还认为,由同一类别物体重叠造成的歧义样本并不要紧。例如,如果同类物体 A 和 B 有重叠,重叠处的位置不论预测成哪一个物体,预测都是正确的,因为它始终对应同一类别。被漏掉的那个物体,可以由只属于它的那些位置来预测。因此,我们只统计不同类别边界框重叠处的歧义样本。如表 2 所示,多层预测把歧义样本比例从 降到 。为了进一步说明真值框重叠并不是基于 FCN 的 FCOS 的问题,我们统计推理时有多少检测框来自这些歧义位置。结果发现,只有 的检测框由歧义位置产生。如果再只考虑不同类别之间的重叠,这一比例降到 。注意,这并不意味着有 的位置是 FCOS 无法处理的。如前所述,这些位置被关联到面积最小的真值框。因此,这些位置只是有漏掉某些更大物体的风险。如下面实验所示,它们并没有让 FCOS 弱于锚框检测器。
4.1.2 With or Without Center-ness
As mentioned before, we propose “center-ness” to suppress the low-quality detected bounding boxes produced by the locations far from the center of an object. As shown in Table 4, the center-ness branch can boost AP from to , making anchor-free FCOS outperform anchor-based RetinaNet (). Note that anchor-based RetinaNet employs two IoU thresholds to label anchor boxes as positive/negative samples, which can also help to suppress the low-quality predictions. The proposed center-ness can eliminate the two hyper-parameters. However, after our initial submission, it has shown that using both center-ness and the thresholds can result in a better performance, as shown by the row “+ ctr. sampling” in Table 3. One may note that center-ness can also be computed with the predicted regression vector without introducing the extra center-ness branch. However, as shown in Table 4, the center-ness computed from the regression vector cannot improve the performance and thus the separate center-ness is necessary.
4.1.2 有没有中心度
如前所述,我们提出“中心度”来压住由远离物体中心的位置产生的低质量检测框。如表 4 所示,中心度分支可以把 AP 从 提升到 ,让无锚框的 FCOS 超过锚框版 RetinaNet()。注意,锚框版 RetinaNet 使用两个 IoU 阈值来把锚框标成正/负样本,这同样有助于压住低质量预测。所提出的中心度可以去掉这两个超参数。不过,在我们初次投稿之后已经表明,同时使用中心度和这些阈值可以取得更好的性能,见表 3 中“+ 中心采样”一行。也有人会注意到,中心度也可以由预测的回归向量直接算出来,而不必额外增加中心度分支。可是如表 4 所示,由回归向量算出的中心度并不能提高性能,因此独立的中心度分支是需要的。
4.1.3 FCOS vs. Anchor-based Detectors
| AP | AP50 | AP75 | APS | APM | APL | |
|---|---|---|---|---|---|---|
| None | 33.5 | 52.6 | 35.2 | 20.8 | 38.5 | 42.6 |
| center-ness*†* | 33.5 | 52.4 | 35.1 | 20.8 | 37.8 | 42.8 |
| center-ness | 37.1 | 55.9 | 39.8 | 21.3 | 41.0 | 47.8 |
Table 4: Ablation study for the proposed center-ness branch on split. “None” denotes that no center-ness is used. “center-ness*†*” denotes that using the center-ness computed from the predicted regression vector. “center-ness” is that using center-ness predicted from the proposed center-ness branch. The center-ness branch improves the detection performance under all metrics.
4.1.3 FCOS 与锚框检测器的比较
| AP | AP50 | AP75 | APS | APM | APL | |
|---|---|---|---|---|---|---|
| 无 | 33.5 | 52.6 | 35.2 | 20.8 | 38.5 | 42.6 |
| 中心度*†* | 33.5 | 52.4 | 35.1 | 20.8 | 37.8 | 42.8 |
| 中心度 | 37.1 | 55.9 | 39.8 | 21.3 | 41.0 | 47.8 |
表 4:所提出的中心度分支在 划分上的消融。“无”表示不使用中心度。“中心度*†*”表示使用由预测回归向量算出的中心度。“中心度”表示使用所提出的中心度分支预测出的中心度。中心度分支在所有指标上都提高了检测性能。
| Method | Backbone | AP | AP50 | AP75 | APS | APM | APL |
|---|---|---|---|---|---|---|---|
| Two-stage methods: | |||||||
| Faster R-CNN w/ FPN [14] | ResNet-101-FPN | 36.2 | 59.1 | 39.0 | 18.2 | 39.0 | 48.2 |
| Faster R-CNN by G-RMI [11] | Inception-ResNet-v2 [27] | 34.7 | 55.5 | 36.7 | 13.5 | 38.1 | 52.0 |
| Faster R-CNN w/ TDM [25] | Inception-ResNet-v2-TDM | 36.8 | 57.7 | 39.2 | 16.2 | 39.8 | 52.1 |
| One-stage methods: | |||||||
| YOLOv2 [22] | DarkNet-19 [22] | 21.6 | 44.0 | 19.2 | 5.0 | 22.4 | 35.5 |
| SSD513 [18] | ResNet-101-SSD | 31.2 | 50.4 | 33.3 | 10.2 | 34.5 | 49.8 |
| DSSD513 [5] | ResNet-101-DSSD | 33.2 | 53.3 | 35.2 | 13.0 | 35.4 | 51.1 |
| RetinaNet [15] | ResNet-101-FPN | 39.1 | 59.1 | 42.3 | 21.8 | 42.7 | 50.2 |
| CornerNet [13] | Hourglass-104 | 40.5 | 56.5 | 43.1 | 19.4 | 42.7 | 53.9 |
| FSAF [34] | ResNeXt-64x4d-101-FPN | 42.9 | 63.8 | 46.3 | 26.6 | 46.2 | 52.7 |
| FCOS | ResNet-101-FPN | 41.5 | 60.7 | 45.0 | 24.4 | 44.8 | 51.6 |
| FCOS | HRNet-W32-5l [26] | 42.0 | 60.4 | 45.3 | 25.4 | 45.0 | 51.0 |
| FCOS | ResNeXt-32x8d-101-FPN | 42.7 | 62.2 | 46.1 | 26.0 | 45.6 | 52.6 |
| FCOS | ResNeXt-64x4d-101-FPN | 43.2 | 62.8 | 46.6 | 26.5 | 46.2 | 53.3 |
| FCOS w/ improvements | ResNeXt-64x4d-101-FPN | 44.7 | 64.1 | 48.4 | 27.6 | 47.5 | 55.6 |
Table 5: FCOS vs. other state-of-the-art two-stage or one-stage detectors (single-model and single-scale results). FCOS outperforms the anchor-based counterpart RetinaNet by in AP with the same backbone. FCOS also outperforms the recent anchor-free one-stage detector CornerNet with much less design complexity. Refer to Table 3 for details of “improvements”.
| 方法 | 骨干网络 | AP | AP50 | AP75 | APS | APM | APL |
|---|---|---|---|---|---|---|---|
| 两阶段方法: | |||||||
| Faster R-CNN w/ FPN [14] | ResNet-101-FPN | 36.2 | 59.1 | 39.0 | 18.2 | 39.0 | 48.2 |
| Faster R-CNN by G-RMI [11] | Inception-ResNet-v2 [27] | 34.7 | 55.5 | 36.7 | 13.5 | 38.1 | 52.0 |
| Faster R-CNN w/ TDM [25] | Inception-ResNet-v2-TDM | 36.8 | 57.7 | 39.2 | 16.2 | 39.8 | 52.1 |
| 单阶段方法: | |||||||
| YOLOv2 [22] | DarkNet-19 [22] | 21.6 | 44.0 | 19.2 | 5.0 | 22.4 | 35.5 |
| SSD513 [18] | ResNet-101-SSD | 31.2 | 50.4 | 33.3 | 10.2 | 34.5 | 49.8 |
| DSSD513 [5] | ResNet-101-DSSD | 33.2 | 53.3 | 35.2 | 13.0 | 35.4 | 51.1 |
| RetinaNet [15] | ResNet-101-FPN | 39.1 | 59.1 | 42.3 | 21.8 | 42.7 | 50.2 |
| CornerNet [13] | Hourglass-104 | 40.5 | 56.5 | 43.1 | 19.4 | 42.7 | 53.9 |
| FSAF [34] | ResNeXt-64x4d-101-FPN | 42.9 | 63.8 | 46.3 | 26.6 | 46.2 | 52.7 |
| FCOS | ResNet-101-FPN | 41.5 | 60.7 | 45.0 | 24.4 | 44.8 | 51.6 |
| FCOS | HRNet-W32-5l [26] | 42.0 | 60.4 | 45.3 | 25.4 | 45.0 | 51.0 |
| FCOS | ResNeXt-32x8d-101-FPN | 42.7 | 62.2 | 46.1 | 26.0 | 45.6 | 52.6 |
| FCOS | ResNeXt-64x4d-101-FPN | 43.2 | 62.8 | 46.6 | 26.5 | 46.2 | 53.3 |
| FCOS(含改进) | ResNeXt-64x4d-101-FPN | 44.7 | 64.1 | 48.4 | 27.6 | 47.5 | 55.6 |
表 5:FCOS 与其他当时最好的两阶段或单阶段检测器的比较(单模型、单尺度结果)。在相同骨干下,FCOS 比对应的锚框方法 RetinaNet 高 AP。FCOS 也超过了当时较新的无锚框单阶段检测器 CornerNet,同时设计复杂度低得多。“改进”的细节见表 3。
| Method | # samples | AR100 | AR1k |
|---|---|---|---|
| RPN w/ FPN & GN (ReImpl.) | 200K | 44.7 | 56.9 |
| FCOS w/ GN w/o center-ness | 66K | 48.0 | 59.3 |
| FCOS w/ GN | 66K | 52.8 | 60.3 |
Table 6: FCOS as Region Proposal Networks vs. RPNs with FPN. ResNet-50 is used as the backbone. FCOS improves AR100 and AR1k by and , respectively. GN: Group Normalization.
| 方法 | 样本数 | AR100 | AR1k |
|---|---|---|---|
| RPN w/ FPN & GN(复现) | 200K | 44.7 | 56.9 |
| FCOS w/ GN,无中心度 | 66K | 48.0 | 59.3 |
| FCOS w/ GN | 66K | 52.8 | 60.3 |
表 6:把 FCOS 当作区域提议网络,与带 FPN 的 RPN 比较。骨干网络为 ResNet-50。FCOS 分别把 AR100 和 AR1k 提高了 和 。GN:组归一化。
The aforementioned FCOS has two minor differences from the standard RetinaNet. 1) We use Group Normalization (GN) [29] in the newly added convolutional layers except for the last prediction layers, which makes our training more stable. 2) We use to produce the and instead of in the standard RetinaNet. We observe that using can improve the performance slightly.
上述 FCOS 和标准 RetinaNet 有两处较小的不同。1)我们在新增加的卷积层(最后的预测层除外)中使用组归一化(GN)[29],这让训练更稳定。2)我们用 来生成 和 ,而标准 RetinaNet 使用的是 。我们观察到,使用 可以略微提高性能。
To show that our FCOS can serve as an simple and strong alternative of anchor-based detectors, and for a fair comparison, we remove GN (the gradients are clipped to prevent them from exploding) and use in our detector. As shown in Table 3, with exactly the same settings, our FCOS still compares favorably with the anchor-based detector ( vs ). Moreover, it is worth to note that we directly use all hyper-parameters (e.g., learning rate, the NMS threshold and etc.) from RetinaNet, which have been optimized for the anchor-based detector. We argue that the performance of FCOS can be improved further if the hyper-parameters are tuned for it.
为了表明 FCOS 可以成为锚框检测器的一种简单而有力的替代,同时也为了公平比较,我们去掉 GN(并对梯度做裁剪以防止爆炸),并在检测器中使用 。如表 3 所示,在完全相同的设定下,我们的 FCOS 仍然优于锚框检测器( 对 )。此外值得注意的是,我们直接沿用了 RetinaNet 的全部超参数(例如学习率、NMS 阈值等),而这些超参数本来是为锚框检测器优化的。我们认为,如果为 FCOS 单独调节超参数,它的性能还可以进一步提高。
It is worth noting that with some almost cost-free improvements, as shown in Table 3, the performance of our anchor-free detector can be improved by a large margin. Given the superior performance and the merits of the anchor-free detector (e.g., much simpler and fewer hyper-parameters than anchor-based detectors), we encourage the community to rethink the necessity of anchor boxes in object detection.
还值得注意的是,如表 3 所示,加上一些几乎不增加代价的改进之后,这种无锚框检测器的性能还可以大幅提高。鉴于无锚框检测器更好的性能,以及它的优点(例如比锚框检测器简单得多、超参数也更少),我们希望社区重新思考目标检测里锚框是否仍有必要。
4.2 Comparison with State-of-the-art Detectors
4.2 与当时最好检测器的比较
We compare FCOS with other state-of-the-art object detectors on split of MS-COCO benchmark. For these experiments, we randomly scale the shorter side of images in the range from 640 to 800 during the training and double the number of iterations to 180K (with the learning rate change points scaled proportionally). Other settings are exactly the same as the model with AP in Table 3. As shown in Table 5, with ResNet-101-FPN, our FCOS outperforms the RetinaNet with the same backbone ResNet-101-FPN by in AP. To our knowledge, it is the first time that an anchor-free detector, without any bells and whistles outperforms anchor-based detectors by a large margin. FCOS also outperforms other classical two-stage anchor-based detectors such as Faster R-CNN by a large margin. With ResNeXt-64x4d-101-FPN [30] as the backbone, FCOS achieves in AP. It outperforms the recent state-of-the-art anchor-free detector CornerNet [13] by a large margin while being much simpler. Note that CornerNet requires to group corners with embedding vectors, which needs special design for the detector. Thus, we argue that FCOS is more likely to serve as a strong and simple alternative to current mainstream anchor-based detectors. Moreover, FCOS with the improvements in Table 3 achieves in AP with single-model and single scale testing, which surpasses previous detectors by a large margin.
我们在 MS-COCO 基准的 划分上,把 FCOS 与其他当时最好的目标检测器进行比较。这些实验中,训练时我们把图像短边随机缩放到 640 到 800 之间,并把迭代次数加倍到 18 万次(学习率改变的迭代点按比例缩放)。其他设定与表 3 中 AP 为 的模型完全相同。如表 5 所示,使用 ResNet-101-FPN 时,我们的 FCOS 比使用同一骨干 ResNet-101-FPN 的 RetinaNet 高 AP。据我们所知,这是无锚框检测器第一次在不加花哨模块的情况下,以较大幅度超过锚框检测器。FCOS 也以较大幅度超过了 Faster R-CNN 等经典的两阶段锚框检测器。以 ResNeXt-64x4d-101-FPN [30] 为骨干时,FCOS 达到 AP。它以较大幅度超过了当时最新的无锚框单阶段检测器 CornerNet [13],同时简单得多。注意,CornerNet 需要用嵌入向量来组合角点,这要求为检测器做专门设计。因此我们认为,FCOS 更有可能成为当时主流锚框检测器的一种简单而有力的替代。此外,叠上表 3 中的改进后,FCOS 在单模型、单尺度测试下达到 AP,明显超过以往的检测器。
5 Extensions on Region Proposal Networks
5 在区域提议网络上的扩展
So far we have shown that in a one-stage detector, our FCOS can achieve even better performance than anchor-based counterparts. Intuitively, FCOS should be also able to replace the anchor boxes in Region Proposal Networks (RPNs) with FPN [14] in the two-stage detector Faster R-CNN. Here, we confirm that by experiments.
到目前为止我们已经表明,在单阶段检测器里,FCOS 可以取得比对应锚框方法更好的性能。直观上,FCOS 也应该能够替换两阶段检测器 Faster R-CNN 中带 FPN 的区域提议网络(RPN)[14] 里的锚框。这里我们用实验来确认这一点。
Compared to RPNs with FPN [14], we replace anchor boxes with the method in FCOS. Moreover, we add GN into the layers in FPN heads, which can make our training more stable. All other settings are exactly the same with RPNs with FPN in the official code [7]. As shown in Table 6, even without the proposed center-ness branch, our FCOS already improves both AR100 and AR1k significantly. With the proposed center-ness branch, FCOS further boosts AR100 and AR1k respectively to and , which are relative improvement for AR100 and absolute improvement for AR1k over the RPNs with FPN.
与带 FPN 的 RPN [14] 相比,我们用 FCOS 中的方法替换锚框。此外,我们在 FPN 检测头的各层中加入 GN,这能让训练更稳定。其他设定与官方代码 [7] 中带 FPN 的 RPN 完全相同。如表 6 所示,即便不使用所提出的中心度分支,我们的 FCOS 已经显著提高了 AR100 和 AR1k。加上中心度分支后,FCOS 进一步把 AR100 和 AR1k 分别提升到 和 ,相对带 FPN 的 RPN,这分别是 AR100 的 相对提升,以及 AR1k 的 绝对提升。
6 Conclusion
6 结论
We have proposed an anchor-free and proposal-free one-stage detector FCOS. As shown in experiments, FCOS compares favourably against the popular anchor-based one-stage detectors, including RetinaNet, YOLO and SSD, but with much less design complexity. FCOS completely avoids all computation and hyper-parameters related to anchor boxes and solves the object detection in a per-pixel prediction fashion, similar to other dense prediction tasks such as semantic segmentation. FCOS also achieves state-of-the-art performance among one-stage detectors. We also show that FCOS can be used as RPNs in the two-stage detector Faster R-CNN and outperforms the its RPNs by a large margin. Given its effectiveness and efficiency, we hope that FCOS can serve as a strong and simple alternative of current mainstream anchor-based detectors. We also believe that FCOS can be extended to solve many other instance-level recognition tasks.
我们提出了一种无锚框、无候选区域的单阶段检测器 FCOS。如实验所示,FCOS 优于包括 RetinaNet、YOLO 和 SSD 在内的流行单阶段锚框检测器,同时设计复杂度低得多。FCOS 完全避免了所有与锚框相关的计算和超参数,并以逐像素预测的方式解决目标检测,这和语义分割等其他稠密预测任务类似。FCOS 也在单阶段检测器中取得了当时最好的性能。我们还表明,FCOS 可以在两阶段检测器 Faster R-CNN 中当作 RPN 来用,并大幅超过原来的 RPN。鉴于它既有效又高效,我们希望 FCOS 能够成为当时主流锚框检测器的一种简单而有力的替代。我们也相信,FCOS 可以推广到许多其他实例级识别任务。
Appendix
附录
7 Class-agnostic Precision-recall Curves
7 类别无关的精确率–召回率曲线
| Method | AP | AP50 | AP75 | AP90 |
|---|---|---|---|---|
| Orginal RetinaNet [15] | 39.5 | 63.6 | 41.8 | 10.6 |
| RetinaNet w/ GN [29] | 40.0 | 64.5 | 42.2 | 10.4 |
| FCOS | 40.5 | 64.7 | 42.6 | 13.1 |
| +0.2 | +0.4 | +2.7 |
Table 7: The class-agnostic detection performance for RetinaNet and FCOS. FCOS has better performance than RetinaNet. Moreover, the improvement over RetinaNet becomes larger with a stricter IOU threshold. The results are obtained with the same models in Table 4 of our main paper.
| 方法 | AP | AP50 | AP75 | AP90 |
|---|---|---|---|---|
| 原始 RetinaNet [15] | 39.5 | 63.6 | 41.8 | 10.6 |
| RetinaNet w/ GN [29] | 40.0 | 64.5 | 42.2 | 10.4 |
| FCOS | 40.5 | 64.7 | 42.6 | 13.1 |
| +0.2 | +0.4 | +2.7 |
表 7:RetinaNet 与 FCOS 的类别无关检测性能。FCOS 优于 RetinaNet。而且,IoU 阈值越严格,相对 RetinaNet 的提升越大。这些结果由正文表 4 中的同一组模型得到。
In Fig. 4, Fig. 5 and Fig. 6, we present class-agnostic precision-recall curves on split at IOU thresholds being 0.50, 0.75 and 0.90, respectively. Table 7 shows APs corresponding to the three curves.
在图 4、图 5 和图 6 中,我们给出了 划分上、IoU 阈值分别为 0.50、0.75 和 0.90 时的类别无关精确率–召回率曲线。表 7 列出了与这三条曲线对应的 AP。
As shown in Table 7, our FCOS achieves better performance than its anchor-based counterpart RetinaNet. Moreover, it worth noting that with a stricter IOU threshold, FCOS enjoys a larger improvement over RetinaNet, which suggests that FCOS has a better bounding box regressor to detect objects more accurately. One of the reasons should be that FCOS has the ability to leverage more foreground samples to train the regressor as mentioned in our main paper.
如表 7 所示,我们的 FCOS 优于对应的锚框方法 RetinaNet。还值得注意的是,IoU 阈值越严格,FCOS 相对 RetinaNet 的提升越大,这说明 FCOS 拥有更好的边界框回归器,能够更准确地检测物体。原因之一应当是:正如正文所述,FCOS 能够利用更多前景样本来训练回归器。
Finally, as shown in all precision-recall curves, the best recalls of these detectors in the precision-recall curves are much lower than . It further suggests that the small gap ( vs. ) of best possible recall (BPR) between FCOS and RetinaNet hardly harms the final detection performance.
最后,从所有精确率–召回率曲线都可以看到,这些检测器在曲线上的最好召回远低于 。这也进一步说明,FCOS 与 RetinaNet 之间很小的*最好可能召回(BPR)*差距( 对 )几乎不会损害最终的检测性能。
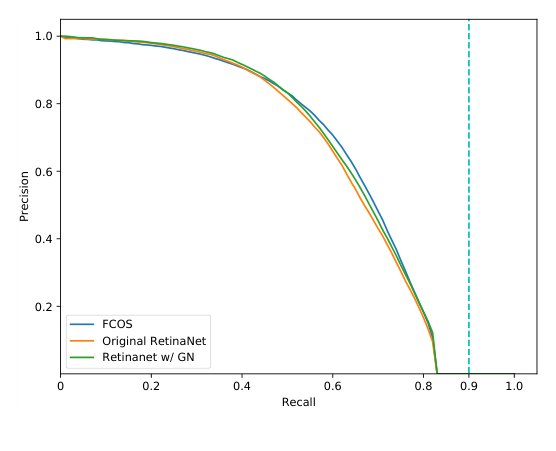
Figure 4: Class-agnostic precision-recall curves at IOU .
图 4:IoU 时的类别无关精确率–召回率曲线。
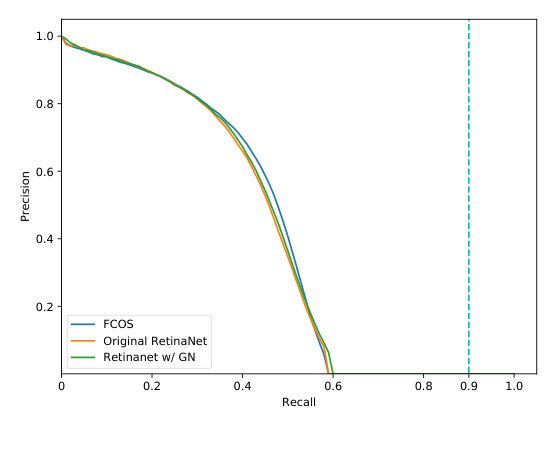
Figure 5: Class-agnostic precision-recall curves at IOU .
图 5:IoU 时的类别无关精确率–召回率曲线。
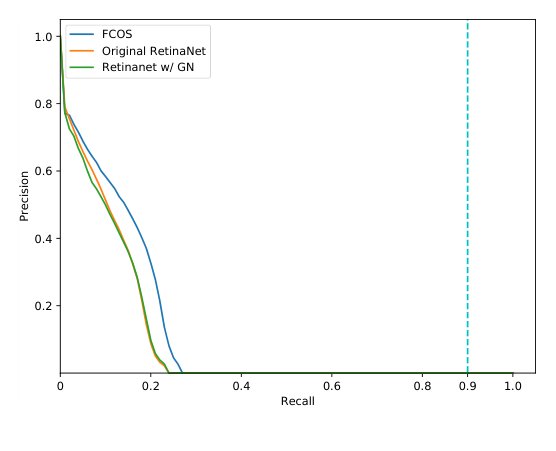
Figure 6: Class-agnostic precision-recall curves at IOU .
图 6:IoU 时的类别无关精确率–召回率曲线。
8 Visualization for Center-ness
8 中心度的可视化
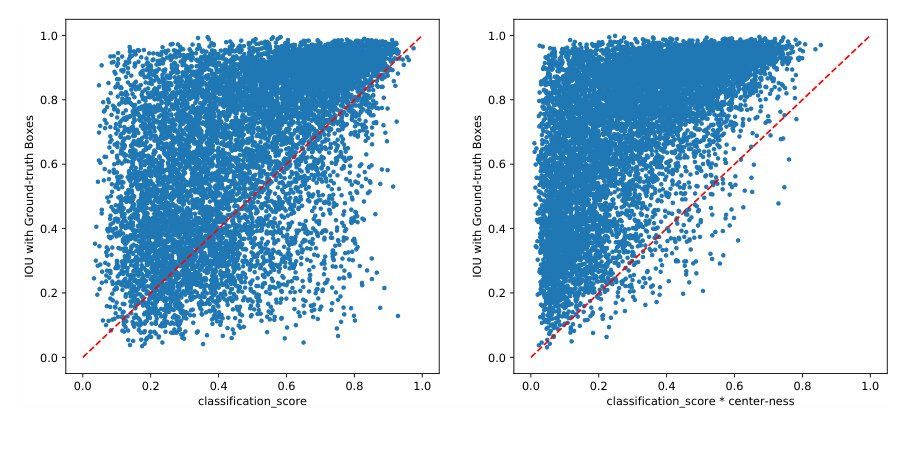
Figure 7: Without (left) or with (right) the proposed center-ness. A point in the figure denotes a detected bounding box. The dashed line is the line . As shown in the figure (right), after multiplying the classification scores with the center-ness scores, the low-quality boxes (under the line ) are pushed to the left side of the plot. It suggests that the scores of these boxes are reduced substantially.
图 7:不使用(左)和使用(右)所提出的中心度。图中每个点表示一个检测边界框。虚线是 。如右图所示,把分类分数与中心度分数相乘之后,低质量框(位于 下方)被推到了图的左侧。这说明这些框的分数被明显降低了。
As mentioned in our main paper, by suppressing low-quality detected bounding boxes, the proposed center-ness branch improves the detection performance by a large margin. In this section, we confirm this.
正如正文所述,通过压住低质量检测框,所提出的中心度分支大幅提高了检测性能。本节对此加以确认。
We expect that the center-ness can down-weight the scores of low-quality bounding boxes such that these bounding boxes can be filtered out in following post-processing such as non-maximum suppression (NMS). A detected bounding box is considered as a low-quality one if it has a low IOU score with its corresponding ground-truth bounding box. A bounding box with low IOU but a high confidence score is likely to become a false positive and harm the precision.
我们期望中心度能够降低低质量边界框的分数,从而使这些边界框在后续的非极大值抑制(NMS)等后处理中被滤掉。如果一个检测框与其对应真值框的 IoU 较低,它就被看成低质量框。一个 IoU 低但置信度高的边界框很容易成为假阳性,并损害精确率。
In Fig. 7, we consider a detected bounding box as a 2D point with being its score and being the IOU with its corresponding ground-truth box. As shown in Fig. 7 (left), before applying the center-ness, there are a large number of low-quality bounding boxes but with a high confidence score (i.e., the points under the line ). Due to their high scores, these low-quality bounding boxes cannot be eliminated in post-processing and result in lowering the precision of the detector. After multiplying the classification score with the center-ness score, these points are pushed to the left side of the plot (i.e., their scores are reduced), as shown in Fig. 7 (right). As a result, these low-quality bounding boxes are much more likely to be filtered out in post-processing and the final detection performance can be improved.
在图 7 中,我们把一个检测边界框看成二维点 ,其中 是它的分数, 是它与对应真值框的 IoU。如图 7(左)所示,在应用中心度之前,存在大量低质量、却有高置信度分数的边界框(也就是位于 下方的点)。由于分数很高,这些低质量边界框无法在后处理中被去掉,从而导致检测器的精确率下降。把分类分数与中心度分数相乘之后,这些点被推到图的左侧(也就是它们的分数被降低了),如图 7(右)所示。于是这些低质量边界框在后处理中被滤掉的可能性大大增加,最终检测性能也能得到提高。
9 Qualitative Results
9 定性结果

Figure 8: Some detection results on split. ResNet-50 is used as the backbone. As shown in the figure, FCOS works well with a wide range of objects including crowded, occluded, highly overlapped, extremely small and very large objects.
图 8: 划分上的一些检测结果。骨干网络为 ResNet-50。如图所示,FCOS 能够很好地处理范围很广的物体,包括拥挤、遮挡、高度重叠、极小以及非常大的物体。
Some qualitative results are shown in Fig. 8. As shown in the figure, our proposed FCOS can detect a wide range of objects including crowded, occluded, highly overlapped, extremely small and very large objects.
一些定性结果见图 8。如图所示,所提出的 FCOS 能够检测范围很广的物体,包括拥挤、遮挡、高度重叠、极小以及非常大的物体。
10 More discussions
10 更多讨论
Center-ness vs. IoUNet:
中心度与 IoUNet:
Center-ness and IoUNet of Jiang et al. “Acquisition of Localization Confidence for Accurate Object Detection” shares a similar purpose (i.e., to suppress low-quality predictions) with different approaches. IoUNet trains a separate network to predict the IoU score between predicted bounding-boxes and ground-truth boxes. Center-ness, as a part of our detector, only has a single layer and is trained jointly with the detector, thus being much simpler. Moreover, “center-ness” does not take as input the predicted bounding-boxes. Instead, it directly accesses the location’s ability to predict high-quality bounding-boxes.
中心度与 Jiang 等人“Acquisition of Localization Confidence for Accurate Object Detection”中的 IoUNet 目的相近(也就是压住低质量预测),但做法不同。IoUNet 训练一个单独的网络,来预测检测框与真值框之间的 IoU 分数。中心度作为我们检测器的一部分,只有一层,并且与检测器联合训练,因此简单得多。此外,“中心度”并不把预测的边界框当作输入。相反,它直接衡量该位置预测出高质量边界框的能力。
BPR in Section 4.1 and ambiguity analysis:
第 4.1 节中的 BPR 以及歧义分析:
We do not aim to compare “recall by specific IoU” with “recall by pixel within box”. The main purpose of Table 1 is to show that the upper bound of recall of FCOS is very close to the upper bound of recall of anchor-based RetinaNet (98.4% vs. 99.23%). BPR by other IoU thresholds are listed as those are used in the official code of RetinaNet. Moreover, no evidence shows that the regression targets of FCOS are difficult to learn because they are more spread-out. FCOS in fact yields more accurate bounding-boxes.
我们并不是要把“按特定 IoU 计算的召回”和“按像素是否落在框内计算的召回”拿来比较。表 1 的主要目的,是表明 FCOS 的召回上界与锚框版 RetinaNet 的召回上界非常接近(98.4% 对 99.23%)。按其他 IoU 阈值统计的 BPR 也被列了出来,因为这些阈值出现在 RetinaNet 的官方代码里。此外,并没有证据表明 FCOS 的回归目标因为分布更分散就更难学习。 FCOS 实际上给出了更准确的边界框。
During training, we deal with the ambiguity at the same FPN level by choosing the ground-truth box with the minimal area. When testing, if two objects A and B with the same class have overlap, no matter which one object the locations in the overlap predict, the prediction is correct and the missed one can be predicted by the locations only belonging to it. In the case that A and B do not belong to the same class, a location in the overlap might predict A’s class but regress B’s bounding-box, which is a mistake. That is why we only count the ambiguity across different classes. Moreover, it appears that this ambiguity does not make FCOS worse than RetinaNet in AP, as shown in Table 8.
训练时,我们在同一 FPN 层上处理歧义的办法,是选择面积最小的真值框。测试时,如果同类物体 A 和 B 有重叠,重叠处的位置不论预测成哪一个,预测都是正确的,被漏掉的那个可以由只属于它的位置来预测。如果 A 和 B 不属于同一类,重叠处的某个位置可能会预测 A 的类别、却回归 B 的边界框,这才是错误。这就是我们只统计跨类别歧义的原因。此外,如表 8 所示,这种歧义并没有让 FCOS 在 AP 上弱于 RetinaNet。
Additional ablation study:
补充消融实验:
As shown in Table 8, a vanilla FCOS performs on par with RetinaNet, being of simpler design and with less network outputs. Moreover, FCOS works much better than RetinaNet with single anchor. As for the gain on -, besides the performance gain brought by the components in Table 8, we conjecture that different training details (e.g., learning rate schedule) might cause slight differences in performance.
如表 8 所示,一个最朴素的 FCOS 已经能与 RetinaNet 打平,同时设计更简单,网络输出大约少 倍。而且,FCOS 明显优于只使用单个锚框的 RetinaNet。至于 - 上 的提升,除了表 8 中各组件带来的增益,我们猜想不同的训练细节(例如学习率日程)也可能造成轻微的性能差别。
| Method | GN | Scalar | IoU | AP | |
|---|---|---|---|---|---|
| RetinaNet (#A=1) | 32.5 | ||||
| RetinaNet (#A=9) | 35.7 | ||||
| FCOS (pure) | 35.7 | ||||
| FCOS | 35.8 | ||||
| FCOS | ✓ | 36.3 | |||
| FCOS | ✓ | ✓ | 36.4 | ||
| FCOS | ✓ | ✓ | ✓ | 36.6 |
Table 8: Ablation study on MS-COCO . “#A” is the number of anchor boxes per location in RetinaNet. “IOU” is IOU loss. “Scalar” denotes whether to use scalars in . All experiments are conducted with the same settings.
| 方法 | GN | 标量 | IoU | AP | |
|---|---|---|---|---|---|
| RetinaNet(#A=1) | 32.5 | ||||
| RetinaNet(#A=9) | 35.7 | ||||
| FCOS(纯净版) | 35.7 | ||||
| FCOS | 35.8 | ||||
| FCOS | ✓ | 36.3 | |||
| FCOS | ✓ | ✓ | 36.4 | ||
| FCOS | ✓ | ✓ | ✓ | 36.6 |
表 8:在 MS-COCO 上的消融实验。“#A”是 RetinaNet 中每个位置的锚框数量。“IOU”表示 IoU 损失。“标量”表示是否在 中使用标量。所有实验都在相同设定下进行。
RetinaNet with Center-ness:
带中心度的 RetinaNet:
Center-ness cannot be directly used in RetinaNet with multiple anchor boxes per location because one location on feature maps has only one center-ness score but different anchor boxes on the same location require different “center-ness” (note that center-ness is also used as “soft” thresholds for positive/negative samples).
中心度不能直接用在每个位置有多个锚框的 RetinaNet 上,因为特征图上的一个位置只有一个中心度分数,而同一位置上的不同锚框需要不同的“中心度”(注意,中心度也被当作正/负样本的“软”阈值来用)。
For anchor-based RetinaNet, the IoU score between anchor boxes and ground-truth boxes may serve as an alternative of “center-ness”.
对锚框版 RetinaNet 来说,锚框与真值框之间的 IoU 分数,可以当作“中心度”的一种替代。
Positive samples overlap with RetinaNet:
与 RetinaNet 的正样本重叠:
We want to highlight that center-ness comes into play only when testing. When training, all locations within ground-truth boxes are marked as positive samples. As a result, FCOS can use more foreground locations to train the regressor and thus yield more accurate bounding-boxes.
我们想强调:中心度只在测试时起作用。训练时,真值框内的所有位置都被标成正样本。因此,FCOS 可以使用更多前景位置来训练回归器,从而给出更准确的边界框。
Acknowledgments.
We would like to thank the author of [1] for the tricks of center sampling and GIoU. We also thank Chaorui Deng for HRNet based FCOS and his suggestion of positioning the center-ness branch with box regression.
致谢。
我们感谢 [1] 的作者提供中心采样和 GIoU 的技巧。我们也感谢 Chaorui Deng 提供基于 HRNet 的 FCOS,以及他把中心度分支放到框回归一侧的建议。
References
参考文献
[1] https://github.com/yqyao/FCOS_PLUS , 2019.
[2] Lokesh Boominathan, Srinivas SS Kruthiventi, and R Venkatesh Babu. Crowdnet: A deep convolutional network for dense crowd counting. In Proc. ACM Int. Conf. Multimedia , pages 640–644. ACM, 2016.
[3] Yu Chen, Chunhua Shen, Xiu-Shen Wei, Lingqiao Liu, and Jian Yang. Adversarial PoseNet: A structure-aware convolutional network for human pose estimation. In Proc. IEEE Int. Conf. Comp. Vis. , 2017.
[4] Jia Deng, Wei Dong, Richard Socher, Li-Jia Li, Kai Li, and Li Fei-Fei. ImageNet: A large-scale hierarchical image database. In Proc. IEEE Conf. Comp. Vis. Patt. Recogn. , pages 248–255. IEEE, 2009.
[5] Cheng-Yang Fu, Wei Liu, Ananth Ranga, Ambrish Tyagi, and Alexander Berg. DSSD: Deconvolutional single shot detector. arXiv preprint arXiv:1701.06659 , 2017.
[6] Ross Girshick. Fast R-CNN. In Proc. IEEE Conf. Comp. Vis. Patt. Recogn. , pages 1440–1448, 2015.
[7] Ross Girshick, Ilija Radosavovic, Georgia Gkioxari, Piotr Dollár, and Kaiming He. Detectron. https://github.com/facebookresearch/detectron , 2018.
[8] Kaiming He, Xiangyu Zhang, Shaoqing Ren, and Jian Sun. Deep residual learning for image recognition. In Proc. IEEE Conf. Comp. Vis. Patt. Recogn. , pages 770–778, 2016.
[9] Tong He, Chunhua Shen, Zhi Tian, Dong Gong, Changming Sun, and Youliang Yan. Knowledge adaptation for efficient semantic segmentation. In Proc. IEEE Conf. Comp. Vis. Patt. Recogn. , June 2019.
[10] Tong He, Zhi Tian, Weilin Huang, Chunhua Shen, Yu Qiao, and Changming Sun. An end-to-end textspotter with explicit alignment and attention. In Proc. IEEE Conf. Comp. Vis. Patt. Recogn. , pages 5020–5029, 2018.
[11] Jonathan Huang, Vivek Rathod, Chen Sun, Menglong Zhu, Anoop Korattikara, Alireza Fathi, Ian Fischer, Zbigniew Wojna, Yang Song, Sergio Guadarrama, et al. Speed/accuracy trade-offs for modern convolutional object detectors. In Proc. IEEE Conf. Comp. Vis. Patt. Recogn. , pages 7310–7311, 2017.
[12] Lichao Huang, Yi Yang, Yafeng Deng, and Yinan Yu. Densebox: Unifying landmark localization with end to end object detection. arXiv preprint arXiv:1509.04874 , 2015.
[13] Hei Law and Jia Deng. Cornernet: Detecting objects as paired keypoints. In Proc. Eur. Conf. Comp. Vis. , pages 734–750, 2018.
[14] Tsung-Yi Lin, Piotr Dollár, Ross Girshick, Kaiming He, Bharath Hariharan, and Serge Belongie. Feature pyramid networks for object detection. In Proc. IEEE Conf. Comp. Vis. Patt. Recogn. , pages 2117–2125, 2017.
[15] Tsung-Yi Lin, Priya Goyal, Ross Girshick, Kaiming He, and Piotr Dollár. Focal loss for dense object detection. In Proc. IEEE Conf. Comp. Vis. Patt. Recogn. , pages 2980–2988, 2017.
[16] Tsung-Yi Lin, Michael Maire, Serge Belongie, James Hays, Pietro Perona, Deva Ramanan, Piotr Dollár, and Lawrence Zitnick. Microsoft COCO: Common objects in context. In Proc. Eur. Conf. Comp. Vis. , pages 740–755. Springer, 2014.
[17] Fayao Liu, Chunhua Shen, Guosheng Lin, and Ian Reid. Learning depth from single monocular images using deep convolutional neural fields. IEEE Trans. Pattern Anal. Mach. Intell. , 2016.
[18] Wei Liu, Dragomir Anguelov, Dumitru Erhan, Christian Szegedy, Scott Reed, Cheng-Yang Fu, and Alexander C Berg. SSD: Single shot multibox detector. In Proc. Eur. Conf. Comp. Vis. , pages 21–37. Springer, 2016.
[19] Yifan Liu, Ke Chen, Chris Liu, Zengchang Qin, Zhenbo Luo, and Jingdong Wang. Structured knowledge distillation for semantic segmentation. In Proc. IEEE Conf. Comp. Vis. Patt. Recogn. , June 2019.
[20] Jonathan Long, Evan Shelhamer, and Trevor Darrell. Fully convolutional networks for semantic segmentation. In Proc. IEEE Conf. Comp. Vis. Patt. Recogn. , pages 3431–3440, 2015.
[21] Joseph Redmon, Santosh Divvala, Ross Girshick, and Ali Farhadi. You only look once: Unified, real-time object detection. In Proc. IEEE Conf. Comp. Vis. Patt. Recogn. , pages 779–788, 2016.
[22] Joseph Redmon and Ali Farhadi. YOLO9000: better, faster, stronger. In Proc. IEEE Conf. Comp. Vis. Patt. Recogn. , pages 7263–7271, 2017.
[23] Joseph Redmon and Ali Farhadi. Yolov3: An incremental improvement. arXiv preprint arXiv:1804.02767 , 2018.
[24] Shaoqing Ren, Kaiming He, Ross Girshick, and Jian Sun. Faster R-CNN: Towards real-time object detection with region proposal networks. In Proc. Adv. Neural Inf. Process. Syst. , pages 91–99, 2015.
[25] Abhinav Shrivastava, Rahul Sukthankar, Jitendra Malik, and Abhinav Gupta. Beyond skip connections: Top-down modulation for object detection. In Proc. IEEE Conf. Comp. Vis. Patt. Recogn. , 2017.
[26] Ke Sun, Bin Xiao, Dong Liu, and Jingdong Wang. Deep high-resolution representation learning for human pose estimation. In Proc. IEEE Conf. Comp. Vis. Patt. Recogn. , 2019.
[27] Christian Szegedy, Sergey Ioffe, Vincent Vanhoucke, and Alexander A Alemi. Inception-v4, inception-resnet and the impact of residual connections on learning. In Proc. National Conf. Artificial Intell. , 2017.
[28] Zhi Tian, Tong He, Chunhua Shen, and Youliang Yan. Decoders matter for semantic segmentation: Data-dependent decoding enables flexible feature aggregation. In Proc. IEEE Conf. Comp. Vis. Patt. Recogn. , pages 3126–3135, 2019.
[29] Yuxin Wu and Kaiming He. Group normalization. In Proc. Eur. Conf. Comp. Vis. , pages 3–19, 2018.
[30] Saining Xie, Ross Girshick, Piotr Dollár, Zhuowen Tu, and Kaiming He. Aggregated residual transformations for deep neural networks. In Proc. IEEE Conf. Comp. Vis. Patt. Recogn. , pages 1492–1500, 2017.
[31] Wei Yin, Yifan Liu, Chunhua Shen, and Youliang Yan. Enforcing geometric constraints of virtual normal for depth prediction. In Proc. IEEE Int. Conf. Comp. Vis. , 2019.
[32] Jiahui Yu, Yuning Jiang, Zhangyang Wang, Zhimin Cao, and Thomas Huang. Unitbox: An advanced object detection network. In Proc. ACM Int. Conf. Multimedia , pages 516–520. ACM, 2016.
[33] Xinyu Zhou, Cong Yao, He Wen, Yuzhi Wang, Shuchang Zhou, Weiran He, and Jiajun Liang. EAST: an efficient and accurate scene text detector. In Proc. IEEE Conf. Comp. Vis. Patt. Recogn. , pages 5551–5560, 2017.
[34] Chenchen Zhu, Yihui He, and Marios Savvides. Feature selective anchor-free module for single-shot object detection. In Proc. IEEE Conf. Comp. Vis. Patt. Recogn. , June 2019.