Do Open-Loop Metrics Predict Closed-Loop Driving? A Cross-Benchmark Correlation Study of NAVSIM and Bench2Drive
Do Open-Loop Metrics Predict Closed-Loop Driving? A Cross-Benchmark Correlation Study of NAVSIM and Bench2Drive
开环指标能否预测闭环驾驶?NAVSIM 与 Bench2Drive 的跨基准相关性研究
Yiru Wang Anqing Jiang Shuo Wang Yuwen Heng Hai Yang Yang Chen Hao Sun † † thanks: This work was supported by Bosch Corporate Research. ( Corresponding author: hao.sun4@cn.bosch.com ) † † thanks: Yiru Wang, Anqing Jiang, Shuo Wang, Yuwen Heng, Hai Yang, Yang Chen, Hao Sun are with Bosch Corporate Research, Bosch (China) Investment Ltd., Shanghai, China.
Abstract
摘要
Open-loop evaluation offers fast, reproducible assessment of autonomous driving planners, but its ability to predict real closed-loop driving performance remains questionable. Prior work has shown that traditional open-loop metrics such as Average Displacement Error (ADE) and Final Displacement Error (FDE) exhibit no reliable correlation with closed-loop Driving Score. In this paper, we ask whether the more recent, safety-aware open-loop metrics introduced by NAVSIM v2 can bridge this gap. By systematically cross-referencing published results from 15 state-of-the-art methods across NAVSIM (open-loop) and Bench2Drive (closed-loop), we compile a paired dataset of open-loop sub-metrics and closed-loop performance, yielding 8 methods with complete paired data. Our analysis reveals three key findings: (1) the aggregate NAVSIM PDM Score shows a strong positive but non-monotonic correlation with Bench2Drive Driving Score (Spearman , ), with clear ranking inversions; (2) among individual NAVSIM sub-metrics, Ego Progress (EP) is the strongest single predictor of closed-loop success (), substantially exceeding the safety-critical collision metric NC (); (3) the safety–progress trade-off manifests differently in open-loop and closed-loop: methods that maximize safety at the expense of progress rank highly in NAVSIM but underperform in closed-loop due to timeout and slow-driving penalties. We further demonstrate that a much simpler 3-metric formula (CL-Proxy NCDACEP) matches the predictive power of the full 5-metric PDMS at the same Spearman on our paired sample of methods, suggesting that within current state-of-the-art methods—where TTC and Comfort approach saturation—these two sub-metrics add little marginal information for closed-loop ranking. Additionally, we identify the snowball effect—where small open-loop deviations compound into closed-loop failures—as a candidate mechanism for the residual gap.
开环评测能快速、可复现地评估自动驾驶规划器,但它能否预测真实闭环驾驶表现,仍存疑。已有工作表明,平均位移误差(ADE)、最终位移误差(FDE)等传统开环指标与闭环 Driving Score 没有可靠相关性。本文追问:NAVSIM v2 引入的、更偏安全意识的开环指标,能否弥合这一鸿沟。我们系统交叉核对 15 个前沿方法在 NAVSIM(开环)与 Bench2Drive(闭环)上的公开结果,整理出开环子指标与闭环表现的配对数据,其中有完整配对的方法共 8 个。分析得到三点发现:(1)汇总的 NAVSIM PDM Score 与 Bench2Drive Driving Score 呈强正相关、但非单调(Spearman ,),并出现明显名次翻转;(2)在各子指标中,自车进度(EP)是闭环成功的最强单一预测因子(),远高于安全关键的碰撞指标 NC();(3)安全—进度权衡在开环与闭环中的表现不同:以牺牲进度换取安全最大化的方法在 NAVSIM 排名靠前,却因超时与慢速惩罚在闭环中落后。我们还表明,更简单的三指标公式(CL-Proxy NCDACEP)在 的配对样本上达到与完整五指标 PDMS 相同的 Spearman ,提示在当前前沿方法中——TTC 与 Comfort 已接近饱和——这两项子指标对闭环排名几乎不提供额外信息。此外,我们把滚雪球效应——开环中的小偏差在闭环中放大为失败——视为解释残差差距的候选机制,并据此提出开环基准设计的若干原则。
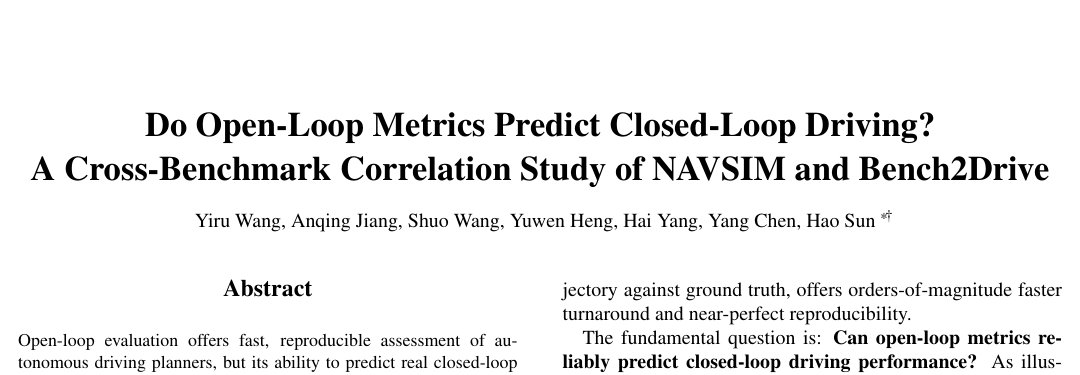
Figure 1: Can open-loop metrics predict closed-loop driving? Each point represents one method evaluated on both benchmarks; denotes the number of such paired methods. (a) Traditional L2 displacement shows no correlation with closed-loop Driving Score ( paired methods, CARLA Leaderboard v2 protocol). (b) NAVSIM’s safety-aware PDMS shows strong positive correlation ( paired methods), but with ranking inversions. (c) Not all sub-metrics are equal: among individual NAVSIM components, Ego Progress (EP) is the strongest single predictor of closed-loop DS (), substantially exceeding the collision metric NC (). The aggregate PDMS slightly exceeds EP alone (), but as we show, the same correlation can be achieved by a much simpler 3-metric formula (§6).
图 1:开环指标能否预测闭环驾驶?每个点表示同时在两个基准上评测的一个方法; 为这类配对方法数。(a)传统 L2 位移与闭环 Driving Score 无相关( 个配对方法,CARLA Leaderboard v2 协议)。(b)NAVSIM 的安全感知 PDMS 呈强正相关(),但仍有名次翻转。(c)子指标并不等价:在 NAVSIM 各分量中,自车进度(EP)是闭环 DS 的最强单一预测因子(),远高于碰撞指标 NC()。汇总 PDMS 略高于单独 EP(),但我们后面会说明,用更简单的三指标公式也能达到同样相关(§6)。
1. Introduction
1. 引言
Evaluating autonomous driving planners in closed-loop simulation—where the ego vehicle executes its planned trajectory step by step and the environment reacts accordingly—is the gold standard for assessing driving competence. However, closed-loop evaluation incurs substantial computational cost (hours per model on CARLA [19]), suffers from high variance across runs, and requires complex simulation infrastructure. Open-loop evaluation, which assesses a single predicted trajectory against ground truth, offers orders-of-magnitude faster turnaround and near-perfect reproducibility.
在闭环仿真中评估自动驾驶规划器——自车逐步执行规划轨迹、环境随之反应——是衡量驾驶能力的金标准。但闭环评测计算开销大(CARLA 上每个模型往往要数小时)[19],运行方差高,还依赖复杂仿真基础设施。开环评测只把一次预测轨迹与真值对照,周转可快几个数量级,复现性也近乎完美。
The fundamental question is: Can open-loop metrics reliably predict closed-loop driving performance? As illustrated in Figure 1, the answer depends critically on which open-loop metric is used.
根本问题是:开环指标能否可靠预测闭环驾驶表现?如图 1 所示,答案高度取决于用的是哪一种开环指标。
Prior work answers this question negatively for traditional metrics. Dauner et al. [5] demonstrated that ADE and FDE—the dominant open-loop metrics for trajectory prediction—show no meaningful correlation with closed-loop driving quality. In the nuPlan Challenge 2023, the top-ranked open-loop method performed poorly in closed-loop evaluation. Li et al. [9] further exposed the fragility of traditional open-loop metrics by showing that a simple MLP using only ego status (speed and acceleration) can achieve state-of-the-art open-loop performance on nuScenes, without any scene understanding.
对传统指标,已有工作给出否定答案。Dauner 等人 [5] 证明 ADE、FDE——轨迹预测中占主导的开环指标——与闭环驾驶质量没有实质相关。在 nuPlan Challenge 2023 中,开环排名第一的方法在闭环评测中表现很差。Li 等人 [9] 进一步暴露传统开环指标的脆弱性:一个只用自车状态(速度与加速度)的简单 MLP,就能在 nuScenes 上拿到开环 SOTA,却完全不理解场景。
Recognizing these shortcomings, the NAVSIM benchmark [6] introduced a fundamentally different open-loop evaluation paradigm. Instead of measuring trajectory displacement, NAVSIM employs a suite of safety-aware, rule-based sub-metrics—including collision detection (NC), drivable area compliance (DAC), time-to-collision (TTC), ego progress (EP), and comfort metrics—aggregated via a multiplicative penalty structure that mimics the “one crash ends the run” semantics of closed-loop evaluation. The extended version, NAVSIM v2, further adds driving direction compliance (DDC), traffic light compliance (TLC), lane keeping (LK), and extended comfort metrics, resulting in the Extended PDM Score (EPDMS).
认识到这些缺陷后,NAVSIM 基准 [6] 引入了截然不同的开环评测范式。它不再测轨迹位移,而采用一套安全感知、基于规则的子指标——包括碰撞检测(NC)、可行驶区域合规(DAC)、碰撞时间(TTC)、自车进度(EP)与舒适度——并以乘性惩罚结构汇总,模拟闭环中“一次碰撞即结束”的语义。扩展版 NAVSIM v2 进一步加入行驶方向合规(DDC)、红绿灯合规(TLC)、车道保持(LK)与扩展舒适度,得到扩展 PDM Score(EPDMS)。
Meanwhile, the Bench2Drive benchmark [7] provides a standardized closed-loop evaluation protocol on CARLA v2, measuring Driving Score (DS) and Success Rate (SR) across 220 diverse routes with 44 interactive scenarios. As the community has matured, an increasing number of methods now report results on both NAVSIM and Bench2Drive, creating an unprecedented opportunity for cross-benchmark correlation analysis.
与此同时,Bench2Drive 基准 [7] 在 CARLA v2 上提供标准化闭环评测协议,在 220 条多样路线、44 类交互场景上报告 Driving Score(DS)与 Success Rate(SR)。随着社区成熟,越来越多方法同时报告 NAVSIM 与 Bench2Drive 结果,为跨基准相关性分析创造了前所未有的机会。
Contributions. In this paper, we:
贡献。本文:
- Compile a cross-benchmark paired dataset by systematically cross-referencing published results from 15 methods that report on both NAVSIM and Bench2Drive, yielding 8 complete paired data points (§4).
- Show that NAVSIM’s safety-aware aggregate score (PDMS) exhibits positive but non-monotonic correlation with closed-loop DS, with clear ranking inversions caused by the safety–progress trade-off (§5.2).
- Identify Ego Progress (EP) as the strongest individual sub-metric predictor of closed-loop success, and reveal that the safety–progress trade-off is the primary source of ranking disagreement between open-loop and closed-loop evaluations (§5.3).
- Propose a simplified closed-loop proxy (CL-Proxy) using only 3 of the 5 PDMS sub-metrics that matches the rank correlation of the full PDMS on our paired data, suggesting that TTC and Comfort add little marginal predictive value among current top methods (§6).
- 通过系统交叉核对同时报告 NAVSIM 与 Bench2Drive 的 15 个方法的公开结果,整理出跨基准配对数据集,得到 8 个完整配对点(§4)。
- 表明 NAVSIM 的安全感知汇总分数(PDMS)与闭环 DS 呈正相关、但非单调,名次翻转主要来自安全—进度权衡(§5.2)。
- 指出自车进度(EP)是最强的单个子指标预测因子,并揭示安全—进度权衡是开环与闭环名次分歧的主要来源(§5.3)。
- 提出只用 PDMS 五个子指标中三个的简化闭环代理(CL-Proxy),在配对数据上达到与完整 PDMS 相同的秩相关,提示 TTC 与 Comfort 对当前顶尖方法几乎不提供额外预测价值(§6)。
2. Related Work
2. 相关工作
Open-Loop Evaluation.
Open-loop evaluation has been the default paradigm in trajectory prediction and motion planning. Traditional metrics such as ADE, FDE, and miss rate measure geometric deviation between predicted and ground-truth trajectories [20, 21]. However, these metrics do not account for safety, rule compliance, or physical feasibility. The nuPlan benchmark [22] introduced more holistic metrics but maintained an open-loop protocol. NAVSIM [6] represented a paradigm shift by introducing non-reactive simulation with safety-aware scoring, designed to approximate closed-loop semantics within an open-loop framework. NAVSIM v2 extended this with additional rule-compliance and comfort metrics. Despite these advances, no systematic study has quantified how well NAVSIM metrics predict actual closed-loop performance.
开环评测。
开环评测一直是轨迹预测与运动规划的默认范式。ADE、FDE、未命中率等传统指标衡量预测轨迹与真值轨迹的几何偏差 [20, 21]。但它们不考虑安全、规则合规或物理可行性。nuPlan 基准 [22] 引入了更全面的指标,但仍保持开环协议。NAVSIM [6] 代表范式转变:引入非反应式仿真与安全感知计分,意在在开环框架内逼近闭环语义。NAVSIM v2 又扩展了规则合规与舒适度指标。尽管有这些进展,尚无系统研究量化 NAVSIM 指标对真实闭环表现的预测能力。
Closed-Loop Evaluation.
Closed-loop benchmarks evaluate driving agents in interactive simulation. The CARLA Leaderboard [19] was among the first, but suffered from reproducibility issues. Bench2Drive [7] addressed this by providing standardized short routes with diverse interactive scenarios, measuring Driving Score as the product of route completion and infraction penalties. The recently proposed Bench2Drive-VL [18] extends this to vision-language models. Despite their fidelity, closed-loop benchmarks remain expensive and high-variance, motivating research into open-loop proxies.
闭环评测。
闭环基准在交互式仿真中评估驾驶智能体。CARLA Leaderboard [19] 属于最早一批,但复现性不佳。Bench2Drive [7] 用标准化短路线与多样交互场景解决这一问题,以路线完成度与违规惩罚的乘积作为 Driving Score。近期提出的 Bench2Drive-VL [18] 将其扩展到视觉—语言模型。尽管保真度更高,闭环基准仍然昂贵且高方差,这推动了开环代理的研究。
Open-Loop vs. Closed-Loop Gap.
Dauner et al. [5] provided the first systematic analysis showing that open-loop trajectory metrics do not predict closed-loop performance, attributing the gap to compounding errors, non-reactive agents, and distribution shift. Li et al. [9] further demonstrated that open-loop metrics can be trivially gamed. More recently, the Waymo team [8] showed that within a single architecture family, open-loop loss and closed-loop failure rates follow a power-law relationship when scaling data and compute—but this relationship breaks down across different architectures. Our work bridges these findings by asking whether NAVSIM’s multi-dimensional, safety-aware metrics can serve as a more reliable open-loop proxy across diverse architectures.
开环与闭环的差距。
Dauner 等人 [5] 首次系统分析表明,开环轨迹指标不能预测闭环表现,并把差距归因于误差累积、非反应式智能体与分布偏移。Li 等人 [9] 进一步证明开环指标可被轻易“刷分”。更近地,Waymo 团队 [8] 表明:在同一架构族内,开环损失与闭环失败率随数据与算力缩放服从幂律——但这一关系跨架构即失效。我们的工作衔接这些发现,追问 NAVSIM 的多维、安全感知指标,能否在不同架构间充当更可靠的开环代理。
End-to-End Autonomous Driving.
Recent end-to-end planners have increasingly been evaluated on both open-loop and closed-loop benchmarks, enabling the cross-benchmark analysis we conduct. Notable examples include UniAD [14], Hydra-MDP [11], DiffusionDrive [15], Hydra-NeXt [10], GoalFlow [16], SparseDriveV2 [12], SafeDrive [13], DriveTransformer [17], VADv2 [24], WoTE [25], and DriveSuprim [26].
端到端自动驾驶。
近期端到端规划器越来越多同时在开环与闭环基准上评测,使我们的跨基准分析成为可能。代表性工作包括 UniAD [14]、Hydra-MDP [11]、DiffusionDrive [15]、Hydra-NeXt [10]、GoalFlow [16]、SparseDriveV2 [12]、SafeDrive [13]、DriveTransformer [17]、VADv2 [24]、WoTE [25] 与 DriveSuprim [26]。
3. Background
3. 背景
3.1. NAVSIM Open-Loop Metrics
3.1. NAVSIM 开环指标
NAVSIM evaluates predicted trajectories using a set of sub-metrics, aggregated into the PDM Score (PDMS) and the Extended PDM Score (EPDMS).
NAVSIM 用一组子指标评估预测轨迹,并汇总为 PDM Score(PDMS)与扩展 PDM Score(EPDMS)。
PDMS.
The PDM Score combines penalty metrics (multiplicative gates) with weighted average metrics:
PDMS。
PDM Score 把惩罚指标(乘性门控)与加权平均指标结合起来:
where NC (No at-fault Collision) and DAC (Drivable Area Compliance) act as binary/ternary gates that zero out the score upon violation, while TTC (Time-to-Collision), C (Comfort), and EP (Ego Progress) contribute to a weighted average.
其中 NC(无责任碰撞)与 DAC(可行驶区域合规)作为二元/三元门控,一旦违规即把分数置零;TTC(碰撞时间)、C(舒适度)与 EP(自车进度)则进入加权平均。
EPDMS.
The Extended PDM Score adds four sub-metrics and modifies the aggregation:
EPDMS。
扩展 PDM Score 增加四个子指标,并调整汇总方式:
where are penalty gates, and contains EP (5), TTC (5), LK (2), HC (2), EC (2) with weights in parentheses. EPDMS also applies human-behavior filtering: if the human driver also violates a rule, the predicted trajectory is not penalized.
其中 为惩罚门控, 含 EP(5)、TTC(5)、LK(2)、HC(2)、EC(2),括号内为权重。EPDMS 还施加人类行为过滤:若人类驾驶员也违反同一规则,则预测轨迹不予惩罚。
3.2. Bench2Drive Closed-Loop Metrics
3.2. Bench2Drive 闭环指标
Bench2Drive [7] evaluates closed-loop performance on 220 short routes in CARLA across 44 interactive scenarios.
Bench2Drive [7] 在 CARLA 的 220 条短路线、44 类交互场景上评估闭环表现。
Driving Score (DS).
The primary metric combines route completion with infraction penalties:
Driving Score(DS)。
主指标把路线完成度与违规惩罚结合起来:
where is the route completion percentage and is the penalty factor for the -th infraction (e.g., 0.50 for pedestrian collision, 0.60 for vehicle collision, 0.70 for running red lights, 0.70 for driving too slowly).
其中 为路线完成百分比, 为第 次违规的惩罚因子(例如行人碰撞 0.50、车辆碰撞 0.60、闯红灯 0.70、行驶过慢 0.70)。
Success Rate (SR).
The fraction of routes completed without any infractions:
Success Rate(SR)。
无任何违规完成的路线占比:
Evaluation Protocols.
Bench2Drive supports two evaluation protocols that differ in how slow-driving infractions are handled [10]. Under the CARLA v2 protocol, minimum-speed infractions are accumulated multiplicatively into the Driving Score ( each), making DS sensitive to conservative driving. The Bench2Drive protocol instead separates speed infractions into a standalone Efficiency metric and relaxes the route time limit, yielding systematically higher DS for the same model. For example, Hydra-NeXt reports DS 65.89 under CARLA v2 vs. 73.86 under the Bench2Drive protocol. Unless otherwise noted, we use the Bench2Drive protocol for cross-benchmark correlation analysis (Tables 2–4), as it is the protocol adopted by the majority of recent publications.
评测协议。
Bench2Drive 支持两种评测协议,差别在于如何处理慢速违规 [10]。在 CARLA v2 协议下,最低速度违规乘性地计入 Driving Score(每次 ),使 DS 对保守驾驶敏感。Bench2Drive 协议则把速度违规单独放入 Efficiency 指标,并放宽路线时限,从而使同一模型的 DS 系统性更高。例如 Hydra-NeXt 在 CARLA v2 下报告 DS 65.89,在 Bench2Drive 协议下为 73.86。除非另有说明,跨基准相关性分析(表 2–4)采用 Bench2Drive 协议,因为这是近期大多数论文采用的协议。
3.3. Structural Similarities and Differences
3.3. 结构相似与差异
Both NAVSIM and Bench2Drive employ multiplicative penalty structures for safety violations. However, key differences exist:
NAVSIM 与 Bench2Drive 都对安全违规采用乘性惩罚结构。但关键差异仍在:
- • Reactivity: NAVSIM replays recorded agent trajectories regardless of the ego’s actions; Bench2Drive simulates reactive agents.
- • Compounding errors: NAVSIM evaluates a single 4-second trajectory; Bench2Drive executes trajectories step-by-step over entire routes, accumulating errors.
- • Slow-driving penalty: Bench2Drive penalizes overly slow driving (); NAVSIM has no equivalent penalty—EP measures progress but does not penalize conservatism as harshly.
- • Control conversion: Bench2Drive requires converting trajectories to vehicle control commands (steering, throttle, brake), introducing an additional error source absent in NAVSIM.
- • 反应性:NAVSIM 不论自车动作如何,都回放记录的智能体轨迹;Bench2Drive 仿真反应式智能体。
- • 误差累积:NAVSIM 评估单条 4 秒轨迹;Bench2Drive 在整条路线上逐步执行轨迹并累积误差。
- • 慢速惩罚:Bench2Drive 惩罚过慢驾驶();NAVSIM 没有等价惩罚——EP 衡量进度,但对保守性的惩罚没有那么重。
- • 控制转换:Bench2Drive 需要把轨迹转为车辆控制指令(转向、油门、刹车),引入 NAVSIM 中不存在的额外误差源。
These structural differences create systematic biases in the open-to-closed-loop mapping, which we analyze in §5.
这些结构差异在开环到闭环的映射中造成系统性偏差,我们在 §5 分析。
4. Cross-Benchmark Paired Dataset
4. 跨基准配对数据集
| Method | Open-loop L2 | DS | SR |
|---|---|---|---|
| TCP [29] | 1.70 | 23.63 | 7.72% |
| UniAD [14] | 0.73 | 37.72 | 9.54% |
| VAD [30] | 0.91 | 39.42 | 10.00% |
| ThinkTwice* [31] | 0.95 | 39.88 | 28.14% |
| DriveAdapter* [32] | 1.01 | 42.91 | 30.71% |
| Hydra-MDP [11] | 0.82 | 52.80 | 30.73% |
| Hydra-NeXt [10] | 0.92 | 65.89 | 48.20% |
Table 1: Traditional open-loop L2 error vs. closed-loop metrics. Data from Hydra-NeXt [10] Table 1, evaluated under the CARLA Leaderboard v2 protocol (DS values are systematically lower than the standard Bench2Drive protocol used in Tables 2–4). * denotes methods using expert feature distillation.
| 方法 | 开环 L2 | DS | SR |
|---|---|---|---|
| TCP [29] | 1.70 | 23.63 | 7.72% |
| UniAD [14] | 0.73 | 37.72 | 9.54% |
| VAD [30] | 0.91 | 39.42 | 10.00% |
| ThinkTwice* [31] | 0.95 | 39.88 | 28.14% |
| DriveAdapter* [32] | 1.01 | 42.91 | 30.71% |
| Hydra-MDP [11] | 0.82 | 52.80 | 30.73% |
| Hydra-NeXt [10] | 0.92 | 65.89 | 48.20% |
表 1:传统开环 L2 误差与闭环指标对照。数据来自 Hydra-NeXt [10] 表 1,按 CARLA Leaderboard v2 协议评测(DS 系统性低于表 2–4 所用的标准 Bench2Drive 协议)。* 表示使用专家特征蒸馏的方法。
4.1. Data Collection Methodology
4.1. 数据收集方法
We compile paired open-loop and closed-loop results by systematically cross-referencing published tables from recent papers. Specifically, we extract:
我们通过系统交叉核对近期论文的公开表格,整理配对的开环与闭环结果。具体提取:
- • NAVSIM PDMS and sub-metrics from Tables in SparseDriveV2 [12], SafeDrive [13], Hydra-NeXt [10], and WoTE [25].
- • Bench2Drive DS and SR from the same papers, as well as from VADv2 [24] and DriveSuprim [26].
- • Traditional open-loop L2 error from Hydra-NeXt [10] Table 1.
- • SparseDriveV2 [12]、SafeDrive [13]、Hydra-NeXt [10]、WoTE [25] 表格中的 NAVSIM PDMS 与子指标。
- • 同一批论文以及 VADv2 [24]、DriveSuprim [26] 中的 Bench2Drive DS 与 SR。
- • Hydra-NeXt [10] 表 1 中的传统开环 L2 误差。
| Method | NAVSIM PDMS | NAVSIM EPDMS | B2D DS | B2D SR | Source |
|---|---|---|---|---|---|
| UniAD [14] | 83.4 | — | 45.81 | 16.36% | SafeDrive T1+T3 |
| VAD [30] | — | — | 42.35 | 15.00% | SafeDrive T3 |
| BridgeAD [1] | — | — | 50.06 | 22.73% | SafeDrive T3 |
| Hydra-MDP [11] | 86.5 | — | 59.95 | 29.82% | SafeDrive T1+T3 |
| WoTE [25] | 88.3 | — | 61.71 | 31.36% | WoTE T1+T2 |
| DriveDPO [2] | — | — | 62.02 | 30.62% | SafeDrive T3 |
| DriveTransformer [17] | — | — | 63.46 | 35.01% | SparseDriveV2 T4 |
| SafeDrive [13] | 91.6 | 87.5 | 66.77 | 42.40% | SafeDrive T1+T3 |
| Hydra-NeXt [10] | 88.6 | — | 73.86 | 50.00% | Hydra-NeXt T2+T4 |
| VADv2 [24] | 89.3 | 85.8 | 76.15 | 50.46% | VADv2 T2+T5 |
| DriveSuprim [26] | 93.5 | 87.1 | 83.02 | 60.00% | DriveSuprim T2+T4 |
| SimLingo [3] | — | — | 86.02 | 67.27% | SparseDriveV2 T4 |
| HiP-AD [4] | — | — | 86.77 | 69.09% | SparseDriveV2 T4 |
| DiffRefiner [23] | — | 87.4 | 87.10 | 71.40% | Abstract (AAAI’26) |
| SparseDriveV2 [12] | 92.0 | 90.1 | 89.15 | 70.00% | SparseDriveV2 T2+T4 |
Table 2: Cross-benchmark results from SparseDriveV2 [12], SafeDrive [13], VADv2 [24], and DriveSuprim [26]. All Bench2Drive results use the standard Bench2Drive evaluation protocol. “—” indicates the metric was not reported in the source.
| 方法 | NAVSIM PDMS | NAVSIM EPDMS | B2D DS | B2D SR | 来源 |
|---|---|---|---|---|---|
| UniAD [14] | 83.4 | — | 45.81 | 16.36% | SafeDrive T1+T3 |
| VAD [30] | — | — | 42.35 | 15.00% | SafeDrive T3 |
| BridgeAD [1] | — | — | 50.06 | 22.73% | SafeDrive T3 |
| Hydra-MDP [11] | 86.5 | — | 59.95 | 29.82% | SafeDrive T1+T3 |
| WoTE [25] | 88.3 | — | 61.71 | 31.36% | WoTE T1+T2 |
| DriveDPO [2] | — | — | 62.02 | 30.62% | SafeDrive T3 |
| DriveTransformer [17] | — | — | 63.46 | 35.01% | SparseDriveV2 T4 |
| SafeDrive [13] | 91.6 | 87.5 | 66.77 | 42.40% | SafeDrive T1+T3 |
| Hydra-NeXt [10] | 88.6 | — | 73.86 | 50.00% | Hydra-NeXt T2+T4 |
| VADv2 [24] | 89.3 | 85.8 | 76.15 | 50.46% | VADv2 T2+T5 |
| DriveSuprim [26] | 93.5 | 87.1 | 83.02 | 60.00% | DriveSuprim T2+T4 |
| SimLingo [3] | — | — | 86.02 | 67.27% | SparseDriveV2 T4 |
| HiP-AD [4] | — | — | 86.77 | 69.09% | SparseDriveV2 T4 |
| DiffRefiner [23] | — | 87.4 | 87.10 | 71.40% | Abstract (AAAI’26) |
| SparseDriveV2 [12] | 92.0 | 90.1 | 89.15 | 70.00% | SparseDriveV2 T2+T4 |
表 2:来自 SparseDriveV2 [12]、SafeDrive [13]、VADv2 [24] 与 DriveSuprim [26] 的跨基准结果。所有 Bench2Drive 结果均采用标准 Bench2Drive 评测协议。“—” 表示来源未报告该指标。
We match methods that appear in both open-loop and closed-loop tables of the same paper or across papers that cite the same original checkpoint/configuration. We exclude methods where the open-loop and closed-loop evaluations used different model configurations or training data.
我们匹配在同一论文开环与闭环表中同时出现的方法,或跨论文但引用同一原始检查点/配置的方法。若开环与闭环评测使用了不同模型配置或训练数据,则予以排除。
To ensure the validity of our sub-metric correlation analysis (Table 4), we adopt the following configuration-matching policy. For methods reported in third-party survey tables (UniAD, Hydra-MDP, WoTE, Hydra-NeXt, SafeDrive, SparseDriveV2), we use the cross-benchmark numbers as compiled by SparseDriveV2 [12], SafeDrive [13], and Hydra-NeXt [10], where consistent model configurations across NAVSIM and Bench2Drive are documented. For VADv2 and DriveSuprim, we extract NAVSIM sub-metrics from each method’s own paper (VADv2 Table 2, DriveSuprim Table 2 ViT-L row) and pair them with the Bench2Drive DS reported in the same paper. We acknowledge that single-paper sourcing does not eliminate all configuration drift across benchmarks (e.g., backbone or training-data differences), and we discuss this confounder in §7.
为确保子指标相关性分析(表 4)的有效性,我们采用如下配置匹配策略。对第三方综述表中报告的方法(UniAD、Hydra-MDP、WoTE、Hydra-NeXt、SafeDrive、SparseDriveV2),采用 SparseDriveV2 [12]、SafeDrive [13] 与 Hydra-NeXt [10] 汇总的跨基准数字,这些来源已记录 NAVSIM 与 Bench2Drive 上一致的模型配置。对 VADv2 与 DriveSuprim,我们从各方法自己的论文提取 NAVSIM 子指标(VADv2 表 2、DriveSuprim 表 2 ViT-L 行),并与同一论文报告的 Bench2Drive DS 配对。我们承认,单篇论文来源并不能消除跨基准的全部配置漂移(例如骨干或训练数据差异),并在 §7 讨论这一混淆因素。
4.2. Paired Data Tables
4.2. 配对数据表
Traditional Open-Loop Metrics vs. Closed-Loop.
Table 1 presents the traditional L2 displacement error alongside Bench2Drive DS and SR for 7 methods, sourced from Hydra-NeXt [10].
传统开环指标与闭环。
表 1 给出 7 个方法的传统 L2 位移误差及 Bench2Drive DS、SR,数据来自 Hydra-NeXt [10]。
NAVSIM PDMS vs. Closed-Loop.
Table 2 presents the full cross-benchmark dataset for methods with both NAVSIM PDMS and Bench2Drive results. Table 3 extracts the subset with complete PDMS and DS data.
NAVSIM PDMS 与闭环。
表 2 给出同时有 NAVSIM PDMS 与 Bench2Drive 结果的完整跨基准数据。表 3 抽出其中 PDMS 与 DS 均完整的子集。
NAVSIM Sub-Metrics.
Table 4 presents the NAVSIM PDMS sub-metric breakdown alongside Bench2Drive DS for methods where both are available.
NAVSIM 子指标。
表 4 给出同时可得的 NAVSIM PDMS 子指标分解与 Bench2Drive DS。
| Method | PDMS | DS | SR |
|---|---|---|---|
| UniAD [14] | 83.4 | 45.81 | 16.36% |
| Hydra-MDP [11] | 86.5 | 59.95 | 29.82% |
| WoTE [25] | 88.3 | 61.71 | 31.36% |
| Hydra-NeXt [10] | 88.6 | 73.86 | 50.00% |
| VADv2† [24] | 89.3 | 76.15 | 50.46% |
| SafeDrive [13] | 91.6 | 66.77 | 42.40% |
| SparseDriveV2 [12] | 92.0 | 89.15 | 70.00% |
| DriveSuprim† [26] | 93.5 | 83.02 | 60.00% |
Table 3: Paired NAVSIM PDMS and Bench2Drive DS (). Ordered by PDMS. From the method’s own paper.
| 方法 | PDMS | DS | SR |
|---|---|---|---|
| UniAD [14] | 83.4 | 45.81 | 16.36% |
| Hydra-MDP [11] | 86.5 | 59.95 | 29.82% |
| WoTE [25] | 88.3 | 61.71 | 31.36% |
| Hydra-NeXt [10] | 88.6 | 73.86 | 50.00% |
| VADv2† [24] | 89.3 | 76.15 | 50.46% |
| SafeDrive [13] | 91.6 | 66.77 | 42.40% |
| SparseDriveV2 [12] | 92.0 | 89.15 | 70.00% |
| DriveSuprim† [26] | 93.5 | 83.02 | 60.00% |
表 3:配对的 NAVSIM PDMS 与 Bench2Drive DS()。按 PDMS 排序。 来自该方法自己的论文。
| Method | NAVSIM Sub-Metrics | PDMS | Bench2Drive | ||||
|---|---|---|---|---|---|---|---|
| NC | DAC | TTC | EP | DS | SR | ||
| UniAD [14] | 97.8 | 91.9 | 92.9 | 78.8 | 83.4 | 45.8 | 16.4% |
| Hydra-MDP [11] | 98.3 | 96.0 | 94.6 | 78.7 | 86.5 | 60.0 | 29.8% |
| WoTE [25] | 98.5 | 96.8 | 94.9 | 81.9 | 88.3 | 61.7 | 31.4% |
| Hydra-NeXt [10] | 98.1 | 97.7 | 94.6 | 81.8 | 88.6 | 73.9 | 50.0% |
| SafeDrive [13] | 99.5 | 99.0 | 97.2 | 84.3 | 91.6 | 66.8 | 42.4% |
| VADv2 [24] | 98.3 | 97.4 | 95.7 | 82.3 | 89.3 | 76.2 | 50.5% |
| DriveSuprim [26] | 98.6 | 98.6 | 95.5 | 91.3 | 93.5 | 83.0 | 60.0% |
| SparseDriveV2 [12] | 98.5 | 98.4 | 95.0 | 88.6 | 92.0 | 89.2 | 70.0% |
Table 4: NAVSIM sub-metrics and Bench2Drive DS. Comfort (C) omitted (all 99.9). Data sourced from the respective original publications. All 8 methods confirm consistent model configurations across both benchmarks.
| 方法 | NAVSIM 子指标 | PDMS | Bench2Drive | ||||
|---|---|---|---|---|---|---|---|
| NC | DAC | TTC | EP | DS | SR | ||
| UniAD [14] | 97.8 | 91.9 | 92.9 | 78.8 | 83.4 | 45.8 | 16.4% |
| Hydra-MDP [11] | 98.3 | 96.0 | 94.6 | 78.7 | 86.5 | 60.0 | 29.8% |
| WoTE [25] | 98.5 | 96.8 | 94.9 | 81.9 | 88.3 | 61.7 | 31.4% |
| Hydra-NeXt [10] | 98.1 | 97.7 | 94.6 | 81.8 | 88.6 | 73.9 | 50.0% |
| SafeDrive [13] | 99.5 | 99.0 | 97.2 | 84.3 | 91.6 | 66.8 | 42.4% |
| VADv2 [24] | 98.3 | 97.4 | 95.7 | 82.3 | 89.3 | 76.2 | 50.5% |
| DriveSuprim [26] | 98.6 | 98.6 | 95.5 | 91.3 | 93.5 | 83.0 | 60.0% |
| SparseDriveV2 [12] | 98.5 | 98.4 | 95.0 | 88.6 | 92.0 | 89.2 | 70.0% |
表 4:NAVSIM 子指标与 Bench2Drive DS。省略 Comfort(C)(全部 99.9)。数据来自各方法原始论文。全部 8 个方法均确认两个基准上模型配置一致。
5. Analysis
5. 分析
5.1. Traditional Metrics: ADE/FDE Still Do Not Predict Closed-Loop
5.1. 传统指标:ADE/FDE 仍无法预测闭环
We first confirm, with a broader set of recent methods, the finding of [5]: traditional displacement-based open-loop metrics do not predict closed-loop performance.
我们先用更广的一批近期方法确认 [5] 的发现:基于位移的传统开环指标不能预测闭环表现。
From Table 1 (CARLA v2 protocol; see §3.2 for the difference from the Bench2Drive protocol), UniAD achieves the lowest L2 error (0.73) among non-distillation methods, yet its DS (37.72) is the second-worst. Conversely, Hydra-NeXt has a higher L2 (0.92) but achieves the best DS (65.89). Computing the Spearman rank correlation between L2 and DS yields (), indicating no significant correlation. This confirms that traditional open-loop metrics remain unreliable proxies for closed-loop performance, even for newer architectures.
从表 1(CARLA v2 协议;与 Bench2Drive 协议的差异见 §3.2)可见:在非蒸馏方法中,UniAD 的 L2 误差最低(0.73),但其 DS(37.72)却是倒数第二。相反,Hydra-NeXt 的 L2 更高(0.92),却拿到最好的 DS(65.89)。计算 L2 与 DS 的 Spearman 秩相关得 (),表明无显著相关。这确认:即便对更新的架构,传统开环指标仍不可靠地充当闭环代理。
5.2. NAVSIM PDMS: Positive but Non-Monotonic Correlation
5.2. NAVSIM PDMS:正相关但非单调
In contrast to L2, the NAVSIM PDMS shows a substantially stronger relationship with Bench2Drive DS. From the eight paired data points in Table 3, we compute:
与 L2 不同,NAVSIM PDMS 与 Bench2Drive DS 的关系明显更强。对表 3 中的八个配对点,我们计算:
- • Spearman rank correlation: ()
- • Kendall’s : ()
- • Spearman 秩相关:()
- • Kendall :()
These values indicate a highly significant positive correlation, marking a substantial improvement over traditional metrics. However, the correlation is not perfectly monotonic: the PDMS ranking and DS ranking disagree on specific methods, as visualized in Figure 2.
这些数值表明高度显著的正相关,相对传统指标是实质改进。但相关并非完全单调:PDMS 排名与 DS 排名在具体方法上仍有分歧,如图 2 所示。
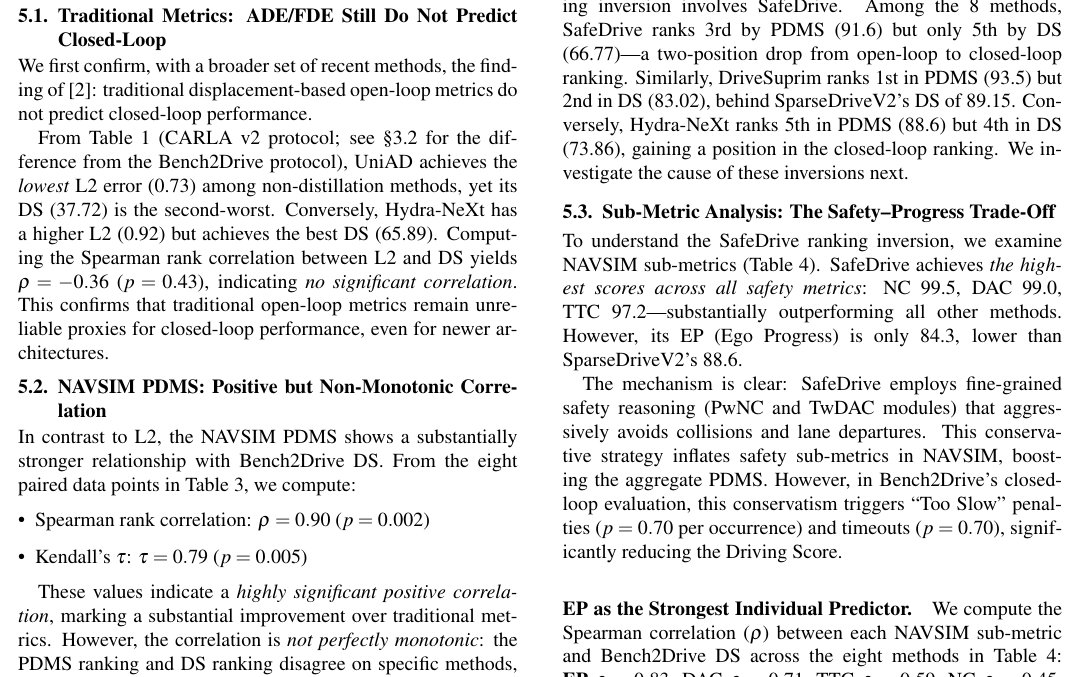
Figure 2: NAVSIM PDMS vs. Bench2Drive Driving Score (, Spearman , ). SafeDrive () is the primary outlier: it ranks 3rd in PDMS but drops to 5th in DS, due to the safety–progress trade-off analyzed in §5.3.
图 2:NAVSIM PDMS 与 Bench2Drive Driving Score(,Spearman ,)。SafeDrive()是主要离群点:PDMS 排第 3,DS 却落到第 5,原因是 §5.3 分析的安全—进度权衡。
Ranking Inversion: SafeDrive.
The most prominent ranking inversion involves SafeDrive. Among the 8 methods, SafeDrive ranks 3rd by PDMS (91.6) but only 5th by DS (66.77)—a two-position drop from open-loop to closed-loop ranking. Similarly, DriveSuprim ranks 1st in PDMS (93.5) but 2nd in DS (83.02), behind SparseDriveV2’s DS of 89.15. Conversely, Hydra-NeXt ranks 5th in PDMS (88.6) but 4th in DS (73.86), gaining a position in the closed-loop ranking. We investigate the cause of these inversions next.
名次翻转:SafeDrive。
最突出的名次翻转来自 SafeDrive。在 8 个方法中,SafeDrive 按 PDMS 排第 3(91.6),按 DS 仅排第 5(66.77)——从开环到闭环下跌两个名次。类似地,DriveSuprim 在 PDMS 排第 1(93.5),在 DS 却排第 2(83.02),落后于 SparseDriveV2 的 89.15。相反,Hydra-NeXt 在 PDMS 排第 5(88.6),在 DS 升至第 4(73.86)。我们接下来考察这些翻转的原因。
5.3. Sub-Metric Analysis: The Safety–Progress Trade-Off
5.3. 子指标分析:安全—进度权衡
To understand the SafeDrive ranking inversion, we examine NAVSIM sub-metrics (Table 4). SafeDrive achieves the highest scores across all safety metrics: NC 99.5, DAC 99.0, TTC 97.2—substantially outperforming all other methods. However, its EP (Ego Progress) is only 84.3, lower than SparseDriveV2’s 88.6.
为理解 SafeDrive 的名次翻转,我们查看 NAVSIM 子指标(表 4)。SafeDrive 在全部安全指标上得分最高:NC 99.5、DAC 99.0、TTC 97.2——明显优于其他方法。但其 EP(自车进度)仅 84.3,低于 SparseDriveV2 的 88.6。
The mechanism is clear: SafeDrive employs fine-grained safety reasoning (PwNC and TwDAC modules) that aggressively avoids collisions and lane departures. This conservative strategy inflates safety sub-metrics in NAVSIM, boosting the aggregate PDMS. However, in Bench2Drive’s closed-loop evaluation, this conservatism triggers “Too Slow” penalties ( per occurrence) and timeouts (), significantly reducing the Driving Score.
机制很清楚:SafeDrive 采用细粒度安全推理(PwNC 与 TwDAC 模块),积极规避碰撞与驶离车道。这种保守策略抬高了 NAVSIM 的安全子指标,从而推高汇总 PDMS。但在 Bench2Drive 的闭环评测中,这种保守会触发“过慢”惩罚(每次 )与超时(),显著拉低 Driving Score。
EP as the Strongest Individual Predictor.
We compute the Spearman correlation () between each NAVSIM sub-metric and Bench2Drive DS across the eight methods in Table 4: EP , DAC , TTC , NC . Figure 3 visualizes the EP–DS relationship.
EP 作为最强的单个预测因子。
我们对表 4 中八个方法,计算各 NAVSIM 子指标与 Bench2Drive DS 的 Spearman 相关():EP ,DAC ,TTC ,NC 。图 3 可视化 EP–DS 关系。
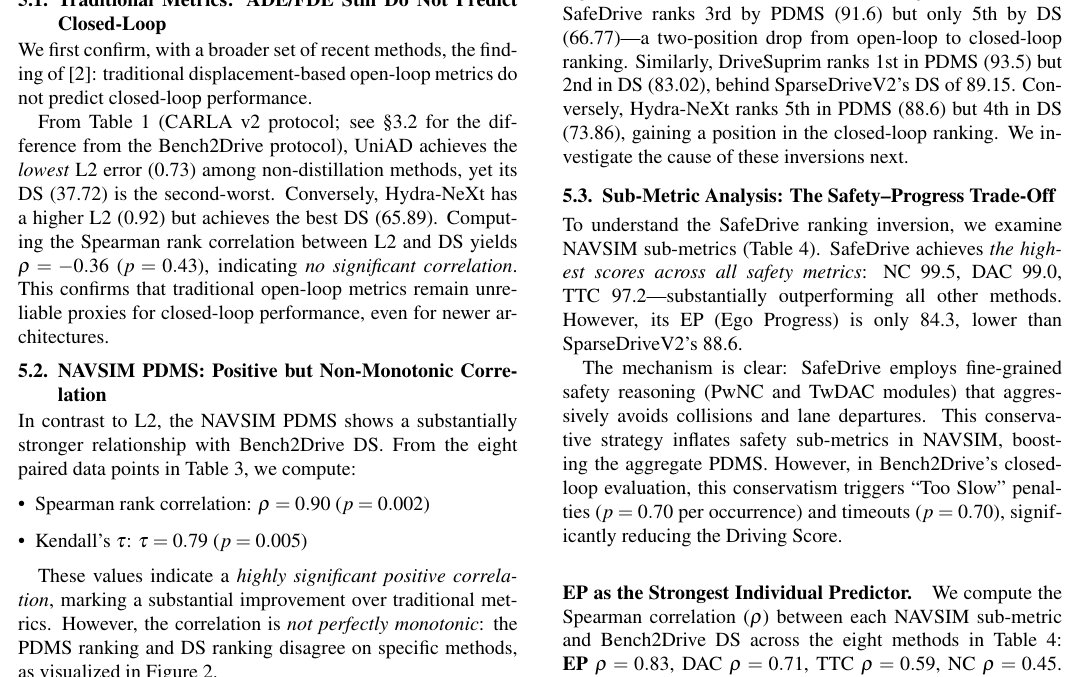
Figure 3: Ego Progress (EP) vs. Bench2Drive Driving Score for the methods with complete sub-metric data (Spearman ). All methods confirm consistent model configurations across both benchmarks. EP exhibits the strongest correlation among individual sub-metrics.
图 3:自车进度(EP)与 Bench2Drive Driving Score,覆盖有完整子指标数据的 个方法(Spearman )。全部方法均确认两基准模型配置一致。EP 在单个子指标中相关最强。
EP exhibits the highest correlation among individual sub-metrics, although it is slightly below the aggregate PDMS (, Figure 1c). Remarkably, NC—the most safety-critical metric—shows only a weak-to-moderate correlation () with closed-loop DS, well below EP. While extreme safety optimization helps (e.g., DriveSuprim achieves NC=98.6 and SafeDrive NC=99.5), marginal NC gains beyond 98.0 suffer from a ceiling effect and do not guarantee closed-loop success as consistently as Ego Progress does. The fact that EP alone (one sub-metric) achieves while PDMS (five sub-metrics) achieves raises a natural question: which of the five sub-metrics actually contribute predictive value? We address this in §6.
EP 在单个子指标中相关最高,虽略低于汇总 PDMS(,图 1c)。值得注意的是,最关键的安全指标 NC 与闭环 DS 仅呈弱到中等相关(),远低于 EP。极端安全优化仍有帮助(如 DriveSuprim NC=98.6、SafeDrive NC=99.5),但 NC 超过 98.0 后的边际收益受天花板效应限制,不如自车进度那样稳定地对应闭环成功。单独 EP(一个子指标)就能达到 ,而 PDMS(五个子指标)为 ,自然引出问题:*五个子指标里究竟哪些真正贡献预测价值?*我们在 §6 回答。
Interpretation.
The safety–progress trade-off operates asymmetrically across the two evaluation paradigms:
解读。
安全—进度权衡在两种评测范式中作用不对称:
- • In NAVSIM (open-loop): Safety metrics (NC, DAC, TTC) act as multiplicative gates. Maximizing them dramatically boosts PDMS because even small improvements (e.g., NC from 98.3 to 99.5) eliminate penalty cases. EP, despite being a weighted-average term, has limited leverage on the aggregate score.
- • In Bench2Drive (closed-loop): Safety is a necessary condition (collisions are penalized), but route completion is the dominant factor in DS. Overly conservative driving incurs explicit penalties (Too Slow: 0.70, Timeout: 0.70, Agent Blocked: route termination). EP, which directly reflects the vehicle’s willingness to make progress, becomes the critical differentiator.
- • 在 NAVSIM(开环)中:安全指标(NC、DAC、TTC)充当乘性门控。最大化它们会显著推高 PDMS,因为即便小幅改进(例如 NC 从 98.3 到 99.5)也能消除惩罚案例。EP 虽是加权平均项,对汇总分数的杠杆有限。
- • 在 Bench2Drive(闭环)中:安全是必要条件(碰撞会被惩罚),但路线完成才是 DS 的主导因素。过度保守会招致明确惩罚(过慢:0.70,超时:0.70,智能体阻塞:路线终止)。直接反映车辆推进意愿的 EP,成为关键区分因素。
This asymmetry explains why methods optimized for NAVSIM safety metrics (like SafeDrive) can rank highly in open-loop yet underperform in closed-loop.
这种不对称解释了为何为 NAVSIM 安全指标优化的方法(如 SafeDrive)能在开环排名靠前,却在闭环中落后。
6. Toward Better Open-Loop Prediction of Closed-Loop Performance
6. 更好地用开环预测闭环表现
6.1. A Simpler Equivalent Form: CL-Proxy
6.1. 更简单的等价形式:CL-Proxy
The aggregate PDMS achieves a strong rank correlation with closed-loop DS (), but its formula (Eq. 1) combines five sub-metrics through a multi-stage gate-and-weighted-average pipeline. We ask: is all this machinery necessary? Concretely, we investigate whether a simpler aggregation of fewer sub-metrics can recover the same predictive power.
汇总 PDMS 与闭环 DS 的秩相关很强(),但其公式(式 1)经多级门控与加权平均把五个子指标合在一起。我们追问:*这些机制是否都必要?*具体地说,更少子指标的更简单汇总,能否恢复同样的预测能力。
Motivation.
Our sub-metric correlation analysis (§5.3) revealed two facts that question the design of PDMS:
动机。
子指标相关性分析(§5.3)揭示两点,对 PDMS 的设计提出疑问:
- TTC shows only moderate correlation with DS (), yet is given the same weight as EP in the PDMS weighted average ().
- Comfort (C) is saturated (%) across all eight methods and thus contributes essentially zero discriminative information to the ranking.
- TTC 与 DS 仅中等相关(),却在 PDMS 加权平均中与 EP 同权()。
- Comfort(C)在全部八个方法上已饱和(),对排名几乎不提供区分信息。
If TTC and C are non-predictive, removing them should not degrade the rank correlation. We test this hypothesis with a deliberately minimal formula.
若 TTC 与 C 无预测力,去掉它们不应降低秩相关。我们用刻意极简的公式检验这一假设。
Proposed CL-Proxy Score.
We define the Closed-Loop Proxy Score (CL-Proxy) as the simplest multiplicative combination of the three remaining sub-metrics:
提出的 CL-Proxy 分数。
我们把闭环代理分数(CL-Proxy)定义为其余三个子指标最简单的乘性组合:
This preserves PDMS’s multiplicative gate structure (NC and DAC penalize collisions and lane departures), but replaces the weighted average with EP alone. The formula uses 3 sub-metrics instead of 5, has no tunable weights, and no normalization constant. We note the rank correlation is highly robust to functional choice: alternative simplifications such as , , and even the linear all yield identical on our data.
这保留了 PDMS 的乘性门控结构(NC 与 DAC 惩罚碰撞与驶离车道),但用单独的 EP 取代加权平均 。公式只用 3 个子指标而非 5 个,无可调权重,也无归一化常数。我们注意到秩相关对函数形式高度稳健:诸如 、、乃至线性 等替代简化,在我们的 数据上都得到相同的 。
Evaluation.
Table 5 compares the ranking accuracy of PDMS, EP alone, and CL-Proxy against actual Bench2Drive DS rankings for the 8 paired methods.
评估。
表 5 比较 PDMS、单独 EP 与 CL-Proxy 相对 8 个配对方法实际 Bench2Drive DS 排名的预测准确度。
| Predictor | #sm | Spearman | Inv. |
|---|---|---|---|
| PDMS (aggregate) | 5 | 0.90 | 3 |
| EP only | 1 | 0.83 | 5 |
| CL-Proxy (Eq. 5) | 3 | 0.90 | 3 |
Table 5: Ranking prediction accuracy of different open-loop predictors against Bench2Drive DS (). CL-Proxy uses 3 of PDMS’s 5 sub-metrics yet matches the full aggregate. “#sm” = number of sub-metrics; “Inv.” = pairwise rank inversions.
| 预测器 | #sm | Spearman | Inv. |
|---|---|---|---|
| PDMS(汇总) | 5 | 0.90 | 3 |
| 仅 EP | 1 | 0.83 | 5 |
| CL-Proxy(式 5) | 3 | 0.90 | 3 |
表 5:不同开环预测器相对 Bench2Drive DS 的排名预测准确度()。CL-Proxy 只用 PDMS 五个子指标中的三个,却匹配完整汇总。“#sm” = 子指标数;“Inv.” = 成对名次翻转数。
CL-Proxy matches the full PDMS exactly in both Spearman and number of pairwise ranking inversions, despite using only 60% of the sub-metrics and a substantially simpler functional form. On this dataset, TTC and Comfort add little marginal information beyond NC, DAC, and EP for closed-loop ranking. We do not claim TTC and Comfort are intrinsically uninformative: rather, among the current generation of top methods (Table 4), TTC ranges narrowly from 92.9 to 97.2 and Comfort is essentially saturated (), so neither has enough variance to discriminate methods. As future planners diverge in collision-avoidance margin or comfort behavior, the marginal value of TTC and C may grow, and CL-Proxy’s equivalence to PDMS should be re-tested. EP alone, by contrast, falls short of PDMS even on our data ( vs. ): the NC and DAC penalty gates remain useful for separating safety-violating outliers.
CL-Proxy 在 Spearman 与成对名次翻转数上与完整 PDMS 完全一致,尽管只用了 60% 的子指标,函数形式也简单得多。在本数据集上,TTC 与 Comfort 在 NC、DAC、EP 之外,对闭环排名几乎不提供边际信息。我们并不主张 TTC 与 Comfort 本身无信息:而是在当前一代顶尖方法中(表 4),TTC 仅在 92.9 到 97.2 的窄区间变化,Comfort 基本饱和(),二者都没有足够方差来区分方法。随着未来规划器在避撞余量或舒适行为上分化,TTC 与 C 的边际价值可能上升,CL-Proxy 与 PDMS 的等价性也应重新检验。相比之下,单独 EP 即便在我们的数据上也达不到 PDMS( 对 ):NC 与 DAC 惩罚门控对分离安全违规离群点仍然有用。
We also observed that no simple monotonic combination of the four sub-metrics (NC, DAC, TTC, EP)—whether linear, multiplicative, or power-law—exceeds on our paired data. The bottleneck is structural: SafeDrive simultaneously achieves the top rank in NC, DAC, and TTC yet ranks only 5th in DS, an inversion that no aggregation of these sub-metrics can repair. CL-Proxy is therefore not just a simplification but, on this dataset, an optimal simple aggregator within the family of monotonic sub-metric combinations.
我们还观察到:四个子指标(NC、DAC、TTC、EP)的任何简单单调组合——无论线性、乘性还是幂律——在配对数据上都无法超过 。瓶颈是结构性的:SafeDrive 同时在 NC、DAC、TTC 上拿到最高分,却在 DS 只排第 5,这种翻转无法靠这些子指标的任何汇总修复。因此,在本数据集上,CL-Proxy 不仅是简化,也是单调子指标组合族中的最优简单汇总器。
From a practical standpoint, CL-Proxy retains PDMS’s interpretable gate structure and can serve as a transparent, lightweight diagnostic alongside the official PDMS—particularly useful when sub-metric breakdowns are reported but the full PDMS is not.
从实践角度看,CL-Proxy 保留了 PDMS 可解释的门控结构,可作为官方 PDMS 旁透明、轻量的诊断——尤其在报告了子指标分解却未给出完整 PDMS 时有用。
6.2. Proposed Guidelines for Open-Loop Benchmark Design
6.2. 开环基准设计的建议原则
Based on our analysis, we propose the following guidelines:
基于分析,我们提出如下原则:
- Report sub-metrics, not just aggregates. The aggregate PDMS/EPDMS hides critical information about the safety–progress trade-off. Leaderboards should prominently display individual sub-metrics.
- Prefer simpler aggregations when possible. Our CL-Proxy result shows that on paired methods, 3 of the 5 PDMS sub-metrics suffice to recover the full aggregate’s rank correlation with closed-loop DS. TTC and Comfort exhibit narrow inter-method variance among current top planners (TTC spans 4.3 points, Comfort is saturated near 100%) and therefore add little discriminative value in the present sample. This argues for distinguishing diagnostic sub-metrics (kept for fault analysis) from ranking sub-metrics, and for periodically re-validating which is which as the leaderboard evolves.
- Introduce a slow-driving penalty. Unlike Bench2Drive, which penalizes overly conservative driving via the “Too Slow” infraction, NAVSIM lacks an equivalent penalty. Adding such a penalty would better align open-loop evaluation with closed-loop outcomes, addressing the safety–progress trade-off at the source.
- Calibrate with paired data. As more methods report both benchmarks, periodic re-calibration of the open-to-closed-loop mapping becomes possible and should be standard practice.
- 报告子指标,而不只是汇总。 汇总 PDMS/EPDMS 会掩盖安全—进度权衡的关键信息。排行榜应突出展示各子指标。
- 尽可能偏好更简单的汇总。 我们的 CL-Proxy 结果表明:在 个配对方法上,PDMS 五个子指标中的三个就足以恢复完整汇总与闭环 DS 的秩相关。当前顶尖规划器中 TTC 与 Comfort 的方法间方差很窄(TTC 跨度 4.3 分,Comfort 饱和在近 100%),因此在本样本中区分力有限。这主张区分诊断子指标(保留用于故障分析)与排名子指标,并随排行榜演化定期重新验证何者属于何者。
- 引入慢速惩罚。 Bench2Drive 通过“过慢”违规惩罚过度保守驾驶,NAVSIM 没有等价惩罚。加入此类惩罚能更好对齐开环评测与闭环结果,从源头缓解安全—进度权衡。
- 用配对数据校准。 随着更多方法同时报告两个基准,定期重新校准开环到闭环的映射成为可能,并应成为标准做法。
7. Discussion
7. 讨论
The Snowball Effect: Why Small Open-Loop Deviations Compound.
A candidate mechanism for the residual open-to-closed-loop gap is what we term the snowball effect: small trajectory deviations that are inconsequential in NAVSIM’s 4-second open-loop evaluation can cascade into significant failures over multi-minute closed-loop routes. For example, a planner that drives “slightly slow” for 4 seconds may receive only a minor EP penalty in NAVSIM (2% reduction). However, in Bench2Drive’s closed-loop evaluation, the same tendency compounds: the vehicle misses a green light phase waits through a full red cycle falls behind schedule triggers “Too Slow” penalties () eventually times out (), resulting in a DS near zero for that route. This exponential amplification of small biases is a plausible reason why EP—which directly measures progress tendency—tracks closed-loop DS more closely than safety metrics like NC, which capture only instantaneous collision avoidance.
滚雪球效应:为何开环小偏差会放大。
解释残差开环—闭环差距的一个候选机制,是我们所谓的滚雪球效应:在 NAVSIM 的 4 秒开环评测中无关紧要的小轨迹偏差,可能在数分钟的闭环路线上级联为重大失败。例如,规划器“略慢”行驶 4 秒,在 NAVSIM 中可能只得到轻微 EP 惩罚(约 2% 下降)。但在 Bench2Drive 闭环中,同一倾向会累积:车辆错过绿灯相位 → 等完整红灯周期 → 落后于日程 → 触发“过慢”惩罚()→ 最终超时(),该路线 DS 接近零。这种小偏差的指数放大,是 EP——直接衡量推进倾向——比 NC 等仅捕捉瞬时避撞的安全指标更紧密跟踪闭环 DS 的一个合理解释。
The snowball effect is also consistent with the PDMS–DS correlation, while strong (), not being perfect: NAVSIM’s single-step evaluation cannot capture the temporal compounding that dominates closed-loop outcomes.
滚雪球效应也与 PDMS–DS 相关虽强()却不完美相一致:NAVSIM 的单步评测无法捕捉主导闭环结果的时间累积。
The Reactivity Gap.
NAVSIM evaluates trajectories against recorded agent behaviors: other vehicles follow their logged trajectories regardless of what the ego vehicle does. In contrast, Bench2Drive simulates reactive agents that adjust their behavior in response to the ego’s actions. This asymmetry has two consequences:
反应性差距。
NAVSIM 对照已记录的智能体行为评估轨迹:不论自车做什么,其他车辆都跟随日志轨迹。相反,Bench2Drive 仿真反应式智能体,会根据自车动作调整行为。这种不对称有两重后果:
- • Aggressive maneuvers are under-penalized in open-loop. A lane change that narrowly cuts in front of another vehicle may appear safe in NAVSIM (the other vehicle maintains its recorded trajectory), but in Bench2Drive the cut-off vehicle may brake suddenly or swerve, creating new collision scenarios.
- • Defensive driving is over-rewarded in open-loop. Methods like SafeDrive that avoid all proximity to other agents receive high NC and TTC scores in NAVSIM, but in closed-loop the same conservatism prevents the ego from navigating through gaps in traffic, leading to deadlocks.
- • 激进机动在开环中被低估惩罚。 紧贴前车切入的变道在 NAVSIM 中可能看似安全(对方保持记录轨迹),但在 Bench2Drive 中被切入车辆可能急刹或急转,产生新的碰撞场景。
- • 防守驾驶在开环中被过度奖励。 像 SafeDrive 这类回避与其他智能体一切接近的方法,在 NAVSIM 拿到高 NC 与 TTC,但在闭环中同样的保守会阻止自车穿过车流空隙,导致死锁。
This reactivity gap is structurally irreducible within any open-loop framework—it can only be mitigated, not eliminated, by better metric design.
这种反应性差距在任何开环框架内都是结构性不可消的——只能通过更好的指标设计缓解,无法消除。
Confounders in Cross-Architecture Comparisons.
An important caveat is that the 8 paired methods differ not only in their planning algorithms but also in backbone architectures (ResNet-34 vs. ResNet-50 vs. ViT-L), sensor modalities (camera-only vs. camera+LiDAR), and training data configurations. As Waymo [8] demonstrated, within a single architecture family, open-loop loss and closed-loop failure rates follow a power-law relationship—but this relationship breaks down across architectures. Our is therefore a cross-architecture correlation, not an estimate of the within-architecture metric–DS relationship; the two need not coincide and could differ in either direction. Methods like RAP [27] and LEAD [28], which report both benchmarks but with different model configurations (e.g., different backbones or sensor setups for NAVSIM vs. Bench2Drive), were excluded from our paired dataset to avoid mixing such configuration drift into the correlation.
跨架构比较中的混淆因素。
一个重要提醒是:8 个配对方法不仅规划算法不同,骨干架构(ResNet-34 vs. ResNet-50 vs. ViT-L)、传感器模态(仅相机 vs. 相机+LiDAR)与训练数据配置也不同。正如 Waymo [8] 所示,在同一架构族内,开环损失与闭环失败率服从幂律——但跨架构即失效。因此我们的 是跨架构相关,不是架构内指标–DS 关系的估计;两者不必一致,方向也可能相反。像 RAP [27]、LEAD [28] 这类虽报告两个基准、但模型配置不同的方法(例如 NAVSIM 与 Bench2Drive 用不同骨干或传感器),已从配对数据集中排除,以免把配置漂移混入相关。
Limitations.
Our analysis has several limitations:
局限。
我们的分析有若干局限:
- Sample size. The paired dataset contains 8 methods with complete PDMS–DS data and sub-metric breakdowns. While the correlations are statistically significant (), larger paired datasets would strengthen confidence. We expect this dataset to grow as more methods adopt both benchmarks.
- Bench2Drive variance. Closed-loop evaluation on CARLA exhibits run-to-run variance (5 DS for the same model with different seeds). The DS values we use are from published (typically single-run) evaluations, potentially introducing noise.
- NAVSIM v1 vs. v2. Some methods report PDMS (v1) while others report EPDMS (v2). We use PDMS where available as it is reported by more methods, but the transition to EPDMS introduces systematic differences in sub-metric composition.
- No causal analysis. Our study is purely correlational. We do not claim that improving EP causes higher DS; rather, both may reflect an underlying capability (e.g., accurate speed planning) that manifests in both benchmarks.
- 样本量。 配对数据集含 8 个有完整 PDMS–DS 数据与子指标分解的方法。尽管相关统计显著(),更大的配对集会增强信心。我们预期随着更多方法采用两个基准,该数据集会增长。
- Bench2Drive 方差。 CARLA 上的闭环评测存在运行间方差(同一模型不同种子约 5 DS)。我们使用的 DS 来自已发表(通常单次)评测,可能引入噪声。
- NAVSIM v1 与 v2。 部分方法报告 PDMS(v1),部分报告 EPDMS(v2)。我们在可得时使用 PDMS,因为它被更多方法报告,但向 EPDMS 的过渡会带来子指标构成上的系统差异。
- 无因果分析。 本研究纯属相关分析。我们并不主张提升 EP 导致更高 DS;两者可能共同反映某种底层能力(例如准确的速度规划),并在两个基准上显现。
Connection to Waymo Scaling Laws.
The Waymo team [8] demonstrated that within a single architecture family, open-loop loss and closed-loop failures follow a power law: . Our finding is complementary: we show that across architectures, the correlation exists at the sub-metric level (especially EP) but is obscured when compressed into a single aggregate score. The combination of these findings suggests a two-level approach: use scaling laws within an architecture, and sub-metric regression across architectures.
与 Waymo 缩放律的联系。
Waymo 团队 [8] 表明,在同一架构族内,开环损失与闭环失败服从幂律:。我们的发现是互补的:我们表明跨架构时,相关存在于子指标层面(尤其是 EP),但被压缩进单一汇总分数后会被掩盖。两者结合提示双层路径:在架构内用缩放律,跨架构用子指标回归。
Broader Impact.
Reliable open-loop evaluation of autonomous driving systems could meaningfully accelerate development cycles. However, over-reliance on any proxy metric carries risks: if the community optimizes for an imperfect open-loop proxy, it may develop systems that “game” the proxy without genuine closed-loop improvement. Our sub-metric-level analysis provides a more transparent framework that is harder to game than a single scalar score.
更广影响。
可靠的开环评测可实质加速自动驾驶研发周期。但对任何代理指标的过度依赖都有风险:若社区优化一个不完美的开环代理,可能开发出“刷分”代理却无真实闭环改进的系统。我们的子指标级分析提供更透明的框架,比单一标量分数更难被刷分。
8. Conclusion
8. 结论
We present the first systematic cross-benchmark correlation study between NAVSIM open-loop metrics and Bench2Drive closed-loop performance, based on 8 paired methods. Our key findings are:
我们基于 8 个配对方法,给出 NAVSIM 开环指标与 Bench2Drive 闭环表现的首次系统跨基准相关性研究。主要发现如下:
- Traditional open-loop metrics (ADE/FDE) remain uncorrelated with closed-loop driving quality (, ), confirming prior work with newer methods.
- NAVSIM’s safety-aware PDMS shows strong positive correlation with Bench2Drive DS (, ), but with non-monotonic ranking inversions driven by the safety–progress trade-off.
- Among individual sub-metrics, Ego Progress (EP) is the strongest single predictor of closed-loop DS (), while the collision metric NC shows only weak-to-moderate correlation () due to ceiling effects despite extreme safety optimization.
- The snowball effect—where small open-loop deviations compound into closed-loop failures via missed traffic signals, timeouts, and blocking—is a candidate mechanism consistent with EP being a stronger predictor than the safety-only sub-metrics (NC, DAC, TTC), although our correlational analysis does not establish this causally.
- A simplified CL-Proxy score using only NC, DAC, and EP matches the rank correlation of the full 5-sub-metric PDMS (, 3 inversions) on our paired data, suggesting that TTC and Comfort add little marginal ranking information among current top methods—a finding that should be re-validated as the leaderboard diversifies.
- 传统开环指标(ADE/FDE)仍与闭环驾驶质量无关(,),用更新方法确认了已有工作。
- NAVSIM 的安全感知 PDMS 与 Bench2Drive DS 呈强正相关(,),但仍有由安全—进度权衡驱动的非单调名次翻转。
- 在各子指标中,自车进度(EP)是闭环 DS 的最强单一预测因子(),而碰撞指标 NC 因天花板效应仅呈弱到中等相关(),即便极端安全优化亦然。
- 滚雪球效应——开环小偏差经错过信号灯、超时与阻塞在闭环中放大——是与 EP 强于纯安全子指标(NC、DAC、TTC)相一致的候选机制,尽管相关分析并不能建立因果。
- 仅用 NC、DAC、EP 的简化 CL-Proxy 分数,在我们的 配对数据上达到与完整五子指标 PDMS 相同的秩相关(,3 次翻转),提示 TTC 与 Comfort 对当前顶尖方法几乎不提供边际排名信息——这一发现应随排行榜多样化而重新验证。
These findings argue strongly for sub-metric-level analysis in open-loop evaluation, and for explicit calibration between open-loop and closed-loop benchmarks. As the paired dataset grows with future publications, we expect the open-to-closed-loop mapping to become increasingly reliable.
这些发现强烈主张在开环评测中做子指标级分析,并在开环与闭环基准之间做显式校准。随着未来论文扩充配对数据集,我们预期开环到闭环的映射会越来越可靠。
References
参考文献
[1] A. Dosovitskiy, G. Ros, F. Codevilla, A. Lopez, and V. Koltun (2017) CARLA: an open urban driving simulator . In Conference on Robot Learning (CoRL) , Cited by: §1 , §2 .
[2] D. Dauner, M. Hallgarten, A. Geiger, and K. Chitta (2023) Parting with misconceptions about learning-based vehicle motion planning . In Conference on Robot Learning (CoRL) , Note: arXiv:2306.07962 Cited by: §1 , §2 , §5.1 .
[3] Z. Li, Z. Yu, S. Lan, et al. (2024) Is ego status all you need for open-loop end-to-end autonomous driving? . In IEEE/CVF Conference on Computer Vision and Pattern Recognition (CVPR) , Cited by: §1 , §2 .
[4] D. Dauner, M. Hallgarten, T. Li, X. Weng, Z. Huang, Z. Yang, H. Li, I. Gilitschenski, B. Ivanovic, M. Pavone, et al. (2024) NAVSIM: data-driven non-reactive autonomous vehicle simulation and benchmarking . In Advances in Neural Information Processing Systems (NeurIPS) , Vol. 37 . Cited by: §1 , §2 .
[5] X. Jia, Z. Yang, Q. Li, Z. Zhang, and J. Yan (2024) Bench2Drive: towards multi-ability benchmarking of closed-loop end-to-end autonomous driving . In Advances in Neural Information Processing Systems (NeurIPS) , Vol. 37 . Note: arXiv:2406.03877 Cited by: §1 , §2 , §3.2 .
[6] H. Caesar, V. Bankiti, A. H. Lang, S. Vora, V. E. Liong, Q. Xu, et al. (2020) nuScenes: a multimodal dataset for autonomous driving . In IEEE/CVF Conference on Computer Vision and Pattern Recognition (CVPR) , Cited by: §2 .
[7] B. Wilson, W. Qi, T. Aber, et al. (2023) Argoverse 2: next generation datasets for self-driving perception and forecasting . In Advances in Neural Information Processing Systems (NeurIPS) , Cited by: §2 .
[8] N. Karnchanachari et al. (2024) Towards learning-based planning: the nuPlan benchmark for real-world autonomous driving . In IEEE International Conference on Robotics and Automation (ICRA) , Cited by: §2 .
[9] X. Jia et al. (2026) Bench2Drive-VL: closed-loop VLM evaluation for autonomous driving . arXiv preprint arXiv:2604.01259 . Cited by: §2 .
[10] M. Baniodeh, K. Goel, S. Ettinger, C. Fuertes, A. Seff, T. Shen, C. Gulino, C. Yang, G. Jerfel, S. Casas, et al. (2025) Scaling laws of motion forecasting and planning – technical report . arXiv preprint arXiv:2506.08228 . Cited by: §2 , §7 , §7 .
[11] Y. Hu, J. Yang, L. Chen, K. Li, C. Sima, X. Zhu, et al. (2023) Planning-oriented autonomous driving . In IEEE/CVF Conference on Computer Vision and Pattern Recognition (CVPR) , Cited by: §2 , Table 1 , Table 2 , Table 3 , Table 4 .
[12] Z. Li, K. Li, S. Wang, S. Lan, Z. Yu, Y. Ji, Z. Li, Z. Zhu, J. Kautz, et al. (2024) Hydra-MDP: end-to-end multimodal planning with multi-target hydra-distillation . arXiv preprint arXiv:2406.06978 . Cited by: §2 , Table 1 , Table 2 , Table 3 , Table 4 .
[13] B. Liao, S. Chen, H. Yin, B. Jiang, et al. (2025) DiffusionDrive: truncated diffusion model for end-to-end autonomous driving . In IEEE/CVF Conference on Computer Vision and Pattern Recognition (CVPR) , Cited by: §2 .
[14] Z. Li, S. Wang, S. Lan, Z. Yu, Z. Wu, and J. M. Alvarez (2025) Hydra-NeXt: robust closed-loop driving with open-loop training . arXiv preprint arXiv:2503.12030 . Cited by: §2 , §3.2 , 1st item , 3rd item , §4.1 , §4.2 , Table 1 , Table 1 , Table 1 , Table 2 , Table 3 , Table 4 .
[15] Z. Xing, X. Zhang, Y. Hu, B. Jiang, et al. (2025) GoalFlow: goal-driven flow matching for multimodal trajectories generation in end-to-end autonomous driving . In IEEE/CVF Conference on Computer Vision and Pattern Recognition (CVPR) , Cited by: §2 .
[16] W. Sun, X. Lin, K. Chen, Z. Pei, X. Li, Y. Shi, and S. Zheng (2026) SparseDriveV2: scoring is all you need for end-to-end autonomous driving . arXiv preprint arXiv:2603.29163 . Cited by: §2 , 1st item , §4.1 , Table 2 , Table 2 , Table 2 , Table 3 , Table 4 .
[17] J. Kim, J. Oh, S. Yu, H. Shin, D. Kwak, and J. W. Choi (2026) SafeDrive: fine-grained safety reasoning for end-to-end driving in a sparse world . arXiv preprint arXiv:2602.18887 . Note: CVPR 2026 Cited by: §2 , 1st item , §4.1 , Table 2 , Table 2 , Table 2 , Table 3 , Table 4 .
[18] X. Jia, J. You, Z. Zhang, and J. Yan (2025) DriveTransformer: unified transformer for scalable end-to-end autonomous driving . In International Conference on Learning Representations (ICLR) , Note: arXiv:2503.07656 Cited by: §2 , Table 2 .
[19] B. Jiang, S. Chen, H. Gao, B. Liao, Q. Zhang, W. Liu, and X. Wang (2026) VADv2: end-to-end vectorized autonomous driving via probabilistic planning . In International Conference on Learning Representations (ICLR) , Note: arXiv:2402.13243 Cited by: §2 , 2nd item , Table 2 , Table 2 , Table 2 , Table 3 , Table 4 .
[20] Y. Li, Y. Wang, Y. Liu, J. He, L. Fan, and Z. Zhang (2025) End-to-end driving with online trajectory evaluation via BEV world model . arXiv preprint arXiv:2504.01941 . Cited by: §2 , 1st item , Table 2 , Table 3 , Table 4 .
[21] W. Yao, Z. Li, S. Lan, Z. Wang, X. Sun, J. M. Alvarez, and Z. Wu (2025) DriveSuprim: towards precise trajectory selection for end-to-end planning . arXiv preprint arXiv:2506.06659 . Note: AAAI 2026 Cited by: §2 , 2nd item , Table 2 , Table 2 , Table 2 , Table 3 , Table 4 .
[22] P. Wu, X. Jia, L. Chen, J. Yan, H. Li, and Y. Qiao (2022) Trajectory-guided control prediction for end-to-end autonomous driving: a simple yet strong baseline . In Advances in Neural Information Processing Systems (NeurIPS) , Vol. 35 . Cited by: Table 1 .
[23] B. Jiang, S. Chen, Q. Xu, B. Liao, J. Chen, H. Zhou, Q. Zhang, W. Liu, C. Huang, and X. Wang (2023) VAD: vectorized scene representation for efficient autonomous driving . In IEEE/CVF International Conference on Computer Vision (ICCV) , Cited by: Table 1 , Table 2 .
[24] X. Jia, P. Wu, L. Chen, J. Xie, C. He, J. Yan, and H. Li (2023) Think Twice before Driving: towards scalable decoders for end-to-end autonomous driving . In IEEE/CVF Conference on Computer Vision and Pattern Recognition (CVPR) , Cited by: Table 1 .
[25] X. Jia, P. Wu, L. Chen, Y. Liu, H. Li, and J. Yan (2023) DriveAdapter: breaking the coupling barrier of perception and planning in end-to-end autonomous driving . In IEEE/CVF International Conference on Computer Vision (ICCV) , Cited by: Table 1 .
[26] B. Zhang, N. Song, X. Jin, and L. Zhang (2025) Bridging past and future: end-to-end autonomous driving with historical prediction and planning . In IEEE/CVF Conference on Computer Vision and Pattern Recognition (CVPR) , Note: arXiv:2503.14182 Cited by: Table 2 .
[27] S. Shang, Y. Chen, Y. Wang, Y. Li, and Z. Zhang (2025) DriveDPO: policy learning via safety DPO for end-to-end autonomous driving . In Advances in Neural Information Processing Systems (NeurIPS) , Note: arXiv:2509.17940 Cited by: Table 2 .
[28] K. Renz, L. Chen, E. Arani, and O. Sinavski (2025) SimLingo: vision-only closed-loop autonomous driving with language-action alignment . In Proceedings of the IEEE/CVF Conference on Computer Vision and Pattern Recognition (CVPR) , Note: arXiv:2503.09594 Cited by: Table 2 .
[29] Y. Tang, Z. Xu, Z. Meng, and E. Cheng (2025) HiP-AD: hierarchical and multi-granularity planning with deformable attention for autonomous driving in a single decoder . In Proceedings of the IEEE/CVF International Conference on Computer Vision (ICCV) , Note: arXiv:2503.08612 Cited by: Table 2 .
[30] L. Yin, R. Ju, G. Guo, and E. Cheng (2025) DiffRefiner: coarse to fine trajectory planning via diffusion refinement with semantic interaction for end-to-end autonomous driving . arXiv preprint arXiv:2511.17150 . Note: AAAI 2026 Cited by: Table 2 .
[31] L. Feng, Y. Gao, E. Zablocki, Q. Li, W. Li, S. Liu, M. Cord, and A. Alahi (2025) RAP: 3D rasterization augmented end-to-end planning . arXiv preprint arXiv:2510.04333 . Cited by: §7 .
[32] L. Nguyen, M. Fauth, B. Jaeger, D. Dauner, M. Igl, A. Geiger, and K. Chitta (2025) LEAD: minimizing learner-expert asymmetry in end-to-end driving . arXiv preprint arXiv:2512.20563 . Note: CVPR 2026 Cited by: §7 .