Deep Residual Learning for Image Recognition
Deep Residual Learning for Image Recognition
用于图像识别的深度残差学习
Abstract
摘要
Deeper neural networks are more difficult to train. We present a residual learning framework to ease the training of networks that are substantially deeper than those used previously. We explicitly reformulate the layers as learning residual functions with reference to the layer inputs, instead of learning unreferenced functions. We provide comprehensive empirical evidence showing that these residual networks are easier to optimize, and can gain accuracy from considerably increased depth. On the ImageNet dataset we evaluate residual nets with a depth of up to 152 layers—8× deeper than VGG nets [41] but still having lower complexity. An ensemble of these residual nets achieves 3.57% error on the ImageNet test set. This result won the 1st place on the ILSVRC 2015 classification task. We also present analysis on CIFAR-10 with 100 and 1000 layers.
越深的神经网络越难训练。我们提出一种残差学习框架,用来简化比以往深得多的网络的训练。我们明确地把各层重新表述为参照该层输入来学习残差函数,而不是学习无参照的函数。我们给出了全面的实验证据,表明这些残差网络更容易优化,并且能从显著增加的深度中获得精度提升。在 ImageNet 数据集上,我们评估了深达 152 层的残差网络,比 VGG 网络 [41] 深 8 倍,但复杂度仍然更低。这些残差网络的集成在 ImageNet 测试集上取得 3.57% 的错误率,获得 ILSVRC 2015 分类任务第一名。我们还在 CIFAR-10 上分析了 100 层和 1000 层的网络。
The depth of representations is of central importance for many visual recognition tasks. Solely due to our extremely deep representations, we obtain a 28% relative improvement on the COCO object detection dataset. Deep residual nets are foundations of our submissions to ILSVRC & COCO 2015 competitions¹, where we also won the 1st places on the tasks of ImageNet detection, ImageNet localization, COCO detection, and COCO segmentation.
表征的深度对许多视觉识别任务至关重要。仅凭极深的表征,我们就在 COCO 目标检测数据集上取得了 28% 的相对提升。深度残差网络是我们参加 ILSVRC 和 COCO 2015 竞赛¹ 所提交方案的基础,我们还在 ImageNet 检测、ImageNet 定位、COCO 检测和 COCO 分割任务上获得第一名。
1. Introduction
1. 引言
Deep convolutional neural networks [22, 21] have led to a series of breakthroughs for image classification [21, 50, 40]. Deep networks naturally integrate low/mid/high-level features [50] and classifiers in an end-to-end multi-layer fashion, and the “levels” of features can be enriched by the number of stacked layers (depth). Recent evidence [41, 44] reveals that network depth is of crucial importance, and the leading results [41, 44, 13, 16] on the challenging ImageNet dataset [36] all exploit “very deep” [41] models, with a depth of sixteen [41] to thirty [16]. Many other nontrivial visual recognition tasks [8, 12, 7, 32, 27] have also greatly benefited from very deep models.
深度卷积神经网络 [22, 21] 为图像分类带来了一系列突破 [21, 50, 40]。深度网络以端到端的多层方式,自然地整合了低、中、高层特征 [50] 和分类器,而特征的“层次”可以通过堆叠的层数(深度)来丰富。近来的证据 [41, 44] 表明网络深度至关重要,在极具挑战的 ImageNet 数据集 [36] 上领先的结果 [41, 44, 13, 16] 都采用了深度为 16 [41] 到 30 [16] 的“非常深”[41] 的模型。许多其他重要的视觉识别任务 [8, 12, 7, 32, 27] 也从非常深的模型中获益良多。
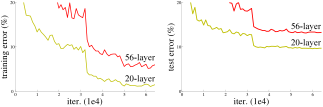
Figure 1. Training error (left) and test error (right) on CIFAR-10 with 20-layer and 56-layer “plain” networks. The deeper network has higher training error, and thus test error. Similar phenomena on ImageNet is presented in Fig. 4.
图 1 20 层和 56 层“普通”网络在 CIFAR-10 上的训练误差(左)和测试误差(右)。更深的网络训练误差更高,测试误差也因此更高。ImageNet 上的类似现象见图 4。
Driven by the significance of depth, a question arises: Is learning better networks as easy as stacking more layers? An obstacle to answering this question was the notorious problem of vanishing/exploding gradients [1, 9], which hamper convergence from the beginning. This problem, however, has been largely addressed by normalized initialization [23, 9, 37, 13] and intermediate normalization layers [16], which enable networks with tens of layers to start converging for stochastic gradient descent (SGD) with backpropagation [22].
既然深度如此重要,一个问题随之而来:学到更好的网络,是否就像堆叠更多层那么简单?回答这个问题的一个障碍是臭名昭著的梯度消失/爆炸问题 [1, 9],它从一开始就阻碍收敛。不过,这个问题已在很大程度上被归一化初始化 [23, 9, 37, 13] 和中间归一化层 [16] 解决,使几十层的网络在使用反向传播 [22] 的随机梯度下降(SGD)下能够开始收敛。
When deeper networks are able to start converging, a degradation problem has been exposed: with the network depth increasing, accuracy gets saturated (which might be unsurprising) and then degrades rapidly. Unexpectedly, such degradation is not caused by overfitting, and adding more layers to a suitably deep model leads to higher training error, as reported in [11, 42] and thoroughly verified by our experiments. Fig. 1 shows a typical example.
当更深的网络能够开始收敛时,一个退化问题暴露了出来:随着网络深度增加,精度先趋于饱和(这或许不足为奇),然后迅速下降。出人意料的是,这种退化并不是过拟合造成的:给一个深度适当的模型再加更多层,训练误差反而更高,[11, 42] 报告过这一现象,我们的实验也充分验证了它。图 1 是一个典型例子。
The degradation (of training accuracy) indicates that not all systems are similarly easy to optimize. Let us consider a shallower architecture and its deeper counterpart that adds more layers onto it. There exists a solution by construction to the deeper model: the added layers are identity mapping, and the other layers are copied from the learned shallower model. The existence of this constructed solution indicates that a deeper model should produce no higher training error than its shallower counterpart. But experiments show that our current solvers on hand are unable to find solutions that are comparably good or better than the constructed solution (or unable to do so in feasible time).
(训练精度的)退化说明,并非所有系统都同样容易优化。考虑一个较浅的架构,以及在其上加更多层得到的较深版本。较深模型存在一个构造出来的解:新加的层是恒等映射,其余各层从已学好的较浅模型复制过来。这个构造解的存在说明,较深的模型的训练误差不应高于对应的较浅模型。但实验表明,我们手头现有的求解器找不到与这个构造解一样好或更好的解(或者无法在可行的时间内找到)。
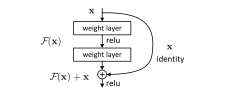
Figure 2. Residual learning: a building block. (Diagram: x → weight layer → relu → weight layer → F(x); identity shortcut x; F(x) + x → relu.)
图 2 残差学习:一个构建块。(示意:x → 权重层 → relu → 权重层 → F(x);恒等捷径 x;F(x) + x → relu。)
In this paper, we address the degradation problem by introducing a deep residual learning framework. Instead of hoping each few stacked layers directly fit a desired underlying mapping, we explicitly let these layers fit a residual mapping. Formally, denoting the desired underlying mapping as , we let the stacked nonlinear layers fit another mapping of . The original mapping is recast into . We hypothesize that it is easier to optimize the residual mapping than to optimize the original, unreferenced mapping. To the extreme, if an identity mapping were optimal, it would be easier to push the residual to zero than to fit an identity mapping by a stack of nonlinear layers.
本文通过引入深度残差学习框架来解决退化问题。我们不再指望每几个堆叠的层直接拟合所需的底层映射,而是明确让这些层去拟合一个残差映射。形式上,把所需的底层映射记为 ,我们让堆叠的非线性层去拟合另一个映射 ,原映射就改写为 。我们假设,优化残差映射比优化原始的、无参照的映射更容易。极端情况下,如果恒等映射是最优的,那么把残差推到零,要比用一叠非线性层去拟合恒等映射容易。
The formulation of can be realized by feedforward neural networks with “shortcut connections” (Fig. 2). Shortcut connections [2, 34, 49] are those skipping one or more layers. In our case, the shortcut connections simply perform identity mapping, and their outputs are added to the outputs of the stacked layers (Fig. 2). Identity shortcut connections add neither extra parameter nor computational complexity. The entire network can still be trained end-to-end by SGD with backpropagation, and can be easily implemented using common libraries (e.g., Caffe [19]) without modifying the solvers.
这一形式可以用带“捷径连接”的前馈神经网络实现(图 2)。捷径连接 [2, 34, 49] 指跳过一层或多层的连接。在我们的方案中,捷径连接只做恒等映射,其输出与堆叠层的输出相加(图 2)。恒等捷径连接既不增加参数,也不增加计算复杂度。整个网络仍可用反向传播加 SGD 端到端训练,也很容易用常见的库(如 Caffe [19])实现,无需修改求解器。
We present comprehensive experiments on ImageNet [36] to show the degradation problem and evaluate our method. We show that: 1) Our extremely deep residual nets are easy to optimize, but the counterpart “plain” nets (that simply stack layers) exhibit higher training error when the depth increases; 2) Our deep residual nets can easily enjoy accuracy gains from greatly increased depth, producing results substantially better than previous networks.
我们在 ImageNet [36] 上做了全面的实验,以展示退化问题并评估我们的方法。结果表明:1)我们的极深残差网络易于优化,而对应的“普通”网络(只是简单堆叠层)在深度增加时训练误差更高;2)我们的深度残差网络能轻松地从大幅增加的深度中获得精度提升,结果明显优于以往的网络。
Similar phenomena are also shown on the CIFAR-10 set [20], suggesting that the optimization difficulties and the effects of our method are not just akin to a particular dataset. We present successfully trained models on this dataset with over 100 layers, and explore models with over 1000 layers.
CIFAR-10 数据集 [20] 上也出现了类似现象,说明这种优化困难和我们方法的效果并不只限于某个特定数据集。我们在这个数据集上成功训练了超过 100 层的模型,并探索了超过 1000 层的模型。
On the ImageNet classification dataset [36], we obtain excellent results by extremely deep residual nets. Our 152-layer residual net is the deepest network ever presented on ImageNet, while still having lower complexity than VGG nets [41]. Our ensemble has 3.57% top-5 error on the ImageNet test set, and won the 1st place in the ILSVRC 2015 classification competition. The extremely deep representations also have excellent generalization performance on other recognition tasks, and lead us to further win the 1st places on: ImageNet detection, ImageNet localization, COCO detection, and COCO segmentation in ILSVRC & COCO 2015 competitions. This strong evidence shows that the residual learning principle is generic, and we expect that it is applicable in other vision and non-vision problems.
在 ImageNet 分类数据集 [36] 上,我们用极深的残差网络取得了出色的结果。我们的 152 层残差网络是迄今在 ImageNet 上提出的最深的网络,复杂度却仍低于 VGG 网络 [41]。我们的集成模型在 ImageNet 测试集上的 top-5 错误率为 3.57%,获得 ILSVRC 2015 分类竞赛第一名。这些极深的表征在其他识别任务上也有出色的泛化性能,使我们进一步在 ILSVRC 和 COCO 2015 竞赛的 ImageNet 检测、ImageNet 定位、COCO 检测和 COCO 分割中获得第一名。这些有力的证据表明,残差学习原理具有通用性,我们预期它也适用于其他视觉和非视觉问题。
2. Related Work
2. 相关工作
Residual Representations. In image recognition, VLAD [18] is a representation that encodes by the residual vectors with respect to a dictionary, and Fisher Vector [30] can be formulated as a probabilistic version [18] of VLAD. Both of them are powerful shallow representations for image retrieval and classification [4, 48]. For vector quantization, encoding residual vectors [17] is shown to be more effective than encoding original vectors.
残差表示。 在图像识别中,VLAD [18] 是一种用相对于字典的残差向量来编码的表示,Fisher 向量 [30] 可以表述为 VLAD 的概率版本 [18]。两者都是用于图像检索和分类的强大浅层表示 [4, 48]。在向量量化中,编码残差向量 [17] 被证明比编码原始向量更有效。
In low-level vision and computer graphics, for solving Partial Differential Equations (PDEs), the widely used Multigrid method [3] reformulates the system as subproblems at multiple scales, where each subproblem is responsible for the residual solution between a coarser and a finer scale. An alternative to Multigrid is hierarchical basis preconditioning [45, 46], which relies on variables that represent residual vectors between two scales. It has been shown [3, 45, 46] that these solvers converge much faster than standard solvers that are unaware of the residual nature of the solutions. These methods suggest that a good reformulation or preconditioning can simplify the optimization.
在底层视觉和计算机图形学中,求解偏微分方程(PDE)时广泛使用的多重网格法 [3] 把系统重新表述为多个尺度上的子问题,每个子问题负责较粗尺度与较细尺度之间的残差解。多重网格法的一种替代是分层基预条件法 [45, 46],它依赖于表示两个尺度之间残差向量的变量。已有研究 [3, 45, 46] 表明,这些求解器的收敛速度远快于不考虑解的残差性质的标准求解器。这些方法提示,好的重新表述或预条件处理可以简化优化。
Shortcut Connections. Practices and theories that lead to shortcut connections [2, 34, 49] have been studied for a long time. An early practice of training multi-layer perceptrons (MLPs) is to add a linear layer connected from the network input to the output [34, 49]. In [44, 24], a few intermediate layers are directly connected to auxiliary classifiers for addressing vanishing/exploding gradients. The papers of [39, 38, 31, 47] propose methods for centering layer responses, gradients, and propagated errors, implemented by shortcut connections. In [44], an “inception” layer is composed of a shortcut branch and a few deeper branches.
捷径连接。 引出捷径连接的实践和理论 [2, 34, 49] 已有很长的研究历史。训练多层感知机(MLP)的一种早期做法,是加一个从网络输入直连到输出的线性层 [34, 49]。在 [44, 24] 中,若干中间层直接连到辅助分类器,以应对梯度消失/爆炸。[39, 38, 31, 47] 提出了用捷径连接实现的、对层响应、梯度和传播误差进行中心化的方法。在 [44] 中,“inception”层由一个捷径分支和几个更深的分支组成。
Concurrent with our work, “highway networks” [42, 43] present shortcut connections with gating functions [15]. These gates are data-dependent and have parameters, in contrast to our identity shortcuts that are parameter-free. When a gated shortcut is “closed” (approaching zero), the layers in highway networks represent non-residual functions. On the contrary, our formulation always learns residual functions; our identity shortcuts are never closed, and all information is always passed through, with additional residual functions to be learned. In addition, highway networks have not demonstrated accuracy gains with extremely increased depth (e.g., over 100 layers).
与我们的工作同时,“高速公路网络”[42, 43] 提出了带门控函数 [15] 的捷径连接。这些门依赖于数据并带有参数,而我们的恒等捷径没有参数。当门控捷径“关闭”(趋近于零)时,高速公路网络中的层表示的是非残差函数。相反,我们的表述始终学习残差函数:恒等捷径从不关闭,所有信息总能通过,另外再学习残差函数。此外,高速公路网络尚未展示出在深度极大增加(例如超过 100 层)时的精度提升。
3. Deep Residual Learning
3. 深度残差学习
3.1. Residual Learning
3.1. 残差学习
Let us consider as an underlying mapping to be fit by a few stacked layers (not necessarily the entire net), with denoting the inputs to the first of these layers. If one hypothesizes that multiple nonlinear layers can asymptotically approximate complicated functions², then it is equivalent to hypothesize that they can asymptotically approximate the residual functions, i.e., (assuming that the input and output are of the same dimensions). So rather than expect stacked layers to approximate , we explicitly let these layers approximate a residual function . The original function thus becomes . Although both forms should be able to asymptotically approximate the desired functions (as hypothesized), the ease of learning might be different.
把 看作由若干堆叠层(不一定是整个网络)去拟合的底层映射, 表示这些层中第一层的输入。如果假设多个非线性层可以渐近逼近复杂函数²,那么等价地就可以假设它们能渐近逼近残差函数,即 (假定输入和输出维度相同)。因此,与其期望堆叠层逼近 ,我们明确让这些层逼近残差函数 ,原函数于是变为 。虽然(按假设)两种形式都应能渐近逼近所需的函数,但学习的难易程度可能不同。
This reformulation is motivated by the counterintuitive phenomena about the degradation problem (Fig. 1, left). As we discussed in the introduction, if the added layers can be constructed as identity mappings, a deeper model should have training error no greater than its shallower counterpart. The degradation problem suggests that the solvers might have difficulties in approximating identity mappings by multiple nonlinear layers. With the residual learning reformulation, if identity mappings are optimal, the solvers may simply drive the weights of the multiple nonlinear layers toward zero to approach identity mappings.
这种重新表述的动机,来自退化问题中违反直觉的现象(图 1 左)。正如引言所述,如果新加的层可以构造成恒等映射,较深模型的训练误差就不应大于对应的较浅模型。退化问题提示,求解器可能难以用多个非线性层来逼近恒等映射。采用残差学习的表述后,如果恒等映射是最优的,求解器只需把多个非线性层的权重推向零,就能逼近恒等映射。
In real cases, it is unlikely that identity mappings are optimal, but our reformulation may help to precondition the problem. If the optimal function is closer to an identity mapping than to a zero mapping, it should be easier for the solver to find the perturbations with reference to an identity mapping, than to learn the function as a new one. We show by experiments (Fig. 7) that the learned residual functions in general have small responses, suggesting that identity mappings provide reasonable preconditioning.
实际情况中,恒等映射不太可能恰好是最优的,但我们的重新表述可能有助于对问题进行预条件处理。如果最优函数离恒等映射比离零映射更近,那么求解器以恒等映射为参照去寻找扰动,应当比把这个函数当成全新的函数来学习更容易。我们通过实验(图 7)表明,学到的残差函数一般响应较小,说明恒等映射提供了合理的预条件。
3.2. Identity Mapping by Shortcuts
3.2. 通过捷径实现恒等映射
We adopt residual learning to every few stacked layers. A building block is shown in Fig. 2. Formally, in this paper we consider a building block defined as:
我们对每几个堆叠层采用残差学习,构建块如图 2 所示。形式上,本文考虑的构建块定义为:
Here and are the input and output vectors of the layers considered. The function represents the residual mapping to be learned. For the example in Fig. 2 that has two layers, in which denotes ReLU [29] and the biases are omitted for simplifying notations. The operation is performed by a shortcut connection and element-wise addition. We adopt the second nonlinearity after the addition (i.e., , see Fig. 2).
其中 和 是所考虑各层的输入和输出向量,函数 表示要学习的残差映射。以图 2 中的两层为例,,其中 表示 ReLU [29],为简化记号省略了偏置。 这一运算由捷径连接和逐元素相加完成。第二个非线性在相加之后施加(即 ,见图 2)。
² This hypothesis, however, is still an open question. See [28].
² 不过,这一假设仍是一个悬而未决的问题,见 [28]。
The shortcut connections in Eqn.(1) introduce neither extra parameter nor computation complexity. This is not only attractive in practice but also important in our comparisons between plain and residual networks. We can fairly compare plain/residual networks that simultaneously have the same number of parameters, depth, width, and computational cost (except for the negligible element-wise addition).
式 (1) 中的捷径连接既不引入额外参数,也不增加计算复杂度。这不仅在实践中很有吸引力,对我们比较普通网络和残差网络也很重要:我们可以公平地比较参数量、深度、宽度和计算成本都相同(除了可忽略的逐元素相加)的普通网络和残差网络。
The dimensions of and must be equal in Eqn.(1). If this is not the case (e.g., when changing the input/output channels), we can perform a linear projection by the shortcut connections to match the dimensions:
式 (1) 中 和 的维度必须相等。如果不相等(例如输入/输出通道数改变时),可以让捷径连接执行一个线性投影 来匹配维度:
We can also use a square matrix in Eqn.(1). But we will show by experiments that the identity mapping is sufficient for addressing the degradation problem and is economical, and thus is only used when matching dimensions.
在式 (1) 中也可以使用方阵 。但我们将通过实验表明,恒等映射足以解决退化问题且更经济,因此 只在匹配维度时使用。
The form of the residual function is flexible. Experiments in this paper involve a function that has two or three layers (Fig. 5), while more layers are possible. But if has only a single layer, Eqn.(1) is similar to a linear layer: , for which we have not observed advantages.
残差函数 的形式是灵活的。本文实验中的 有两层或三层(图 5),更多层也是可以的。但如果 只有一层,式 (1) 就类似于一个线性层:,我们没有观察到它有什么优势。
We also note that although the above notations are about fully-connected layers for simplicity, they are applicable to convolutional layers. The function can represent multiple convolutional layers. The element-wise addition is performed on two feature maps, channel by channel.
还要说明,虽然为简便起见上述记号针对的是全连接层,但它们同样适用于卷积层。函数 可以表示多个卷积层,逐元素相加则在两个特征图上逐通道进行。
3.3. Network Architectures
3.3. 网络架构
We have tested various plain/residual nets, and have observed consistent phenomena. To provide instances for discussion, we describe two models for ImageNet as follows.
我们测试了多种普通网络和残差网络,观察到的现象是一致的。为便于讨论,下面介绍两个用于 ImageNet 的模型。
Plain Network. Our plain baselines (Fig. 3, middle) are mainly inspired by the philosophy of VGG nets [41] (Fig. 3, left). The convolutional layers mostly have 3×3 filters and follow two simple design rules: (i) for the same output feature map size, the layers have the same number of filters; and (ii) if the feature map size is halved, the number of filters is doubled so as to preserve the time complexity per layer. We perform downsampling directly by convolutional layers that have a stride of 2. The network ends with a global average pooling layer and a 1000-way fully-connected layer with softmax. The total number of weighted layers is 34 in Fig. 3 (middle).
普通网络。 我们的普通基线(图 3 中)主要受 VGG 网络 [41](图 3 左)设计思想的启发。卷积层大多使用 3×3 滤波器,并遵循两条简单的设计规则:(i)输出特征图尺寸相同的层,滤波器数量相同;(ii)特征图尺寸减半时,滤波器数量加倍,以保持每层的时间复杂度。下采样直接由步长为 2 的卷积层完成。网络最后是一个全局平均池化层和一个带 softmax 的 1000 路全连接层。图 3(中)中带权重的层共 34 层。
It is worth noticing that our model has fewer filters and lower complexity than VGG nets [41] (Fig. 3, left). Our 34-layer baseline has 3.6 billion FLOPs (multiply-adds), which is only 18% of VGG-19 (19.6 billion FLOPs).
值得注意的是,我们的模型比 VGG 网络 [41](图 3 左)滤波器更少、复杂度更低。我们的 34 层基线有 36 亿次 FLOPs(乘加),只有 VGG-19(196 亿次 FLOPs)的 18%。
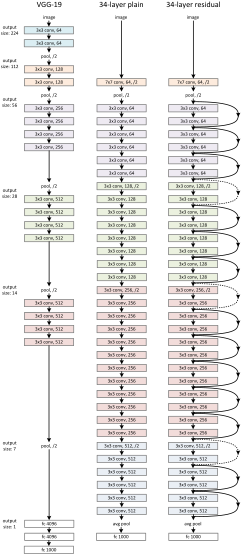
Figure 3. Example network architectures for ImageNet. Left: the VGG-19 model [41] (19.6 billion FLOPs) as a reference. Middle: a plain network with 34 parameter layers (3.6 billion FLOPs). Right: a residual network with 34 parameter layers (3.6 billion FLOPs). The dotted shortcuts increase dimensions. Table 1 shows more details and other variants.
图 3 用于 ImageNet 的网络架构示例。左:作为参照的 VGG-19 模型 [41](196 亿次 FLOPs)。中:有 34 个参数层的普通网络(36 亿次 FLOPs)。右:有 34 个参数层的残差网络(36 亿次 FLOPs)。虚线捷径表示增加维度。更多细节和其他变体见表 1。
Residual Network. Based on the above plain network, we insert shortcut connections (Fig. 3, right) which turn the network into its counterpart residual version. The identity shortcuts (Eqn.(1)) can be directly used when the input and output are of the same dimensions (solid line shortcuts in Fig. 3). When the dimensions increase (dotted line shortcuts in Fig. 3), we consider two options: (A) The shortcut still performs identity mapping, with extra zero entries padded for increasing dimensions. This option introduces no extra parameter; (B) The projection shortcut in Eqn.(2) is used to match dimensions (done by 1×1 convolutions). For both options, when the shortcuts go across feature maps of two sizes, they are performed with a stride of 2.
残差网络。 在上述普通网络的基础上插入捷径连接(图 3 右),就把它变成了对应的残差版本。输入和输出维度相同时(图 3 中的实线捷径),可以直接使用恒等捷径(式 (1))。维度增加时(图 3 中的虚线捷径),我们考虑两种方案:(A)捷径仍做恒等映射,对增加的维度补零,这种方案不引入额外参数;(B)使用式 (2) 中的投影捷径来匹配维度(用 1×1 卷积实现)。两种方案中,当捷径跨越两种尺寸的特征图时,都以步长 2 执行。
3.4. Implementation
3.4. 实现
Our implementation for ImageNet follows the practice in [21, 41]. The image is resized with its shorter side randomly sampled in [256, 480] for scale augmentation [41]. A 224×224 crop is randomly sampled from an image or its horizontal flip, with the per-pixel mean subtracted [21]. The standard color augmentation in [21] is used. We adopt batch normalization (BN) [16] right after each convolution and before activation, following [16]. We initialize the weights as in [13] and train all plain/residual nets from scratch. We use SGD with a mini-batch size of 256. The learning rate starts from 0.1 and is divided by 10 when the error plateaus, and the models are trained for up to iterations. We use a weight decay of 0.0001 and a momentum of 0.9. We do not use dropout [14], following the practice in [16].
我们在 ImageNet 上的实现遵循 [21, 41] 的做法。为做尺度增强 [41],把图像缩放到短边在 [256, 480] 中随机取值。从图像或其水平翻转中随机裁出 224×224 的区域,并减去逐像素均值 [21],同时使用 [21] 中的标准颜色增强。按照 [16],在每个卷积之后、激活之前使用批归一化(BN)[16]。权重按 [13] 初始化,所有普通网络和残差网络都从头训练。使用小批量大小为 256 的 SGD。学习率从 0.1 开始,误差停滞时除以 10,模型最多训练 次迭代。权重衰减为 0.0001,动量为 0.9。按照 [16] 的做法,不使用 dropout [14]。
In testing, for comparison studies we adopt the standard 10-crop testing [21]. For best results, we adopt the fully-convolutional form as in [41, 13], and average the scores at multiple scales (images are resized such that the shorter side is in {224, 256, 384, 480, 640}).
测试时,对比研究采用标准的 10 裁剪测试 [21]。为取得最佳结果,我们采用 [41, 13] 中的全卷积形式,并对多个尺度的得分取平均(图像缩放到短边为 {224, 256, 384, 480, 640})。
4. Experiments
4. 实验
4.1. ImageNet Classification
4.1. ImageNet 分类
We evaluate our method on the ImageNet 2012 classification dataset [36] that consists of 1000 classes. The models are trained on the 1.28 million training images, and evaluated on the 50k validation images. We also obtain a final result on the 100k test images, reported by the test server. We evaluate both top-1 and top-5 error rates.
我们在包含 1000 个类别的 ImageNet 2012 分类数据集 [36] 上评估方法。模型在 128 万张训练图像上训练,在 5 万张验证图像上评估。我们还在 10 万张测试图像上得到最终结果,由测试服务器报告。我们同时评估 top-1 和 top-5 错误率。
Plain Networks. We first evaluate 18-layer and 34-layer plain nets. The 34-layer plain net is in Fig. 3 (middle). The 18-layer plain net is of a similar form. See Table 1 for detailed architectures.
普通网络。 我们先评估 18 层和 34 层的普通网络。34 层普通网络见图 3(中),18 层普通网络形式类似。详细架构见表 1。
| layer name | output size | 18-layer | 34-layer | 50-layer | 101-layer | 152-layer |
|---|---|---|---|---|---|---|
| conv1 | 112×112 | 7×7, 64, stride 2 | 7×7, 64, stride 2 | 7×7, 64, stride 2 | 7×7, 64, stride 2 | 7×7, 64, stride 2 |
| conv2_x | 56×56 | 3×3 max pool, stride 2; [3×3, 64; 3×3, 64] ×2 | 3×3 max pool, stride 2; [3×3, 64; 3×3, 64] ×3 | 3×3 max pool, stride 2; [1×1, 64; 3×3, 64; 1×1, 256] ×3 | 3×3 max pool, stride 2; [1×1, 64; 3×3, 64; 1×1, 256] ×3 | 3×3 max pool, stride 2; [1×1, 64; 3×3, 64; 1×1, 256] ×3 |
| conv3_x | 28×28 | [3×3, 128; 3×3, 128] ×2 | [3×3, 128; 3×3, 128] ×4 | [1×1, 128; 3×3, 128; 1×1, 512] ×4 | [1×1, 128; 3×3, 128; 1×1, 512] ×4 | [1×1, 128; 3×3, 128; 1×1, 512] ×8 |
| conv4_x | 14×14 | [3×3, 256; 3×3, 256] ×2 | [3×3, 256; 3×3, 256] ×6 | [1×1, 256; 3×3, 256; 1×1, 1024] ×6 | [1×1, 256; 3×3, 256; 1×1, 1024] ×23 | [1×1, 256; 3×3, 256; 1×1, 1024] ×36 |
| conv5_x | 7×7 | [3×3, 512; 3×3, 512] ×2 | [3×3, 512; 3×3, 512] ×3 | [1×1, 512; 3×3, 512; 1×1, 2048] ×3 | [1×1, 512; 3×3, 512; 1×1, 2048] ×3 | [1×1, 512; 3×3, 512; 1×1, 2048] ×3 |
| 1×1 | average pool, 1000-d fc, softmax | average pool, 1000-d fc, softmax | average pool, 1000-d fc, softmax | average pool, 1000-d fc, softmax | average pool, 1000-d fc, softmax | |
| FLOPs | 1.8×10⁹ | 3.6×10⁹ | 3.8×10⁹ | 7.6×10⁹ | 11.3×10⁹ |
Table 1. Architectures for ImageNet. Building blocks are shown in brackets (see also Fig. 5), with the numbers of blocks stacked. Downsampling is performed by conv3_1, conv4_1, and conv5_1 with a stride of 2.
| 层名 | 输出尺寸 | 18 层 | 34 层 | 50 层 | 101 层 | 152 层 |
|---|---|---|---|---|---|---|
| conv1 | 112×112 | 7×7, 64, 步长 2 | 7×7, 64, 步长 2 | 7×7, 64, 步长 2 | 7×7, 64, 步长 2 | 7×7, 64, 步长 2 |
| conv2_x | 56×56 | 3×3 最大池化, 步长 2;[3×3, 64; 3×3, 64] ×2 | 3×3 最大池化, 步长 2;[3×3, 64; 3×3, 64] ×3 | 3×3 最大池化, 步长 2;[1×1, 64; 3×3, 64; 1×1, 256] ×3 | 3×3 最大池化, 步长 2;[1×1, 64; 3×3, 64; 1×1, 256] ×3 | 3×3 最大池化, 步长 2;[1×1, 64; 3×3, 64; 1×1, 256] ×3 |
| conv3_x | 28×28 | [3×3, 128; 3×3, 128] ×2 | [3×3, 128; 3×3, 128] ×4 | [1×1, 128; 3×3, 128; 1×1, 512] ×4 | [1×1, 128; 3×3, 128; 1×1, 512] ×4 | [1×1, 128; 3×3, 128; 1×1, 512] ×8 |
| conv4_x | 14×14 | [3×3, 256; 3×3, 256] ×2 | [3×3, 256; 3×3, 256] ×6 | [1×1, 256; 3×3, 256; 1×1, 1024] ×6 | [1×1, 256; 3×3, 256; 1×1, 1024] ×23 | [1×1, 256; 3×3, 256; 1×1, 1024] ×36 |
| conv5_x | 7×7 | [3×3, 512; 3×3, 512] ×2 | [3×3, 512; 3×3, 512] ×3 | [1×1, 512; 3×3, 512; 1×1, 2048] ×3 | [1×1, 512; 3×3, 512; 1×1, 2048] ×3 | [1×1, 512; 3×3, 512; 1×1, 2048] ×3 |
| 1×1 | 平均池化, 1000 维全连接, softmax | 平均池化, 1000 维全连接, softmax | 平均池化, 1000 维全连接, softmax | 平均池化, 1000 维全连接, softmax | 平均池化, 1000 维全连接, softmax | |
| FLOPs | 1.8×10⁹ | 3.6×10⁹ | 3.8×10⁹ | 7.6×10⁹ | 11.3×10⁹ |
表 1 ImageNet 上使用的架构。方括号内为构建块(另见图 5),后面是堆叠的块数。下采样由 conv3_1、conv4_1 和 conv5_1 以步长 2 完成。
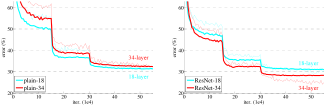
Figure 4. Training on ImageNet. Thin curves denote training error, and bold curves denote validation error of the center crops. Left: plain networks of 18 and 34 layers. Right: ResNets of 18 and 34 layers. In this plot, the residual networks have no extra parameter compared to their plain counterparts.
图 4 在 ImageNet 上的训练。细曲线表示训练误差,粗曲线表示中心裁剪的验证误差。左:18 层和 34 层的普通网络。右:18 层和 34 层的 ResNet。图中的残差网络与对应的普通网络相比没有额外参数。
| plain | ResNet | |
|---|---|---|
| 18 layers | 27.94 | 27.88 |
| 34 layers | 28.54 | 25.03 |
Table 2. Top-1 error (%, 10-crop testing) on ImageNet validation. Here the ResNets have no extra parameter compared to their plain counterparts. Fig. 4 shows the training procedures.
| 普通网络 | ResNet | |
|---|---|---|
| 18 层 | 27.94 | 27.88 |
| 34 层 | 28.54 | 25.03 |
表 2 ImageNet 验证集上的 top-1 错误率(%,10 裁剪测试)。这里的 ResNet 与对应的普通网络相比没有额外参数。训练过程见图 4。
The results in Table 2 show that the deeper 34-layer plain net has higher validation error than the shallower 18-layer plain net. To reveal the reasons, in Fig. 4 (left) we compare their training/validation errors during the training procedure. We have observed the degradation problem - the 34-layer plain net has higher training error throughout the whole training procedure, even though the solution space of the 18-layer plain network is a subspace of that of the 34-layer one.
表 2 的结果显示,较深的 34 层普通网络比较浅的 18 层普通网络验证误差更高。为揭示原因,我们在图 4(左)中比较了两者在训练过程中的训练/验证误差。我们观察到了退化问题:在整个训练过程中,34 层普通网络的训练误差都更高,尽管 18 层普通网络的解空间是 34 层网络解空间的一个子空间。
We argue that this optimization difficulty is unlikely to be caused by vanishing gradients. These plain networks are trained with BN [16], which ensures forward propagated signals to have non-zero variances. We also verify that the backward propagated gradients exhibit healthy norms with BN. So neither forward nor backward signals vanish. In fact, the 34-layer plain net is still able to achieve competitive accuracy (Table 3), suggesting that the solver works to some extent. We conjecture that the deep plain nets may have exponentially low convergence rates, which impact the reducing of the training error³. The reason for such optimization difficulties will be studied in the future.
我们认为这种优化困难不太可能是梯度消失造成的。这些普通网络都用 BN [16] 训练,BN 保证前向传播的信号方差不为零。我们也验证了在 BN 下反向传播的梯度范数正常。所以前向和反向信号都没有消失。事实上,34 层普通网络仍能达到有竞争力的精度(表 3),说明求解器在一定程度上是有效的。我们推测,深的普通网络可能具有指数级低的收敛速度,影响了训练误差的下降³。这种优化困难的原因将在今后研究。
³ We have experimented with more training iterations (3×) and still observed the degradation problem, suggesting that this problem cannot be feasibly addressed by simply using more iterations.
³ 我们尝试过更多的训练迭代(3 倍),仍然观察到退化问题,说明这个问题无法简单地靠增加迭代次数来解决。
Residual Networks. Next we evaluate 18-layer and 34-layer residual nets (ResNets). The baseline architectures are the same as the above plain nets, expect that a shortcut connection is added to each pair of 3×3 filters as in Fig. 3 (right). In the first comparison (Table 2 and Fig. 4 right), we use identity mapping for all shortcuts and zero-padding for increasing dimensions (option A). So they have no extra parameter compared to the plain counterparts.
残差网络。 接下来评估 18 层和 34 层的残差网络(ResNet)。基线架构与上面的普通网络相同,只是如图 3(右)那样给每对 3×3 滤波器加了一条捷径连接。在第一组比较中(表 2 和图 4 右),所有捷径都用恒等映射,增加维度时补零(方案 A),因此与对应的普通网络相比没有额外参数。
We have three major observations from Table 2 and Fig. 4. First, the situation is reversed with residual learning – the 34-layer ResNet is better than the 18-layer ResNet (by 2.8%). More importantly, the 34-layer ResNet exhibits considerably lower training error and is generalizable to the validation data. This indicates that the degradation problem is well addressed in this setting and we manage to obtain accuracy gains from increased depth.
从表 2 和图 4 中可以得到三点主要观察。第一,采用残差学习后情况反转了:34 层 ResNet 比 18 层 ResNet 更好(好 2.8%)。更重要的是,34 层 ResNet 的训练误差明显更低,并且能泛化到验证数据上。这说明在这种设置下退化问题得到了很好的解决,我们成功地从增加的深度中获得了精度提升。
Second, compared to its plain counterpart, the 34-layer ResNet reduces the top-1 error by 3.5% (Table 2), resulting from the successfully reduced training error (Fig. 4 right vs. left). This comparison verifies the effectiveness of residual learning on extremely deep systems.
第二,与对应的普通网络相比,34 层 ResNet 把 top-1 错误率降低了 3.5%(表 2),这来自训练误差的成功降低(图 4 右与左对比)。这一比较验证了残差学习在极深系统上的有效性。
Last, we also note that the 18-layer plain/residual nets are comparably accurate (Table 2), but the 18-layer ResNet converges faster (Fig. 4 right vs. left). When the net is “not overly deep” (18 layers here), the current SGD solver is still able to find good solutions to the plain net. In this case, the ResNet eases the optimization by providing faster convergence at the early stage.
最后,我们还注意到 18 层的普通网络和残差网络精度相当(表 2),但 18 层 ResNet 收敛更快(图 4 右与左对比)。当网络“不算太深”(这里是 18 层)时,现有的 SGD 求解器仍能为普通网络找到好的解。在这种情况下,ResNet 通过在早期提供更快的收敛来简化优化。
| model | top-1 err. | top-5 err. |
|---|---|---|
| VGG-16 [41] | 28.07 | 9.33 |
| GoogLeNet [44] | - | 9.15 |
| PReLU-net [13] | 24.27 | 7.38 |
| plain-34 | 28.54 | 10.02 |
| ResNet-34 A | 25.03 | 7.76 |
| ResNet-34 B | 24.52 | 7.46 |
| ResNet-34 C | 24.19 | 7.40 |
| ResNet-50 | 22.85 | 6.71 |
| ResNet-101 | 21.75 | 6.05 |
| ResNet-152 | 21.43 | 5.71 |
Table 3. Error rates (%, 10-crop testing) on ImageNet validation. VGG-16 is based on our test. ResNet-50/101/152 are of option B that only uses projections for increasing dimensions.
| 模型 | top-1 错误率 | top-5 错误率 |
|---|---|---|
| VGG-16 [41] | 28.07 | 9.33 |
| GoogLeNet [44] | - | 9.15 |
| PReLU-net [13] | 24.27 | 7.38 |
| plain-34 | 28.54 | 10.02 |
| ResNet-34 A | 25.03 | 7.76 |
| ResNet-34 B | 24.52 | 7.46 |
| ResNet-34 C | 24.19 | 7.40 |
| ResNet-50 | 22.85 | 6.71 |
| ResNet-101 | 21.75 | 6.05 |
| ResNet-152 | 21.43 | 5.71 |
表 3 ImageNet 验证集上的错误率(%,10 裁剪测试)。VGG-16 为我们自己测试的结果。ResNet-50/101/152 采用方案 B,只在增加维度时使用投影。
| method | top-1 err. | top-5 err. |
|---|---|---|
| VGG [41] (ILSVRC’14) | - | 8.43† |
| GoogLeNet [44] (ILSVRC’14) | - | 7.89 |
| VGG [41] (v5) | 24.4 | 7.1 |
| PReLU-net [13] | 21.59 | 5.71 |
| BN-inception [16] | 21.99 | 5.81 |
| ResNet-34 B | 21.84 | 5.71 |
| ResNet-34 C | 21.53 | 5.60 |
| ResNet-50 | 20.74 | 5.25 |
| ResNet-101 | 19.87 | 4.60 |
| ResNet-152 | 19.38 | 4.49 |
Table 4. Error rates (%) of single-model results on the ImageNet validation set (except † reported on the test set).
| 方法 | top-1 错误率 | top-5 错误率 |
|---|---|---|
| VGG [41] (ILSVRC’14) | - | 8.43† |
| GoogLeNet [44] (ILSVRC’14) | - | 7.89 |
| VGG [41] (v5) | 24.4 | 7.1 |
| PReLU-net [13] | 21.59 | 5.71 |
| BN-inception [16] | 21.99 | 5.81 |
| ResNet-34 B | 21.84 | 5.71 |
| ResNet-34 C | 21.53 | 5.60 |
| ResNet-50 | 20.74 | 5.25 |
| ResNet-101 | 19.87 | 4.60 |
| ResNet-152 | 19.38 | 4.49 |
表 4 ImageNet 验证集上单模型结果的错误率(%)(† 为在测试集上报告的结果)。
| method | top-5 err. (test) |
|---|---|
| VGG [41] (ILSVRC’14) | 7.32 |
| GoogLeNet [44] (ILSVRC’14) | 6.66 |
| VGG [41] (v5) | 6.8 |
| PReLU-net [13] | 4.94 |
| BN-inception [16] | 4.82 |
| ResNet (ILSVRC’15) | 3.57 |
Table 5. Error rates (%) of ensembles. The top-5 error is on the test set of ImageNet and reported by the test server.
| 方法 | top-5 错误率(测试集) |
|---|---|
| VGG [41] (ILSVRC’14) | 7.32 |
| GoogLeNet [44] (ILSVRC’14) | 6.66 |
| VGG [41] (v5) | 6.8 |
| PReLU-net [13] | 4.94 |
| BN-inception [16] | 4.82 |
| ResNet (ILSVRC’15) | 3.57 |
表 5 集成模型的错误率(%)。top-5 错误率是 ImageNet 测试集上的结果,由测试服务器报告。
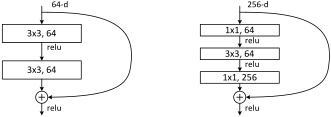
Figure 5. A deeper residual function for ImageNet. Left: a building block (on 56×56 feature maps) as in Fig. 3 for ResNet-34. Right: a “bottleneck” building block for ResNet-50/101/152. (Left: 64-d → 3×3, 64 → relu → 3×3, 64 → + → relu. Right: 256-d → 1×1, 64 → relu → 3×3, 64 → relu → 1×1, 256 → + → relu.)
图 5 用于 ImageNet 的更深的残差函数 。左:ResNet-34 使用的构建块(在 56×56 特征图上),同图 3。右:ResNet-50/101/152 使用的“瓶颈”构建块。(左:64 维 → 3×3, 64 → relu → 3×3, 64 → 相加 → relu。右:256 维 → 1×1, 64 → relu → 3×3, 64 → relu → 1×1, 256 → 相加 → relu。)
Identity vs. Projection Shortcuts. We have shown that parameter-free, identity shortcuts help with training. Next we investigate projection shortcuts (Eqn.(2)). In Table 3 we compare three options: (A) zero-padding shortcuts are used for increasing dimensions, and all shortcuts are parameter-free (the same as Table 2 and Fig. 4 right); (B) projection shortcuts are used for increasing dimensions, and other shortcuts are identity; and (C) all shortcuts are projections.
恒等捷径与投影捷径。 我们已经表明,无参数的恒等捷径有助于训练。接下来研究投影捷径(式 (2))。表 3 比较了三种方案:(A)增加维度时用补零捷径,所有捷径都无参数(与表 2 和图 4 右相同);(B)增加维度时用投影捷径,其他捷径为恒等;(C)所有捷径都是投影。
Table 3 shows that all three options are considerably better than the plain counterpart. B is slightly better than A. We argue that this is because the zero-padded dimensions in A indeed have no residual learning. C is marginally better than B, and we attribute this to the extra parameters introduced by many (thirteen) projection shortcuts. But the small differences among A/B/C indicate that projection shortcuts are not essential for addressing the degradation problem. So we do not use option C in the rest of this paper, to reduce memory/time complexity and model sizes. Identity shortcuts are particularly important for not increasing the complexity of the bottleneck architectures that are introduced below.
表 3 显示,三种方案都明显优于对应的普通网络。B 略好于 A,我们认为这是因为 A 中补零的维度确实没有进行残差学习。C 比 B 稍好一点,我们把这归因于许多(13 条)投影捷径引入的额外参数。但 A、B、C 之间的差异很小,说明投影捷径对解决退化问题并非必不可少。因此本文其余部分不使用方案 C,以降低内存/时间复杂度和模型大小。对于下面介绍的瓶颈架构,恒等捷径对不增加复杂度尤为重要。
Deeper Bottleneck Architectures. Next we describe our deeper nets for ImageNet. Because of concerns on the training time that we can afford, we modify the building block as a bottleneck design⁴. For each residual function , we use a stack of 3 layers instead of 2 (Fig. 5). The three layers are 1×1, 3×3, and 1×1 convolutions, where the 1×1 layers are responsible for reducing and then increasing (restoring) dimensions, leaving the 3×3 layer a bottleneck with smaller input/output dimensions. Fig. 5 shows an example, where both designs have similar time complexity.
更深的瓶颈架构。 下面介绍我们用于 ImageNet 的更深网络。考虑到我们能承受的训练时间,我们把构建块改为瓶颈设计⁴。每个残差函数 用 3 层而不是 2 层堆叠(图 5)。这三层分别是 1×1、3×3 和 1×1 卷积,其中两个 1×1 层负责先降维再升维(恢复维度),使 3×3 层成为输入/输出维度较小的瓶颈。图 5 给出了一个例子,两种设计的时间复杂度相近。
The parameter-free identity shortcuts are particularly important for the bottleneck architectures. If the identity shortcut in Fig. 5 (right) is replaced with projection, one can show that the time complexity and model size are doubled, as the shortcut is connected to the two high-dimensional ends. So identity shortcuts lead to more efficient models for the bottleneck designs.
无参数的恒等捷径对瓶颈架构尤为重要。如果把图 5(右)中的恒等捷径换成投影,可以证明时间复杂度和模型大小都会翻倍,因为捷径连接的是两个高维的端点。所以对瓶颈设计来说,恒等捷径能得到更高效的模型。
⁴ Deeper non-bottleneck ResNets (e.g., Fig. 5 left) also gain accuracy from increased depth (as shown on CIFAR-10), but are not as economical as the bottleneck ResNets. So the usage of bottleneck designs is mainly due to practical considerations. We further note that the degradation problem of plain nets is also witnessed for the bottleneck designs.
⁴ 更深的非瓶颈 ResNet(如图 5 左)同样能从增加的深度中获得精度提升(如 CIFAR-10 上所示),但不如瓶颈 ResNet 经济。因此采用瓶颈设计主要是出于实际考虑。我们还注意到,瓶颈设计的普通网络同样存在退化问题。
50-layer ResNet: We replace each 2-layer block in the 34-layer net with this 3-layer bottleneck block, resulting in a 50-layer ResNet (Table 1). We use option B for increasing dimensions. This model has 3.8 billion FLOPs.
50 层 ResNet: 我们把 34 层网络中的每个 2 层块换成这种 3 层瓶颈块,得到 50 层 ResNet(表 1)。增加维度时使用方案 B。该模型有 38 亿次 FLOPs。
101-layer and 152-layer ResNets: We construct 101-layer and 152-layer ResNets by using more 3-layer blocks (Table 1). Remarkably, although the depth is significantly increased, the 152-layer ResNet (11.3 billion FLOPs) still has lower complexity than VGG-16/19 nets (15.3/19.6 billion FLOPs).
101 层和 152 层 ResNet: 我们使用更多的 3 层块构建了 101 层和 152 层 ResNet(表 1)。值得注意的是,尽管深度大幅增加,152 层 ResNet(113 亿次 FLOPs)的复杂度仍低于 VGG-16/19 网络(153/196 亿次 FLOPs)。
The 50/101/152-layer ResNets are more accurate than the 34-layer ones by considerable margins (Table 3 and 4). We do not observe the degradation problem and thus enjoy significant accuracy gains from considerably increased depth. The benefits of depth are witnessed for all evaluation metrics (Table 3 and 4).
50/101/152 层 ResNet 比 34 层的精度高出相当多(表 3 和表 4)。我们没有观察到退化问题,因此能从大幅增加的深度中获得显著的精度提升。所有评估指标上都能看到深度带来的好处(表 3 和表 4)。
Comparisons with State-of-the-art Methods. In Table 4 we compare with the previous best single-model results. Our baseline 34-layer ResNets have achieved very competitive accuracy. Our 152-layer ResNet has a single-model top-5 validation error of 4.49%. This single-model result outperforms all previous ensemble results (Table 5). We combine six models of different depth to form an ensemble (only with two 152-layer ones at the time of submitting). This leads to 3.57% top-5 error on the test set (Table 5). This entry won the 1st place in ILSVRC 2015.
与最先进方法的比较。 表 4 与此前最好的单模型结果作比较。我们的 34 层 ResNet 基线已经达到很有竞争力的精度。我们的 152 层 ResNet 单模型 top-5 验证错误率为 4.49%,这一单模型结果超过了此前所有的集成结果(表 5)。我们把六个不同深度的模型组成集成(提交时其中只有两个 152 层模型),在测试集上得到 3.57% 的 top-5 错误率(表 5)。这一提交获得了 ILSVRC 2015 第一名。
4.2. CIFAR-10 and Analysis
4.2. CIFAR-10 实验与分析
We conducted more studies on the CIFAR-10 dataset [20], which consists of 50k training images and 10k testing images in 10 classes. We present experiments trained on the training set and evaluated on the test set. Our focus is on the behaviors of extremely deep networks, but not on pushing the state-of-the-art results, so we intentionally use simple architectures as follows.
我们在 CIFAR-10 数据集 [20] 上做了更多研究,它包含 10 个类别的 5 万张训练图像和 1 万张测试图像。实验在训练集上训练、在测试集上评估。我们关注的是极深网络的行为,而不是刷新最好结果,所以有意采用如下的简单架构。
The plain/residual architectures follow the form in Fig. 3 (middle/right). The network inputs are 32×32 images, with the per-pixel mean subtracted. The first layer is 3×3 convolutions. Then we use a stack of layers with 3×3 convolutions on the feature maps of sizes {32, 16, 8} respectively, with layers for each feature map size. The numbers of filters are {16, 32, 64} respectively. The subsampling is performed by convolutions with a stride of 2. The network ends with a global average pooling, a 10-way fully-connected layer, and softmax. There are totally stacked weighted layers. The following table summarizes the architecture:
普通网络和残差网络的架构遵循图 3(中/右)的形式。网络输入为 32×32 的图像,减去逐像素均值。第一层是 3×3 卷积。之后在尺寸分别为 {32, 16, 8} 的特征图上堆叠 个 3×3 卷积层,每种特征图尺寸 层,滤波器数量分别为 {16, 32, 64}。下采样由步长为 2 的卷积完成。网络最后是全局平均池化、10 路全连接层和 softmax。共有 个堆叠的带权重层。下表总结了该架构:
| output map size | 32×32 | 16×16 | 8×8 |
|---|---|---|---|
| # layers | 1+2n | 2n | 2n |
| # filters | 16 | 32 | 64 |
| 输出特征图尺寸 | 32×32 | 16×16 | 8×8 |
|---|---|---|---|
| 层数 | 1+2n | 2n | 2n |
| 滤波器数 | 16 | 32 | 64 |
When shortcut connections are used, they are connected to the pairs of 3×3 layers (totally shortcuts). On this dataset we use identity shortcuts in all cases (i.e., option A), so our residual models have exactly the same depth, width, and number of parameters as the plain counterparts.
使用捷径连接时,它们连接在成对的 3×3 层上(共 条捷径)。在这个数据集上,所有情况都使用恒等捷径(即方案 A),因此我们的残差模型与对应的普通模型深度、宽度和参数量完全相同。
| method | # layers | # params | error (%) | |
|---|---|---|---|---|
| Maxout [10] | 9.38 | |||
| NIN [25] | 8.81 | |||
| DSN [24] | 8.22 | |||
| FitNet [35] | 19 | 2.5M | 8.39 | |
| Highway [42, 43] | 19 | 2.3M | 7.54 (7.72±0.16) | |
| Highway [42, 43] | 32 | 1.25M | 8.80 | |
| ResNet | 20 | 0.27M | 8.75 | |
| ResNet | 32 | 0.46M | 7.51 | |
| ResNet | 44 | 0.66M | 7.17 | |
| ResNet | 56 | 0.85M | 6.97 | |
| ResNet | 110 | 1.7M | 6.43 (6.61±0.16) | |
| ResNet | 1202 | 19.4M | 7.93 |
Table 6. Classification error on the CIFAR-10 test set. All methods are with data augmentation. For ResNet-110, we run it 5 times and show “best (mean±std)” as in [43].
| 方法 | 层数 | 参数量 | 错误率(%) | |
|---|---|---|---|---|
| Maxout [10] | 9.38 | |||
| NIN [25] | 8.81 | |||
| DSN [24] | 8.22 | |||
| FitNet [35] | 19 | 2.5M | 8.39 | |
| Highway [42, 43] | 19 | 2.3M | 7.54 (7.72±0.16) | |
| Highway [42, 43] | 32 | 1.25M | 8.80 | |
| ResNet | 20 | 0.27M | 8.75 | |
| ResNet | 32 | 0.46M | 7.51 | |
| ResNet | 44 | 0.66M | 7.17 | |
| ResNet | 56 | 0.85M | 6.97 | |
| ResNet | 110 | 1.7M | 6.43 (6.61±0.16) | |
| ResNet | 1202 | 19.4M | 7.93 |
表 6 CIFAR-10 测试集上的分类错误率。所有方法都使用了数据增强。ResNet-110 运行 5 次,按 [43] 的方式给出“最好结果(均值±标准差)”。
We use a weight decay of 0.0001 and momentum of 0.9, and adopt the weight initialization in [13] and BN [16] but with no dropout. These models are trained with a mini-batch size of 128 on two GPUs. We start with a learning rate of 0.1, divide it by 10 at 32k and 48k iterations, and terminate training at 64k iterations, which is determined on a 45k/5k train/val split. We follow the simple data augmentation in [24] for training: 4 pixels are padded on each side, and a 32×32 crop is randomly sampled from the padded image or its horizontal flip. For testing, we only evaluate the single view of the original 32×32 image.
权重衰减为 0.0001,动量为 0.9,采用 [13] 的权重初始化和 BN [16],不使用 dropout。这些模型在两块 GPU 上以 128 的小批量训练。学习率从 0.1 开始,在第 32k 和 48k 次迭代时除以 10,在第 64k 次迭代时终止训练,这一设定是在 45k/5k 的训练/验证划分上确定的。训练时采用 [24] 中的简单数据增强:每边填充 4 个像素,再从填充后的图像或其水平翻转中随机裁出 32×32 的区域。测试时只评估原始 32×32 图像的单一视图。
We compare , leading to 20, 32, 44, and 56-layer networks. Fig. 6 (left) shows the behaviors of the plain nets. The deep plain nets suffer from increased depth, and exhibit higher training error when going deeper. This phenomenon is similar to that on ImageNet (Fig. 4, left) and on MNIST (see [42]), suggesting that such an optimization difficulty is a fundamental problem.
我们比较 ,对应 20、32、44 和 56 层的网络。图 6(左)展示了普通网络的表现:深的普通网络受深度增加之害,越深训练误差越高。这一现象与 ImageNet 上(图 4 左)和 MNIST 上(见 [42])的情况相似,说明这种优化困难是一个根本性的问题。
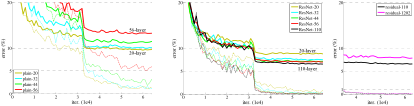
Fig. 6 (middle) shows the behaviors of ResNets. Also similar to the ImageNet cases (Fig. 4, right), our ResNets manage to overcome the optimization difficulty and demonstrate accuracy gains when the depth increases.
图 6(中)展示了 ResNet 的表现。同样与 ImageNet 的情况(图 4 右)相似,我们的 ResNet 克服了优化困难,并在深度增加时表现出精度提升。
We further explore that leads to a 110-layer ResNet. In this case, we find that the initial learning rate of 0.1 is slightly too large to start converging⁵. So we use 0.01 to warm up the training until the training error is below 80% (about 400 iterations), and then go back to 0.1 and continue training. The rest of the learning schedule is as done previously. This 110-layer network converges well (Fig. 6, middle). It has fewer parameters than other deep and thin networks such as FitNet [35] and Highway [42] (Table 6), yet is among the state-of-the-art results (6.43%, Table 6).
我们进一步探索 ,得到 110 层的 ResNet。这时我们发现,0.1 的初始学习率稍大,难以开始收敛⁵。于是先用 0.01 预热训练,直到训练误差低于 80%(约 400 次迭代),再回到 0.1 继续训练,其余学习率安排与前面相同。这个 110 层网络收敛良好(图 6 中)。它的参数比 FitNet [35] 和 Highway [42] 等其他深而窄的网络更少(表 6),结果却跻身最好之列(6.43%,表 6)。
⁵ With an initial learning rate of 0.1, it starts converging (<90% error) after several epochs, but still reaches similar accuracy.
⁵ 初始学习率为 0.1 时,它在几个轮次后开始收敛(误差 <90%),最终仍能达到相近的精度。
Figure 6. Training on CIFAR-10. Dashed lines denote training error, and bold lines denote testing error. Left: plain networks. The error of plain-110 is higher than 60% and not displayed. Middle: ResNets. Right: ResNets with 110 and 1202 layers.
图 6 在 CIFAR-10 上的训练。虚线表示训练误差,粗线表示测试误差。左:普通网络,plain-110 的误差高于 60%,未画出。中:ResNet。右:110 层和 1202 层的 ResNet。
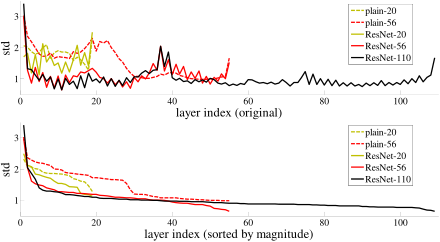
Figure 7. Standard deviations (std) of layer responses on CIFAR-10. The responses are the outputs of each 3×3 layer, after BN and before nonlinearity. Top: the layers are shown in their original order. Bottom: the responses are ranked in descending order.
图 7 CIFAR-10 上各层响应的标准差(std)。响应是每个 3×3 层在 BN 之后、非线性之前的输出。上:各层按原始顺序排列。下:响应按从大到小排序。
Analysis of Layer Responses. Fig. 7 shows the standard deviations (std) of the layer responses. The responses are the outputs of each 3×3 layer, after BN and before other nonlinearity (ReLU/addition). For ResNets, this analysis reveals the response strength of the residual functions. Fig. 7 shows that ResNets have generally smaller responses than their plain counterparts. These results support our basic motivation (Sec.3.1) that the residual functions might be generally closer to zero than the non-residual functions. We also notice that the deeper ResNet has smaller magnitudes of responses, as evidenced by the comparisons among ResNet-20, 56, and 110 in Fig. 7. When there are more layers, an individual layer of ResNets tends to modify the signal less.
层响应分析。 图 7 给出了各层响应的标准差(std)。响应是每个 3×3 层在 BN 之后、其他非线性(ReLU/相加)之前的输出。对 ResNet 而言,这一分析揭示了残差函数的响应强度。图 7 显示,ResNet 的响应总体上比对应的普通网络小。这些结果支持了我们的基本动机(第 3.1 节):残差函数一般可能比非残差函数更接近零。我们还注意到,越深的 ResNet 响应幅度越小,图 7 中 ResNet-20、56 和 110 的比较证明了这一点。层数越多,ResNet 的单个层对信号的修改往往越小。
Exploring Over 1000 layers. We explore an aggressively deep model of over 1000 layers. We set that leads to a 1202-layer network, which is trained as described above. Our method shows no optimization difficulty, and this -layer network is able to achieve training error <0.1% (Fig. 6, right). Its test error is still fairly good (7.93%, Table 6).
探索超过 1000 层。 我们探索了一个超过 1000 层的极深模型。设 ,得到 1202 层的网络,按上述方式训练。我们的方法没有表现出优化困难,这个 层的网络能达到 <0.1% 的训练误差(图 6 右),测试误差也仍然相当不错(7.93%,表 6)。
But there are still open problems on such aggressively deep models. The testing result of this 1202-layer network is worse than that of our 110-layer network, although both have similar training error. We argue that this is because of overfitting. The 1202-layer network may be unnecessarily large (19.4M) for this small dataset. Strong regularization such as maxout [10] or dropout [14] is applied to obtain the best results ([10, 25, 24, 35]) on this dataset. In this paper, we use no maxout/dropout and just simply impose regularization via deep and thin architectures by design, without distracting from the focus on the difficulties of optimization. But combining with stronger regularization may improve results, which we will study in the future.
但这类极深模型仍有未解决的问题。这个 1202 层网络的测试结果比我们的 110 层网络差,尽管两者的训练误差相近。我们认为这是过拟合所致:对这个小数据集来说,1202 层网络(19.4M 参数)可能过大了。在这个数据集上取得最好结果([10, 25, 24, 35])都用了 maxout [10] 或 dropout [14] 等强正则化。本文不使用 maxout/dropout,只是通过设计上深而窄的架构施加正则化,以免偏离对优化困难的关注。但结合更强的正则化可能会改善结果,我们将在今后研究。
| training data | 07+12 | 07++12 |
|---|---|---|
| test data | VOC 07 test | VOC 12 test |
| VGG-16 | 73.2 | 70.4 |
| ResNet-101 | 76.4 | 73.8 |
Table 7. Object detection mAP (%) on the PASCAL VOC 2007/2012 test sets using baseline Faster R-CNN. See also Table 10 and 11 for better results.
| 训练数据 | 07+12 | 07++12 |
|---|---|---|
| 测试数据 | VOC 07 test | VOC 12 test |
| VGG-16 | 73.2 | 70.4 |
| ResNet-101 | 76.4 | 73.8 |
表 7 使用基线 Faster R-CNN 在 PASCAL VOC 2007/2012 测试集上的目标检测 mAP(%)。更好的结果见表 10 和表 11。
| metric | mAP@.5 | mAP@[.5, .95] |
|---|---|---|
| VGG-16 | 41.5 | 21.2 |
| ResNet-101 | 48.4 | 27.2 |
Table 8. Object detection mAP (%) on the COCO validation set using baseline Faster R-CNN. See also Table 9 for better results.
| 指标 | mAP@.5 | mAP@[.5, .95] |
|---|---|---|
| VGG-16 | 41.5 | 21.2 |
| ResNet-101 | 48.4 | 27.2 |
表 8 使用基线 Faster R-CNN 在 COCO 验证集上的目标检测 mAP(%)。更好的结果见表 9。
4.3. Object Detection on PASCAL and MS COCO
4.3. PASCAL 和 MS COCO 上的目标检测
Our method has good generalization performance on other recognition tasks. Table 7 and 8 show the object detection baseline results on PASCAL VOC 2007 and 2012 [5] and COCO [26]. We adopt Faster R-CNN [32] as the detection method. Here we are interested in the improvements of replacing VGG-16 [41] with ResNet-101. The detection implementation (see appendix) of using both models is the same, so the gains can only be attributed to better networks. Most remarkably, on the challenging COCO dataset we obtain a 6.0% increase in COCO’s standard metric (mAP@[.5, .95]), which is a 28% relative improvement. This gain is solely due to the learned representations.
我们的方法在其他识别任务上也有良好的泛化性能。表 7 和表 8 给出了 PASCAL VOC 2007 和 2012 [5] 以及 COCO [26] 上的目标检测基线结果。检测方法采用 Faster R-CNN [32]。这里我们关心的是把 VGG-16 [41] 换成 ResNet-101 带来的提升。两种模型使用相同的检测实现(见附录),所以提升只能归功于更好的网络。最引人注目的是,在极具挑战的 COCO 数据集上,COCO 的标准指标(mAP@[.5, .95])提高了 6.0%,相对提升 28%。这一提升完全来自学到的表征。
Based on deep residual nets, we won the 1st places in several tracks in ILSVRC & COCO 2015 competitions: ImageNet detection, ImageNet localization, COCO detection, and COCO segmentation. The details are in the appendix.
基于深度残差网络,我们在 ILSVRC 和 COCO 2015 竞赛的多个项目中获得第一名:ImageNet 检测、ImageNet 定位、COCO 检测和 COCO 分割。详情见附录。
References
参考文献
[1] Y. Bengio, P. Simard, and P. Frasconi. Learning long-term dependencies with gradient descent is difficult. IEEE Transactions on Neural Networks, 5(2):157–166, 1994.
[2] C. M. Bishop. Neural networks for pattern recognition. Oxford university press, 1995.
[3] W. L. Briggs, S. F. McCormick, et al. A Multigrid Tutorial. Siam, 2000.
[4] K. Chatfield, V. Lempitsky, A. Vedaldi, and A. Zisserman. The devil is in the details: an evaluation of recent feature encoding methods. In BMVC, 2011.
[5] M. Everingham, L. Van Gool, C. K. Williams, J. Winn, and A. Zisserman. The Pascal Visual Object Classes (VOC) Challenge. IJCV, pages 303–338, 2010.
[6] S. Gidaris and N. Komodakis. Object detection via a multi-region & semantic segmentation-aware cnn model. In ICCV, 2015.
[7] R. Girshick. Fast R-CNN. In ICCV, 2015.
[8] R. Girshick, J. Donahue, T. Darrell, and J. Malik. Rich feature hierarchies for accurate object detection and semantic segmentation. In CVPR, 2014.
[9] X. Glorot and Y. Bengio. Understanding the difficulty of training deep feedforward neural networks. In AISTATS, 2010.
[10] I. J. Goodfellow, D. Warde-Farley, M. Mirza, A. Courville, and Y. Bengio. Maxout networks. arXiv:1302.4389, 2013.
[11] K. He and J. Sun. Convolutional neural networks at constrained time cost. In CVPR, 2015.
[12] K. He, X. Zhang, S. Ren, and J. Sun. Spatial pyramid pooling in deep convolutional networks for visual recognition. In ECCV, 2014.
[13] K. He, X. Zhang, S. Ren, and J. Sun. Delving deep into rectifiers: Surpassing human-level performance on imagenet classification. In ICCV, 2015.
[14] G. E. Hinton, N. Srivastava, A. Krizhevsky, I. Sutskever, and R. R. Salakhutdinov. Improving neural networks by preventing coadaptation of feature detectors. arXiv:1207.0580, 2012.
[15] S. Hochreiter and J. Schmidhuber. Long short-term memory. Neural computation, 9(8):1735–1780, 1997.
[16] S. Ioffe and C. Szegedy. Batch normalization: Accelerating deep network training by reducing internal covariate shift. In ICML, 2015.
[17] H. Jegou, M. Douze, and C. Schmid. Product quantization for nearest neighbor search. TPAMI, 33, 2011.
[18] H. Jegou, F. Perronnin, M. Douze, J. Sanchez, P. Perez, and C. Schmid. Aggregating local image descriptors into compact codes. TPAMI, 2012.
[19] Y. Jia, E. Shelhamer, J. Donahue, S. Karayev, J. Long, R. Girshick, S. Guadarrama, and T. Darrell. Caffe: Convolutional architecture for fast feature embedding. arXiv:1408.5093, 2014.
[20] A. Krizhevsky. Learning multiple layers of features from tiny images. Tech Report, 2009.
[21] A. Krizhevsky, I. Sutskever, and G. Hinton. Imagenet classification with deep convolutional neural networks. In NIPS, 2012.
[22] Y. LeCun, B. Boser, J. S. Denker, D. Henderson, R. E. Howard, W. Hubbard, and L. D. Jackel. Backpropagation applied to handwritten zip code recognition. Neural computation, 1989.
[23] Y. LeCun, L. Bottou, G. B. Orr, and K.-R. Müller. Efficient backprop. In Neural Networks: Tricks of the Trade, pages 9–50. Springer, 1998.
[24] C.-Y. Lee, S. Xie, P. Gallagher, Z. Zhang, and Z. Tu. Deeply-supervised nets. arXiv:1409.5185, 2014.
[25] M. Lin, Q. Chen, and S. Yan. Network in network. arXiv:1312.4400, 2013.
[26] T.-Y. Lin, M. Maire, S. Belongie, J. Hays, P. Perona, D. Ramanan, P. Dollár, and C. L. Zitnick. Microsoft COCO: Common objects in context. In ECCV. 2014.
[27] J. Long, E. Shelhamer, and T. Darrell. Fully convolutional networks for semantic segmentation. In CVPR, 2015.
[28] G. Montúfar, R. Pascanu, K. Cho, and Y. Bengio. On the number of linear regions of deep neural networks. In NIPS, 2014.
[29] V. Nair and G. E. Hinton. Rectified linear units improve restricted boltzmann machines. In ICML, 2010.
[30] F. Perronnin and C. Dance. Fisher kernels on visual vocabularies for image categorization. In CVPR, 2007.
[31] T. Raiko, H. Valpola, and Y. LeCun. Deep learning made easier by linear transformations in perceptrons. In AISTATS, 2012.
[32] S. Ren, K. He, R. Girshick, and J. Sun. Faster R-CNN: Towards real-time object detection with region proposal networks. In NIPS, 2015.
[33] S. Ren, K. He, R. Girshick, X. Zhang, and J. Sun. Object detection networks on convolutional feature maps. arXiv:1504.06066, 2015.
[34] B. D. Ripley. Pattern recognition and neural networks. Cambridge university press, 1996.
[35] A. Romero, N. Ballas, S. E. Kahou, A. Chassang, C. Gatta, and Y. Bengio. Fitnets: Hints for thin deep nets. In ICLR, 2015.
[36] O. Russakovsky, J. Deng, H. Su, J. Krause, S. Satheesh, S. Ma, Z. Huang, A. Karpathy, A. Khosla, M. Bernstein, et al. Imagenet large scale visual recognition challenge. arXiv:1409.0575, 2014.
[37] A. M. Saxe, J. L. McClelland, and S. Ganguli. Exact solutions to the nonlinear dynamics of learning in deep linear neural networks. arXiv:1312.6120, 2013.
[38] N. N. Schraudolph. Accelerated gradient descent by factor-centering decomposition. Technical report, 1998.
[39] N. N. Schraudolph. Centering neural network gradient factors. In Neural Networks: Tricks of the Trade, pages 207–226. Springer, 1998.
[40] P. Sermanet, D. Eigen, X. Zhang, M. Mathieu, R. Fergus, and Y. LeCun. Overfeat: Integrated recognition, localization and detection using convolutional networks. In ICLR, 2014.
[41] K. Simonyan and A. Zisserman. Very deep convolutional networks for large-scale image recognition. In ICLR, 2015.
[42] R. K. Srivastava, K. Greff, and J. Schmidhuber. Highway networks. arXiv:1505.00387, 2015.
[43] R. K. Srivastava, K. Greff, and J. Schmidhuber. Training very deep networks. 1507.06228, 2015.
[44] C. Szegedy, W. Liu, Y. Jia, P. Sermanet, S. Reed, D. Anguelov, D. Erhan, V. Vanhoucke, and A. Rabinovich. Going deeper with convolutions. In CVPR, 2015.
[45] R. Szeliski. Fast surface interpolation using hierarchical basis functions. TPAMI, 1990.
[46] R. Szeliski. Locally adapted hierarchical basis preconditioning. In SIGGRAPH, 2006.
[47] T. Vatanen, T. Raiko, H. Valpola, and Y. LeCun. Pushing stochastic gradient towards second-order methods–backpropagation learning with transformations in nonlinearities. In Neural Information Processing, 2013.
[48] A. Vedaldi and B. Fulkerson. VLFeat: An open and portable library of computer vision algorithms, 2008.
[49] W. Venables and B. Ripley. Modern applied statistics with s-plus. 1999.
[50] M. D. Zeiler and R. Fergus. Visualizing and understanding convolutional neural networks. In ECCV, 2014.
A. Object Detection Baselines
A. 目标检测基线
In this section we introduce our detection method based on the baseline Faster R-CNN [32] system. The models are initialized by the ImageNet classification models, and then fine-tuned on the object detection data. We have experimented with ResNet-50/101 at the time of the ILSVRC & COCO 2015 detection competitions.
本节介绍我们基于基线 Faster R-CNN [32] 系统的检测方法。模型用 ImageNet 分类模型初始化,再在目标检测数据上微调。在 ILSVRC 和 COCO 2015 检测竞赛期间,我们试验了 ResNet-50/101。
Unlike VGG-16 used in [32], our ResNet has no hidden fc layers. We adopt the idea of “Networks on Conv feature maps” (NoC) [33] to address this issue. We compute the full-image shared conv feature maps using those layers whose strides on the image are no greater than 16 pixels (i.e., conv1, conv2_x, conv3_x, and conv4_x, totally 91 conv layers in ResNet-101; Table 1). We consider these layers as analogous to the 13 conv layers in VGG-16, and by doing so, both ResNet and VGG-16 have conv feature maps of the same total stride (16 pixels). These layers are shared by a region proposal network (RPN, generating 300 proposals) [32] and a Fast R-CNN detection network [7]. RoI pooling [7] is performed before conv5_1. On this RoI-pooled feature, all layers of conv5_x and up are adopted for each region, playing the roles of VGG-16’s fc layers. The final classification layer is replaced by two sibling layers (classification and box regression [7]).
与 [32] 中使用的 VGG-16 不同,我们的 ResNet 没有隐藏的全连接层。我们采用“卷积特征图上的网络”(NoC)[33] 的思路来处理这个问题。我们用在图像上步长不超过 16 像素的那些层(即 conv1、conv2_x、conv3_x 和 conv4_x,在 ResNet-101 中共 91 个卷积层;表 1)计算整幅图像共享的卷积特征图。我们把这些层看作类似于 VGG-16 中的 13 个卷积层,这样 ResNet 和 VGG-16 的卷积特征图具有相同的总步长(16 像素)。这些层由区域建议网络(RPN,生成 300 个建议框)[32] 和 Fast R-CNN 检测网络 [7] 共享。RoI 池化 [7] 在 conv5_1 之前进行。在 RoI 池化后的特征上,对每个区域使用 conv5_x 及以上的所有层,起到 VGG-16 全连接层的作用。最后的分类层换成两个并列的层(分类和边框回归 [7])。
For the usage of BN layers, after pre-training, we compute the BN statistics (means and variances) for each layer on the ImageNet training set. Then the BN layers are fixed during fine-tuning for object detection. As such, the BN layers become linear activations with constant offsets and scales, and BN statistics are not updated by fine-tuning. We fix the BN layers mainly for reducing memory consumption in Faster R-CNN training.
关于 BN 层的使用:预训练之后,我们在 ImageNet 训练集上计算每层的 BN 统计量(均值和方差),然后在为目标检测微调时固定 BN 层。这样 BN 层就成为具有常数偏移和缩放的线性激活,其统计量不会因微调而更新。我们固定 BN 层主要是为了减少 Faster R-CNN 训练中的内存消耗。
PASCAL VOC Following [7, 32], for the PASCAL VOC 2007 test set, we use the 5k trainval images in VOC 2007 and 16k trainval images in VOC 2012 for training (“07+12”). For the PASCAL VOC 2012 test set, we use the 10k trainval+test images in VOC 2007 and 16k trainval images in VOC 2012 for training (“07++12”). The hyper-parameters for training Faster R-CNN are the same as in [32]. Table 7 shows the results. ResNet-101 improves the mAP by >3% over VGG-16. This gain is solely because of the improved features learned by ResNet.
PASCAL VOC 按照 [7, 32],对 PASCAL VOC 2007 test 集,我们用 VOC 2007 的 5k 张 trainval 图像和 VOC 2012 的 16k 张 trainval 图像训练(“07+12”)。对 PASCAL VOC 2012 test 集,我们用 VOC 2007 的 10k 张 trainval+test 图像和 VOC 2012 的 16k 张 trainval 图像训练(“07++12”)。训练 Faster R-CNN 的超参数与 [32] 相同。结果见表 7。ResNet-101 比 VGG-16 的 mAP 提高了 3% 以上,这一提升完全来自 ResNet 学到的更好的特征。
MS COCO The MS COCO dataset [26] involves 80 object categories. We evaluate the PASCAL VOC metric (mAP @ IoU = 0.5) and the standard COCO metric (mAP @ IoU = .5:.05:.95). We use the 80k images on the train set for training and the 40k images on the val set for evaluation. Our detection system for COCO is similar to that for PASCAL VOC. We train the COCO models with an 8-GPU implementation, and thus the RPN step has a mini-batch size of 8 images (i.e., 1 per GPU) and the Fast R-CNN step has a mini-batch size of 16 images. The RPN step and Fast R-CNN step are both trained for 240k iterations with a learning rate of 0.001 and then for 80k iterations with 0.0001.
MS COCO MS COCO 数据集 [26] 包含 80 个物体类别。我们评估 PASCAL VOC 指标(IoU = 0.5 时的 mAP)和 COCO 标准指标(IoU = .5:.05:.95 时的 mAP)。用 train 集的 80k 张图像训练,用 val 集的 40k 张图像评估。COCO 上的检测系统与 PASCAL VOC 上的类似。我们用 8 块 GPU 训练 COCO 模型,因此 RPN 阶段的小批量为 8 张图像(每块 GPU 1 张),Fast R-CNN 阶段的小批量为 16 张图像。RPN 阶段和 Fast R-CNN 阶段都先以 0.001 的学习率训练 240k 次迭代,再以 0.0001 训练 80k 次迭代。
Table 8 shows the results on the MS COCO validation set. ResNet-101 has a 6% increase of mAP@[.5, .95] over VGG-16, which is a 28% relative improvement, solely contributed by the features learned by the better network. Remarkably, the mAP@[.5, .95]’s absolute increase (6.0%) is nearly as big as mAP@.5’s (6.9%). This suggests that a deeper network can improve both recognition and localization.
表 8 给出 MS COCO 验证集上的结果。ResNet-101 的 mAP@[.5, .95] 比 VGG-16 高 6%,相对提升 28%,完全由更好的网络学到的特征带来。值得注意的是,mAP@[.5, .95] 的绝对提升(6.0%)几乎和 mAP@.5 的(6.9%)一样大,说明更深的网络能同时改善识别和定位。
B. Object Detection Improvements
B. 目标检测的改进
For completeness, we report the improvements made for the competitions. These improvements are based on deep features and thus should benefit from residual learning.
为完整起见,我们报告为参加竞赛所做的改进。这些改进建立在深度特征之上,因此应当受益于残差学习。
MS COCO Box refinement. Our box refinement partially follows the iterative localization in [6]. In Faster R-CNN, the final output is a regressed box that is different from its proposal box. So for inference, we pool a new feature from the regressed box and obtain a new classification score and a new regressed box. We combine these 300 new predictions with the original 300 predictions. Non-maximum suppression (NMS) is applied on the union set of predicted boxes using an IoU threshold of 0.3 [8], followed by box voting [6]. Box refinement improves mAP by about 2 points (Table 9).
MS COCO 边框精修。 我们的边框精修部分沿用了 [6] 中的迭代定位。在 Faster R-CNN 中,最终输出是一个与建议框不同的回归框。因此推理时,我们从回归框池化出新的特征,得到新的分类得分和新的回归框,再把这 300 个新预测与原来的 300 个预测合并。对预测框的并集用 0.3 的 IoU 阈值做非极大值抑制(NMS)[8],随后进行边框投票 [6]。边框精修使 mAP 提高约 2 个点(表 9)。
Global context. We combine global context in the Fast R-CNN step. Given the full-image conv feature map, we pool a feature by global Spatial Pyramid Pooling [12] (with a “single-level” pyramid) which can be implemented as “RoI” pooling using the entire image’s bounding box as the RoI. This pooled feature is fed into the post-RoI layers to obtain a global context feature. This global feature is concatenated with the original per-region feature, followed by the sibling classification and box regression layers. This new structure is trained end-to-end. Global context improves mAP@.5 by about 1 point (Table 9).
全局上下文。 我们在 Fast R-CNN 阶段结合了全局上下文。给定整幅图像的卷积特征图,用全局空间金字塔池化 [12](采用“单层”金字塔)池化出一个特征,这可以实现为以整幅图像的边框作为 RoI 的“RoI”池化。这个池化特征送入 RoI 之后的各层,得到全局上下文特征,再与原有的每个区域的特征拼接,后接并列的分类层和边框回归层。这一新结构端到端训练。全局上下文使 mAP@.5 提高约 1 个点(表 9)。
Multi-scale testing. In the above, all results are obtained by single-scale training/testing as in [32], where the image’s shorter side is pixels. Multi-scale training/testing has been developed in [12, 7] by selecting a scale from a feature pyramid, and in [33] by using maxout layers. In our current implementation, we have performed multi-scale testing following [33]; we have not performed multi-scale training because of limited time. In addition, we have performed multi-scale testing only for the Fast R-CNN step (but not yet for the RPN step). With a trained model, we compute conv feature maps on an image pyramid, where the image’s shorter sides are . We select two adjacent scales from the pyramid following [33]. RoI pooling and subsequent layers are performed on the feature maps of these two scales [33], which are merged by maxout as in [33]. Multi-scale testing improves the mAP by over 2 points (Table 9).
多尺度测试。 以上所有结果都按 [32] 采用单尺度训练/测试,图像短边 像素。[12, 7] 通过从特征金字塔中选择尺度、[33] 通过使用 maxout 层,发展了多尺度训练/测试。在目前的实现中,我们按 [33] 做了多尺度测试;由于时间有限,没有做多尺度训练。此外,我们只对 Fast R-CNN 阶段做了多尺度测试(RPN 阶段尚未做)。对训练好的模型,我们在图像金字塔上计算卷积特征图,图像短边 。按 [33] 从金字塔中选两个相邻尺度,在这两个尺度的特征图上进行 RoI 池化及后续各层 [33],再按 [33] 用 maxout 合并。多尺度测试使 mAP 提高 2 个点以上(表 9)。
Using validation data. Next we use the 80k+40k trainval set for training and the 20k test-dev set for evaluation. The test-dev set has no publicly available ground truth and the result is reported by the evaluation server. Under this setting, the results are an mAP@.5 of 55.7% and an mAP@[.5, .95] of 34.9% (Table 9). This is our single-model result.
使用验证数据。 接下来我们用 80k+40k 的 trainval 集训练,用 20k 的 test-dev 集评估。test-dev 集没有公开的真值,结果由评估服务器报告。在这种设置下,mAP@.5 为 55.7%,mAP@[.5, .95] 为 34.9%(表 9)。这是我们的单模型结果。
Ensemble. In Faster R-CNN, the system is designed to learn region proposals and also object classifiers, so an ensemble can be used to boost both tasks. We use an ensemble for proposing regions, and the union set of proposals are processed by an ensemble of per-region classifiers. Table 9 shows our result based on an ensemble of 3 networks. The mAP is 59.0% and 37.4% on the test-dev set. This result won the 1st place in the detection task in COCO 2015.
集成。 Faster R-CNN 系统既学习区域建议,也学习物体分类器,因此集成可以同时提升这两项任务。我们用一个集成来生成区域建议,建议框的并集再由一组按区域分类的分类器集成来处理。表 9 给出了基于 3 个网络集成的结果:test-dev 集上的 mAP 为 59.0% 和 37.4%。这一结果获得了 COCO 2015 检测任务第一名。
PASCAL VOC We revisit the PASCAL VOC dataset based on the above model. With the single model on the COCO dataset (55.7% mAP@.5 in Table 9), we fine-tune this model on the PASCAL VOC sets. The improvements of box refinement, context, and multi-scale testing are also adopted. By doing so we achieve 85.6% mAP on PASCAL VOC 2007 (Table 10) and 83.8% on PASCAL VOC 2012 (Table 11)⁶. The result on PASCAL VOC 2012 is 10 points higher than the previous state-of-the-art result [6].
PASCAL VOC 我们基于上述模型重新考察 PASCAL VOC 数据集。把 COCO 数据集上的单模型(表 9 中 mAP@.5 为 55.7%)在 PASCAL VOC 数据上微调,同时采用边框精修、上下文和多尺度测试这几项改进。这样我们在 PASCAL VOC 2007 上取得 85.6% 的 mAP(表 10),在 PASCAL VOC 2012 上取得 83.8%(表 11)⁶。PASCAL VOC 2012 上的结果比此前最好的结果 [6] 高 10 个点。
| training data | COCO train | COCO train | COCO trainval | COCO trainval |
|---|---|---|---|---|
| test data | COCO val | COCO val | COCO test-dev | COCO test-dev |
| mAP | @.5 | @[.5, .95] | @.5 | @[.5, .95] |
| baseline Faster R-CNN (VGG-16) | 41.5 | 21.2 | ||
| baseline Faster R-CNN (ResNet-101) | 48.4 | 27.2 | ||
| +box refinement | 49.9 | 29.9 | ||
| +context | 51.1 | 30.0 | 53.3 | 32.2 |
| +multi-scale testing | 53.8 | 32.5 | 55.7 | 34.9 |
| ensemble | 59.0 | 37.4 |
Table 9. Object detection improvements on MS COCO using Faster R-CNN and ResNet-101.
| 训练数据 | COCO train | COCO train | COCO trainval | COCO trainval |
|---|---|---|---|---|
| 测试数据 | COCO val | COCO val | COCO test-dev | COCO test-dev |
| mAP | @.5 | @[.5, .95] | @.5 | @[.5, .95] |
| 基线 Faster R-CNN(VGG-16) | 41.5 | 21.2 | ||
| 基线 Faster R-CNN(ResNet-101) | 48.4 | 27.2 | ||
| +边框精修 | 49.9 | 29.9 | ||
| +上下文 | 51.1 | 30.0 | 53.3 | 32.2 |
| +多尺度测试 | 53.8 | 32.5 | 55.7 | 34.9 |
| 集成 | 59.0 | 37.4 |
表 9 使用 Faster R-CNN 和 ResNet-101 在 MS COCO 上的目标检测改进。
| system | net | data | mAP | areo | bike | bird | boat | bottle | bus | car | cat | chair | cow | table | dog | horse | mbike | person | plant | sheep | sofa | train | tv |
|---|---|---|---|---|---|---|---|---|---|---|---|---|---|---|---|---|---|---|---|---|---|---|---|
| baseline | VGG-16 | 07+12 | 73.2 | 76.5 | 79.0 | 70.9 | 65.5 | 52.1 | 83.1 | 84.7 | 86.4 | 52.0 | 81.9 | 65.7 | 84.8 | 84.6 | 77.5 | 76.7 | 38.8 | 73.6 | 73.9 | 83.0 | 72.6 |
| baseline | ResNet-101 | 07+12 | 76.4 | 79.8 | 80.7 | 76.2 | 68.3 | 55.9 | 85.1 | 85.3 | 89.8 | 56.7 | 87.8 | 69.4 | 88.3 | 88.9 | 80.9 | 78.4 | 41.7 | 78.6 | 79.8 | 85.3 | 72.0 |
| baseline+++ | ResNet-101 | COCO+07+12 | 85.6 | 90.0 | 89.6 | 87.8 | 80.8 | 76.1 | 89.9 | 89.9 | 89.6 | 75.5 | 90.0 | 80.7 | 89.6 | 90.3 | 89.1 | 88.7 | 65.4 | 88.1 | 85.6 | 89.0 | 86.8 |
Table 10. Detection results on the PASCAL VOC 2007 test set. The baseline is the Faster R-CNN system. The system “baseline+++” include box refinement, context, and multi-scale testing in Table 9.
| 系统 | 网络 | 数据 | mAP | areo | bike | bird | boat | bottle | bus | car | cat | chair | cow | table | dog | horse | mbike | person | plant | sheep | sofa | train | tv |
|---|---|---|---|---|---|---|---|---|---|---|---|---|---|---|---|---|---|---|---|---|---|---|---|
| 基线 | VGG-16 | 07+12 | 73.2 | 76.5 | 79.0 | 70.9 | 65.5 | 52.1 | 83.1 | 84.7 | 86.4 | 52.0 | 81.9 | 65.7 | 84.8 | 84.6 | 77.5 | 76.7 | 38.8 | 73.6 | 73.9 | 83.0 | 72.6 |
| 基线 | ResNet-101 | 07+12 | 76.4 | 79.8 | 80.7 | 76.2 | 68.3 | 55.9 | 85.1 | 85.3 | 89.8 | 56.7 | 87.8 | 69.4 | 88.3 | 88.9 | 80.9 | 78.4 | 41.7 | 78.6 | 79.8 | 85.3 | 72.0 |
| baseline+++ | ResNet-101 | COCO+07+12 | 85.6 | 90.0 | 89.6 | 87.8 | 80.8 | 76.1 | 89.9 | 89.9 | 89.6 | 75.5 | 90.0 | 80.7 | 89.6 | 90.3 | 89.1 | 88.7 | 65.4 | 88.1 | 85.6 | 89.0 | 86.8 |
表 10 PASCAL VOC 2007 测试集上的检测结果(类别名保留原文,“areo”为原文拼写)。基线为 Faster R-CNN 系统。“baseline+++”系统包含表 9 中的边框精修、上下文和多尺度测试。
| system | net | data | mAP | areo | bike | bird | boat | bottle | bus | car | cat | chair | cow | table | dog | horse | mbike | person | plant | sheep | sofa | train | tv |
|---|---|---|---|---|---|---|---|---|---|---|---|---|---|---|---|---|---|---|---|---|---|---|---|
| baseline | VGG-16 | 07++12 | 70.4 | 84.9 | 79.8 | 74.3 | 53.9 | 49.8 | 77.5 | 75.9 | 88.5 | 45.6 | 77.1 | 55.3 | 86.9 | 81.7 | 80.9 | 79.6 | 40.1 | 72.6 | 60.9 | 81.2 | 61.5 |
| baseline | ResNet-101 | 07++12 | 73.8 | 86.5 | 81.6 | 77.2 | 58.0 | 51.0 | 78.6 | 76.6 | 93.2 | 48.6 | 80.4 | 59.0 | 92.1 | 85.3 | 84.8 | 80.7 | 48.1 | 77.3 | 66.5 | 84.7 | 65.6 |
| baseline+++ | ResNet-101 | COCO+07++12 | 83.8 | 92.1 | 88.4 | 84.8 | 75.9 | 71.4 | 86.3 | 87.8 | 94.2 | 66.8 | 89.4 | 69.2 | 93.9 | 91.9 | 90.9 | 89.6 | 67.9 | 88.2 | 76.8 | 90.3 | 80.0 |
Table 11. Detection results on the PASCAL VOC 2012 test set (http://host.robots.ox.ac.uk:8080/leaderboard/displaylb.php?challengeid=11&compid=4). The baseline is the Faster R-CNN system. The system “baseline+++” include box refinement, context, and multi-scale testing in Table 9.
| 系统 | 网络 | 数据 | mAP | areo | bike | bird | boat | bottle | bus | car | cat | chair | cow | table | dog | horse | mbike | person | plant | sheep | sofa | train | tv |
|---|---|---|---|---|---|---|---|---|---|---|---|---|---|---|---|---|---|---|---|---|---|---|---|
| 基线 | VGG-16 | 07++12 | 70.4 | 84.9 | 79.8 | 74.3 | 53.9 | 49.8 | 77.5 | 75.9 | 88.5 | 45.6 | 77.1 | 55.3 | 86.9 | 81.7 | 80.9 | 79.6 | 40.1 | 72.6 | 60.9 | 81.2 | 61.5 |
| 基线 | ResNet-101 | 07++12 | 73.8 | 86.5 | 81.6 | 77.2 | 58.0 | 51.0 | 78.6 | 76.6 | 93.2 | 48.6 | 80.4 | 59.0 | 92.1 | 85.3 | 84.8 | 80.7 | 48.1 | 77.3 | 66.5 | 84.7 | 65.6 |
| baseline+++ | ResNet-101 | COCO+07++12 | 83.8 | 92.1 | 88.4 | 84.8 | 75.9 | 71.4 | 86.3 | 87.8 | 94.2 | 66.8 | 89.4 | 69.2 | 93.9 | 91.9 | 90.9 | 89.6 | 67.9 | 88.2 | 76.8 | 90.3 | 80.0 |
表 11 PASCAL VOC 2012 测试集上的检测结果(http://host.robots.ox.ac.uk:8080/leaderboard/displaylb.php?challengeid=11&compid=4)。基线为 Faster R-CNN 系统。“baseline+++”系统包含表 9 中的边框精修、上下文和多尺度测试。
⁶ http://host.robots.ox.ac.uk:8080/anonymous/3OJ4OJ.html, submitted on 2015-11-26.
⁶ http://host.robots.ox.ac.uk:8080/anonymous/3OJ4OJ.html,2015 年 11 月 26 日提交。
ImageNet Detection The ImageNet Detection (DET) task involves 200 object categories. The accuracy is evaluated by mAP@.5. Our object detection algorithm for ImageNet DET is the same as that for MS COCO in Table 9. The networks are pre-trained on the 1000-class ImageNet classification set, and are fine-tuned on the DET data. We split the validation set into two parts (val1/val2) following [8]. We fine-tune the detection models using the DET training set and the val1 set. The val2 set is used for validation. We do not use other ILSVRC 2015 data. Our single model with ResNet-101 has 58.8% mAP and our ensemble of 3 models has 62.1% mAP on the DET test set (Table 12). This result won the 1st place in the ImageNet detection task in ILSVRC 2015, surpassing the second place by 8.5 points (absolute).
ImageNet 检测 ImageNet 检测(DET)任务包含 200 个物体类别,以 mAP@.5 评估精度。我们用于 ImageNet DET 的目标检测算法与表 9 中用于 MS COCO 的相同。网络在 1000 类 ImageNet 分类数据上预训练,再在 DET 数据上微调。按照 [8],我们把验证集分成两部分(val1/val2),用 DET 训练集和 val1 集微调检测模型,用 val2 集做验证,没有使用其他 ILSVRC 2015 数据。在 DET 测试集上,我们基于 ResNet-101 的单模型 mAP 为 58.8%,3 个模型的集成为 62.1%(表 12)。这一结果获得了 ILSVRC 2015 ImageNet 检测任务第一名,比第二名高 8.5 个点(绝对值)。
| val2 | test | |
|---|---|---|
| GoogLeNet [44] (ILSVRC’14) | - | 43.9 |
| our single model (ILSVRC’15) | 60.5 | 58.8 |
| our ensemble (ILSVRC’15) | 63.6 | 62.1 |
Table 12. Our results (mAP, %) on the ImageNet detection dataset. Our detection system is Faster R-CNN [32] with the improvements in Table 9, using ResNet-101.
| val2 | test | |
|---|---|---|
| GoogLeNet [44] (ILSVRC’14) | - | 43.9 |
| 我们的单模型(ILSVRC’15) | 60.5 | 58.8 |
| 我们的集成(ILSVRC’15) | 63.6 | 62.1 |
表 12 我们在 ImageNet 检测数据集上的结果(mAP,%)。检测系统为带有表 9 中各项改进的 Faster R-CNN [32],使用 ResNet-101。
C. ImageNet Localization
C. ImageNet 定位
The ImageNet Localization (LOC) task [36] requires to classify and localize the objects. Following [40, 41], we assume that the image-level classifiers are first adopted for predicting the class labels of an image, and the localization algorithm only accounts for predicting bounding boxes based on the predicted classes. We adopt the “per-class regression” (PCR) strategy [40, 41], learning a bounding box regressor for each class. We pre-train the networks for ImageNet classification and then fine-tune them for localization. We train networks on the provided 1000-class ImageNet training set.
ImageNet 定位(LOC)任务 [36] 要求对物体进行分类和定位。按照 [40, 41],我们假定先用图像级分类器预测图像的类别标签,定位算法只负责根据预测的类别预测边框。我们采用“逐类回归”(PCR)策略 [40, 41],为每个类别学习一个边框回归器。网络先为 ImageNet 分类预训练,再为定位微调,训练使用所提供的 1000 类 ImageNet 训练集。
Our localization algorithm is based on the RPN framework of [32] with a few modifications. Unlike the way in [32] that is category-agnostic, our RPN for localization is designed in a per-class form. This RPN ends with two sibling 1×1 convolutional layers for binary classification (cls) and box regression (reg), as in [32]. The cls and reg layers are both in a per-class from, in contrast to [32]. Specifically, the cls layer has a 1000-d output, and each dimension is binary logistic regression for predicting being or not being an object class; the reg layer has a 1000×4-d output consisting of box regressors for 1000 classes. As in [32], our bounding box regression is with reference to multiple translation-invariant “anchor” boxes at each position.
我们的定位算法基于 [32] 的 RPN 框架,并做了几处修改。与 [32] 中与类别无关的做法不同,我们用于定位的 RPN 设计成逐类形式。和 [32] 一样,这个 RPN 最后是两个并列的 1×1 卷积层,分别用于二分类(cls)和边框回归(reg)。与 [32] 不同的是,cls 层和 reg 层都是逐类的。具体来说,cls 层有 1000 维输出,每一维是一个二元逻辑回归,预测是否属于某个物体类别;reg 层有 1000×4 维输出,由 1000 个类别的边框回归器组成。与 [32] 一样,我们的边框回归以每个位置上多个平移不变的“锚”框为参照。
As in our ImageNet classification training (Sec. 3.4), we randomly sample 224×224 crops for data augmentation. We use a mini-batch size of 256 images for fine-tuning. To avoid negative samples being dominate, 8 anchors are randomly sampled for each image, where the sampled positive and negative anchors have a ratio of 1:1 [32]. For testing, the network is applied on the image fully-convolutionally.
与 ImageNet 分类训练(第 3.4 节)一样,我们随机裁取 224×224 的区域做数据增强。微调时小批量为 256 张图像。为避免负样本占主导,每张图像随机采样 8 个锚框,其中正负锚框比例为 1:1 [32]。测试时,网络以全卷积方式作用于图像。
| LOC method | LOC network | testing | LOC error on GT CLS | classification network | top-5 LOC error on predicted CLS |
|---|---|---|---|---|---|
| VGG’s [41] | VGG-16 | 1-crop | 33.1 [41] | ||
| RPN | ResNet-101 | 1-crop | 13.3 | ||
| RPN | ResNet-101 | dense | 11.7 | ||
| RPN | ResNet-101 | dense | ResNet-101 | 14.4 | |
| RPN+RCNN | ResNet-101 | dense | ResNet-101 | 10.6 | |
| RPN+RCNN | ensemble | dense | ensemble | 8.9 |
Table 13. Localization error (%) on the ImageNet validation. In the column of “LOC error on GT class” ([41]), the ground truth class is used. In the “testing” column, “1-crop” denotes testing on a center crop of 224×224 pixels, “dense” denotes dense (fully convolutional) and multi-scale testing.
| 定位方法 | 定位网络 | 测试方式 | 给定真实类别的定位误差 | 分类网络 | 预测类别下的 top-5 定位误差 |
|---|---|---|---|---|---|
| VGG 的方法 [41] | VGG-16 | 1-crop | 33.1 [41] | ||
| RPN | ResNet-101 | 1-crop | 13.3 | ||
| RPN | ResNet-101 | dense | 11.7 | ||
| RPN | ResNet-101 | dense | ResNet-101 | 14.4 | |
| RPN+RCNN | ResNet-101 | dense | ResNet-101 | 10.6 | |
| RPN+RCNN | 集成 | dense | 集成 | 8.9 |
表 13 ImageNet 验证集上的定位误差(%)。“给定真实类别的定位误差”一列([41])使用真实类别。“测试方式”一列中,“1-crop”表示在 224×224 像素的中心裁剪上测试,“dense”表示密集(全卷积)多尺度测试。
Table 13 compares the localization results. Following [41], we first perform “oracle” testing using the ground truth class as the classification prediction. VGG’s paper [41] reports a center-crop error of 33.1% (Table 13) using ground truth classes. Under the same setting, our RPN method using ResNet-101 net significantly reduces the center-crop error to 13.3%. This comparison demonstrates the excellent performance of our framework. With dense (fully convolutional) and multi-scale testing, our ResNet-101 has an error of 11.7% using ground truth classes. Using ResNet-101 for predicting classes (4.6% top-5 classification error, Table 4), the top-5 localization error is 14.4%.
表 13 比较了定位结果。按照 [41],我们先做“神谕”测试,即把真实类别当作分类预测。VGG 的论文 [41] 报告了使用真实类别时 33.1% 的中心裁剪误差(表 13)。在同样设置下,我们使用 ResNet-101 的 RPN 方法把中心裁剪误差大幅降到 13.3%,说明我们的框架性能出色。采用密集(全卷积)多尺度测试时,我们的 ResNet-101 在使用真实类别的情况下误差为 11.7%。用 ResNet-101 预测类别(top-5 分类错误率 4.6%,表 4)时,top-5 定位误差为 14.4%。
The above results are only based on the proposal network (RPN) in Faster R-CNN [32]. One may use the detection network (Fast R-CNN [7]) in Faster R-CNN to improve the results. But we notice that on this dataset, one image usually contains a single dominate object, and the proposal regions highly overlap with each other and thus have very similar RoI-pooled features. As a result, the image-centric training of Fast R-CNN [7] generates samples of small variations, which may not be desired for stochastic training. Motivated by this, in our current experiment we use the original R-CNN [8] that is RoI-centric, in place of Fast R-CNN.
以上结果只基于 Faster R-CNN [32] 中的建议网络(RPN)。也可以用 Faster R-CNN 中的检测网络(Fast R-CNN [7])来改进结果。但我们注意到,在这个数据集上,一张图像通常只包含一个占主导的物体,建议区域彼此高度重叠,因而 RoI 池化后的特征非常相似。结果,Fast R-CNN [7] 以图像为中心的训练产生的样本变化很小,这对随机训练可能不利。因此在目前的实验中,我们用以 RoI 为中心的原始 R-CNN [8] 代替 Fast R-CNN。
Our R-CNN implementation is as follows. We apply the per-class RPN trained as above on the training images to predict bounding boxes for the ground truth class. These predicted boxes play a role of class-dependent proposals. For each training image, the highest scored 200 proposals are extracted as training samples to train an R-CNN classifier. The image region is cropped from a proposal, warped to 224×224 pixels, and fed into the classification network as in R-CNN [8]. The outputs of this network consist of two sibling fc layers for cls and reg, also in a per-class form. This R-CNN network is fine-tuned on the training set using a mini-batch size of 256 in the RoI-centric fashion. For testing, the RPN generates the highest scored 200 proposals for each predicted class, and the R-CNN network is used to update these proposals’ scores and box positions.
我们的 R-CNN 实现如下。把按上述方式训练好的逐类 RPN 作用于训练图像,为真实类别预测边框,这些预测框充当与类别相关的建议框。对每张训练图像,取得分最高的 200 个建议框作为训练样本,用来训练 R-CNN 分类器。和 R-CNN [8] 一样,从建议框中裁出图像区域,变形到 224×224 像素,送入分类网络。网络输出为两个并列的全连接层,分别用于 cls 和 reg,同样是逐类形式。这个 R-CNN 网络以 RoI 为中心的方式、用 256 的小批量在训练集上微调。测试时,RPN 为每个预测类别生成得分最高的 200 个建议框,再用 R-CNN 网络更新这些建议框的得分和边框位置。
This method reduces the top-5 localization error to 10.6% (Table 13). This is our single-model result on the validation set. Using an ensemble of networks for both classification and localization, we achieve a top-5 localization error of 9.0% on the test set. This number significantly outperforms the ILSVRC 14 results (Table 14), showing a 64% relative reduction of error. This result won the 1st place in the ImageNet localization task in ILSVRC 2015.
这一方法把 top-5 定位误差降到 10.6%(表 13),这是我们在验证集上的单模型结果。分类和定位都使用网络集成后,我们在测试集上取得了 9.0% 的 top-5 定位误差。这个数字大幅优于 ILSVRC 14 的结果(表 14),误差相对降低 64%。这一结果获得了 ILSVRC 2015 ImageNet 定位任务第一名。
| method | top-5 localization err (val) | top-5 localization err (test) |
|---|---|---|
| OverFeat [40] (ILSVRC’13) | 30.0 | 29.9 |
| GoogLeNet [44] (ILSVRC’14) | - | 26.7 |
| VGG [41] (ILSVRC’14) | 26.9 | 25.3 |
| ours (ILSVRC’15) | 8.9 | 9.0 |
Table 14. Comparisons of localization error (%) on the ImageNet dataset with state-of-the-art methods.
| 方法 | top-5 定位误差(val) | top-5 定位误差(test) |
|---|---|---|
| OverFeat [40] (ILSVRC’13) | 30.0 | 29.9 |
| GoogLeNet [44] (ILSVRC’14) | - | 26.7 |
| VGG [41] (ILSVRC’14) | 26.9 | 25.3 |
| 我们的方法(ILSVRC’15) | 8.9 | 9.0 |
表 14 ImageNet 数据集上与最先进方法的定位误差(%)比较。