Cascade R-CNN: Delving into High Quality Object Detection
Cascade R-CNN: Delving into High Quality Object Detection
Abstract
In object detection, an intersection over union (IoU) threshold is required to define positives and negatives. An object detector, trained with low IoU threshold, e.g. 0.5, usually produces noisy detections. However, detection performance tends to degrade with increasing the IoU thresholds. Two main factors are responsible for this: 1) overfitting during training, due to exponentially vanishing positive samples, and 2) inference-time mismatch between the IoUs for which the detector is optimal and those of the input hypotheses. A multi-stage object detection architecture, the Cascade R-CNN, is proposed to address these problems. It consists of a sequence of detectors trained with increasing IoU thresholds, to be sequentially more selective against close false positives. The detectors are trained stage by stage, leveraging the observation that the output of a detector is a good distribution for training the next higher quality detector. The resampling of progressively improved hypotheses guarantees that all detectors have a positive set of examples of equivalent size, reducing the overfitting problem. The same cascade procedure is applied at inference, enabling a closer match between the hypotheses and the detector quality of each stage. A simple implementation of the Cascade R-CNN is shown to surpass all single-model object detectors on the challenging COCO dataset. Experiments also show that the Cascade R-CNN is widely applicable across detector architectures, achieving consistent gains independently of the baseline detector strength. The code is available at https://github.com/zhaoweicai/cascade-rcnn.
在目标检测中,需要一个交并比(IoU)阈值来定义正样本和负样本。用较低的 IoU 阈值(例如 0.5)训练的目标检测器,通常会产生较嘈杂的检测结果。然而,随着 IoU 阈值提高,检测性能往往会下降。造成这一点的主要有两个因素:1)训练时过拟合,原因是正样本几乎按指数消失;2)推理时,检测器所适配的 IoU 与输入假设的 IoU 之间存在错配。本文提出一种多阶段目标检测架构 Cascade R-CNN,用来应对这些问题。它由一串以逐步提高的 IoU 阈值训练的检测器组成,从而对近假阳性逐步更加挑剔。这些检测器按阶段依次训练,依据是:一个检测器的输出,是训练下一级更高品质检测器的良好分布。对逐步改进的假设做重采样,可以保证所有检测器都拥有规模相当的正样本集合,从而减轻过拟合。同一套级联程序也用于推理,使假设与每一级的检测器品质更加匹配。实验表明,Cascade R-CNN 的一个简单实现,在有挑战性的 COCO 数据集上超过了所有单模型目标检测器。实验还表明,Cascade R-CNN 可以广泛用于不同的检测器架构,并且收益与基线检测器的强弱无关。代码发布在 https://github.com/zhaoweicai/cascade-rcnn。
1. Introduction
Object detection is a complex problem, requiring the solution of two main tasks. First, the detector must solve the recognition problem, to distinguish foreground objects from background and assign them the proper object class labels. Second, the detector must solve the localization problem, to assign accurate bounding boxes to different objects. Both of these are particularly difficult because the detector faces many “close” false positives, corresponding to “close but not correct” bounding boxes. The detector must find the true positives while suppressing these close false positives.
目标检测是一个复杂问题,需要同时解决两项主要任务。第一,检测器必须完成识别:把前景物体从背景中区分出来,并赋以正确的物体类别标签。第二,检测器必须完成定位:为不同物体赋予准确的边界框。这两件事都特别困难,因为检测器面对着大量“接近”的假阳性,也就是“差一点就不对”的边界框。检测器必须找出真正的正样本,同时压制这些近假阳性。
Many of the recently proposed object detectors are based on the two-stage R-CNN framework [14, 13, 30, 23], where detection is framed as a multi-task learning problem that combines classification and bounding box regression. Unlike object recognition, an intersection over union (IoU) threshold is required to define positives/negatives. However, the commonly used threshold values , typically , establish quite a loose requirement for positives. The resulting detectors frequently produce noisy bounding boxes, as shown in Figure 1 (a). Hypotheses that most humans would consider close false positives frequently pass the test. While the examples assembled under the criterion are rich and diversified, they make it difficult to train detectors that can effectively reject close false positives.
近来提出的许多目标检测器都以两阶段 R-CNN 框架为基础 [14, 13, 30, 23],把检测写成结合分类与边界框回归的多任务学习问题。与物体识别不同,这里需要一个交并比(IoU)阈值来定义正负样本。然而,常用的阈值 ,通常是 ,对正样本的要求相当宽松。由此得到的检测器经常产生较嘈杂的边界框,如图 1(a)所示。多数人会看成近假阳性的假设,常常仍能通过 的检验。按 这一标准收集到的样本虽然丰富而多样,却让检测器很难学会有效拒绝近假阳性。
In this work, we define the quality of an hypothesis as its IoU with the ground truth, and the quality of the detector as the IoU threshold used to train it. The goal is to investigate the, so far, poorly researched problem of learning high quality object detectors, whose outputs contain few close false positives, as shown in Figure 1 (b). The basic idea is that a single detector can only be optimal for a single quality level. This is known in the cost-sensitive learning literature [7, 26], where the optimization of different points of the receiver operating characteristic (ROC) requires different loss functions. The main difference is that we consider the optimization for a given IoU threshold, rather than false positive rate.
在本工作中,我们把一个假设的质量定义成它与真值的 IoU,把检测器的质量定义成训练时所用的 IoU 阈值 。目标是研究一个迄今仍较少被讨论的问题:如何学习高质量的目标检测器,使其输出中只包含很少的近假阳性,如图 1(b)所示。基本想法是:单个检测器只能对单一质量水平达到最优。这一点在代价敏感学习文献中已经为人所知 [7, 26]:要优化受试者工作特征(ROC)上的不同工作点,需要不同的损失函数。主要区别在于,我们考虑的是给定 IoU 阈值下的优化,而不是假阳性率。
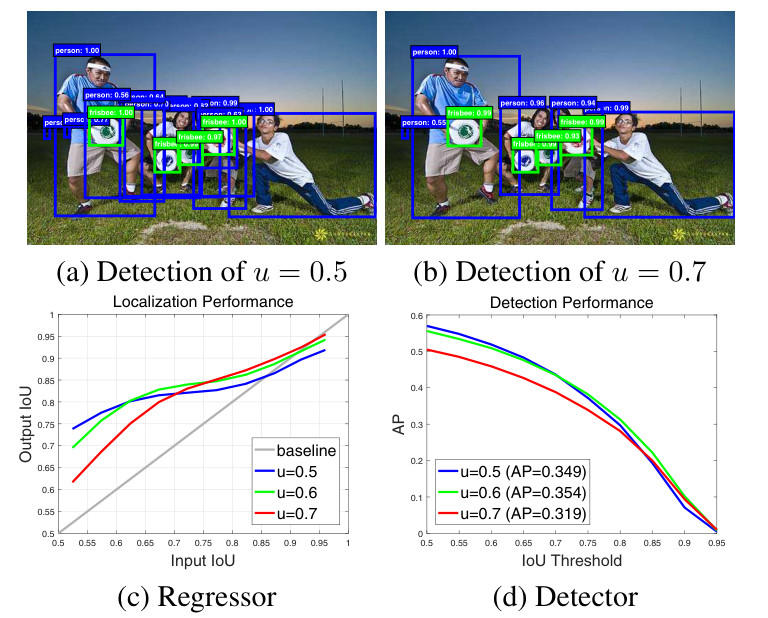
Figure 1. The detection outputs, localization and detection performance of object detectors of increasing IoU threshold .
图 1. 随着 IoU 阈值 提高,目标检测器的检测输出、定位性能与检测性能。
The idea is illustrated by Figure 1 (c) and (d), which present the localization and detection performance, respectively, of three detectors trained with IoU thresholds of , , . The localization performance is evaluated as a function of the IoU of the input proposals, and the detection performance as a function of IoU threshold, as in COCO [22]. Note that, in Figure 1 (c), each bounding box regressor performs best for examples of IoU close to the threshold that the detector was trained. This also holds for detection performance, up to overfitting. Figure 1 (d) shows that, the detector of outperforms the detector of for low IoU examples, underperforming it at higher IoU levels. In general, a detector optimized at a single IoU level is not necessarily optimal at other levels.
这一想法由图 1(c)和(d)说明,它们分别给出了以 IoU 阈值 、、 训练的三个检测器的定位性能和检测性能。定位性能按输入提议的 IoU 来评估,检测性能则按 IoU 阈值来评估,与 COCO [22] 一致。需要注意的是,在图 1(c)中,每个边界框回归器在 IoU 接近该检测器训练阈值的样本上表现最好。这一点对检测性能同样成立,直到出现过拟合。图 1(d)表明, 的检测器在低 IoU 样本上优于 的检测器,但在更高 IoU 水平上则不如后者。一般而言,在单一 IoU 水平上优化的检测器,并不一定在其他水平上最优。
These observations suggest that higher quality detection requires a closer quality match between the detector and the hypotheses that it processes. In general, a detector can only have high quality if presented with high quality proposals. However, to produce a high quality detector, it does not suffice to simply increase during training. In fact, as seen for the detector of of Figure 1 (d), this can degrade detection performance. The problem is that the distribution of hypotheses out of a proposal detector is usually heavily imbalanced towards low quality. In general, forcing larger IoU thresholds leads to an exponentially smaller numbers of positive training samples. This is particularly problematic for neural networks, which are known to be very example intensive, and makes the “high ” training strategy quite prone to overfitting.
这些观察表明,更高质量的检测,需要检测器与它所处理的假设在质量上更加匹配。一般说来,只有在面对高质量提议时,检测器才能具备高品质。然而,要得到高品质检测器,仅仅在训练时提高 是不够的。事实上,正如图 1(d)中 的检测器所示,这样做反而可能降低检测性能。问题在于,提议检测器给出的假设分布,通常严重偏向低质量。一般而言,强制使用更大的 IoU 阈值,会使正训练样本的数量几乎按指数减少。这对以样本量为重的神经网络尤其成问题,也使“高 ”训练策略相当容易过拟合。
Another difficulty is the mismatch between the quality of the detector and that of the testing hypotheses at inference. As shown in Figure 1, high quality detectors are only necessarily optimal for high quality hypotheses. The detection could be suboptimal when they are asked to work on the hypotheses of other quality levels.
另一个困难是,推理时检测器的质量与测试假设的质量之间存在错配。如图 1 所示,高质量检测器只在面对高质量假设时才必然最优。若让它们处理其他质量水平的假设,检测可能变得次优。
In this paper, we propose a new detector architecture, Cascade R-CNN, that addresses these problems. It is a multi-stage extension of the R-CNN, where detector stages deeper into the cascade are sequentially more selective against close false positives. The cascade of R-CNN stages are trained sequentially, using the output of one stage to train the next. This is motivated by the observation that the output IoU of a regressor is almost invariably better than the input IoU, in Figure 1 (c), where nearly all plots are above the gray line. It suggests that the output of a detector trained with a certain IoU threshold is a good distribution to train the detector of the next higher IoU threshold.
本文提出一种新的检测器架构 Cascade R-CNN,用来应对这些问题。它是 R-CNN 的多阶段扩展,级联中越靠后的检测阶段,对近假阳性越挑剔。各级 R-CNN 依次训练,用上一级的输出去训练下一级。这受到如下观察的启发:在图 1(c)中,回归器的输出 IoU 几乎总是好于输入 IoU,几乎所有曲线都落在灰线上方。这表明,以某一 IoU 阈值训练的检测器,其输出是训练下一级更高 IoU 阈值检测器的良好分布。
This is similar to boostrapping methods commonly used to assemble datasets in object detection literature [34, 9]. The main difference is that the resampling procedure of the Cascade R-CNN does not aim to mine hard negatives. Instead, by adjusting bounding boxes, each stage aims to find a good set of close false positives for training the next stage. When operating in this manner, a sequence of detectors adapted to increasingly higher IoUs can beat the overfitting problem, and thus be effectively trained. At inference, the same cascade procedure is applied. The progressively improved hypotheses are better matched to the increasing detector quality at each stage. This enables higher detection accuracies, as suggested by Figure 1 (c) and (d).
这与目标检测文献中常用来拼数据集的自助法(文中作 boostrapping)相似 [34, 9]。主要区别在于,Cascade R-CNN 的重采样并不以挖掘难负样本为目的。相反,每一级通过调整边界框,试图为下一级找到一组合适的近假阳性。按这种方式运作,一串适配于逐步提高的 IoU 的检测器就能克服过拟合,从而得到有效训练。推理时采用同一套级联程序。逐步改进的假设,能更好地匹配每一级不断提高的检测器品质。如图 1(c)和(d)所示,这能够带来更高的检测精度。
The Cascade R-CNN is quite simple to implement and trained end-to-end. Our results show that a vanilla implementation, without any bells and whistles, surpasses all previous state-of-the-art single-model detectors by a large margin, on the challenging COCO detection task [22], especially under the higher quality evaluation metrics. In addition, the Cascade R-CNN can be built with any two-stage object detector based on the R-CNN framework. We have observed consistent gains (of points), at a marginal increase in computation. This gain is independent of the strength of the baseline object detectors. We thus believe that this simple and effective detection architecture can be of interest for many object detection research efforts.
Cascade R-CNN 实现起来相当简单,并且是端到端训练的。我们的结果表明,一个不加任何花哨技巧的普通实现,在有挑战性的 COCO 检测任务 [22] 上以较大幅度超过了此前所有最先进的单模型检测器,在更高品质的评价指标下尤其明显。此外,Cascade R-CNN 可以建立在任何基于 R-CNN 框架的两阶段目标检测器之上。我们观察到了稳定的收益(约 个点),而计算量只是略有增加。这一收益与基线目标检测器的强弱无关。因此我们相信,这一简单而有效的检测架构,可以对许多目标检测研究有所帮助。
2. Related Work
Due to the success of the R-CNN [14] architecture, the two-stage detection framework, by combining a proposal detector and a region-wise classifier, has become predominant in the recent past. To reduce redundant CNN computations in the R-CNN for speeds-up, the SPP-Net [17] and Fast R-CNN [13] introduced the idea of region-wise feature extraction. Later, the Faster R-CNN [30] achieved further speeds-up by introducing a Region Proposal Network (RPN). Some more recent works have extended it to address various problems of detail. For example, the R-FCN [4] proposed efficient region-wise fully convolutions without accuracy loss, to avoid the heavy region-wise CNN computations of the Faster R-CNN; while the MS-CNN [1] and FPN [23] detect high-recall proposals at multiple output layers, so as to alleviate the scale mismatch between the RPN receptive fields and actual object size.
由于 R-CNN [14] 架构的成功,把提议检测器与区域分类器结合起来的两阶段检测框架,在近一段时间里占据了主导。为了减少 R-CNN 中冗余的 CNN 计算以加快速度,SPP-Net [17] 和 Fast R-CNN [13] 引入了区域特征提取的想法。随后,Faster R-CNN [30] 通过引入区域提议网络(RPN)进一步加快了速度。一些更新的工作在此基础上扩展,以处理各种细节问题。例如,R-FCN [4] 提出了不损失精度的高效区域全卷积,以避免 Faster R-CNN 中沉重的区域 CNN 计算;而 MS-CNN [1] 和 FPN [23] 则在多个输出层上检测高召回的提议,以缓解 RPN 感受野与实际物体尺度之间的错配。
Alternatively, one-stage object detection architectures have also become popular, mostly due to their computational efficiency. YOLO [29] outputs very sparse detection results and enables real time object detection, by forwarding the input image once through an efficient backbone network. SSD [25] detects objects in a way similar to the RPN [30], but uses multiple feature maps at different resolutions to cover objects at various scales. Their main limitation is that their accuracies are typically below that of two-stage detectors. Recently, RetinaNet [24] was proposed to address the extreme foreground-background class imbalance in dense object detection, achieving better results than state-of-the-art two-stage object detectors.
另一方面,单阶段目标检测架构也变得流行,主要是因为计算效率。YOLO [29] 输出非常稀疏的检测结果,只需把输入图像在高效的骨干网络中前向一次,就能实现实时目标检测。SSD [25] 的检测方式与 RPN [30] 相似,但使用多种分辨率的特征图来覆盖不同尺度的物体。它们的主要局限是精度通常低于两阶段检测器。近来提出的 RetinaNet [24] 用于应对密集目标检测中极端的前景–背景类别不平衡,取得了优于当时最先进两阶段目标检测器的结果。
Some explorations in multi-stage object detection have also been proposed. The multi-region detector [10] introduced iterative bounding box regression, where a R-CNN is applied several times, to produce better bounding boxes. [36, 12, 11] used a multi-stage procedure to generate accurate proposals, and forwarded them to an accurate model (e.g. Fast R-CNN). [37, 27] also attempted to localize objects sequentially. However, these methods usually used the same regressor iteratively for accurate localization. [21, 28] embedded the classic cascade architecture of [34] in object detection networks. [3] iterated a detection and a segmentation task alternatively, for instance segmentation.
也有一些工作探索了多阶段目标检测。多区域检测器 [10] 引入了迭代边界框回归,把一个 R-CNN 多次应用,以产生更好的边界框。[36, 12, 11] 用多阶段程序生成准确的提议,再把它们送到一个准确的模型(例如 Fast R-CNN)。[37, 27] 也尝试按顺序定位物体。不过,这些方法通常是把同一个回归器迭代使用,以追求准确定位。[21, 28] 把 [34] 的经典级联架构嵌入了目标检测网络。[3] 则交替迭代检测任务和分割任务,用于实例分割。
3. Object Detection
In this paper, we extend the two-stage architecture of the Faster R-CNN [30, 23], shown in Figure 3 (a). The first stage is a proposal sub-network (“H0”), applied to the entire image, to produce preliminary detection hypotheses, known as object proposals. In the second stage, these hypotheses are then processed by a region-of-interest detection sub-network (“H1”), denoted as detection head. A final classification score (“C”) and a bounding box (“B”) are assigned to each hypothesis. We focus on modeling a multi-stage detection sub-network, and adopt, but are not limited to, the RPN [30] for proposal detection.
本文扩展 Faster R-CNN [30, 23] 的两阶段架构,如图 3(a)所示。第一阶段是一个提议子网络(“H0”),作用于整幅图像,产生初步的检测假设,也就是物体提议。在第二阶段,这些假设再由一个感兴趣区域检测子网络(“H1”)处理,称为检测头。每个假设会被赋予最终的分类分数(“C”)和边界框(“B”)。我们的重点是对多阶段检测子网络建模,并采用——但不局限于——RPN [30] 来做提议检测。
3.1. Bounding Box Regression
A bounding box contains the four coordinates of an image patch . The task of bounding box regression is to regress a candidate bounding box into a target bounding box , using a regressor . This is learned from a training sample , so as to minimize the bounding box loss function, , as suggested in Fast R-CNN [13]. To encourage a regression invariant to scale and location, operates on the distance vector defined by
一个边界框 包含图像块 的四个坐标。边界框回归的任务,是用回归器 ,把候选边界框 回归到目标边界框 。这由训练样本 学习,以最小化边界框 损失函数 ,正如 Fast R-CNN [13] 所建议的。为了使回归对尺度和位置保持不变, 作用在距离向量 上,其定义为
Since bounding box regression usually performs minor adjustments on , the numerical values of (1) can be very small. Hence, the regression loss is usually much smaller than the classification loss. To improve the effectiveness of multi-task learning, is usually normalized by its mean and variance, i.e. is replaced by . This is widely used in the literature [30, 1, 4, 23, 16].
由于边界框回归通常只对 做较小的调整,(1)中的数值可以非常小。因此,回归损失通常远小于分类损失。为提高多任务学习的效果, 通常会用其均值和方差做归一化,也就是把 替换为 。这在文献中被广泛使用 [30, 1, 4, 23, 16]。
Some works [10, 11, 18] have argued that a single regression step of is insufficient for accurate localization. Instead, is applied iteratively, as a post-processing step
一些工作 [10, 11, 18] 认为,仅对 做一次回归不足以准确定位。相反, 被迭代地用作后处理步骤
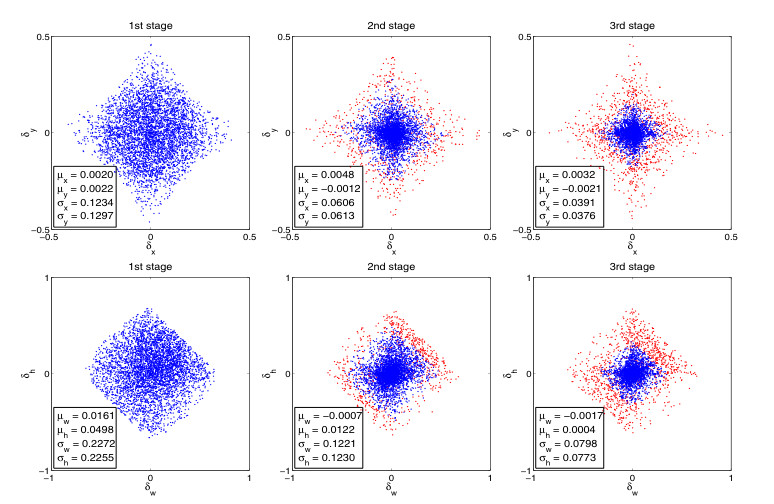
Figure 2. Sequential distribution (without normalization) at different cascade stage. Red dots are outliers when using increasing IoU thresholds, and the statistics are obtained after outlier removal.
图 2. 不同级联阶段上,未经归一化的序列 分布。红点是在提高 IoU 阈值时出现的离群点,统计量在去除离群点之后得到。
to refine a bounding box . This is called iterative bounding box regression, denoted as iterative BBox. It can be implemented with the inference architecture of Figure 3 (b) where all heads are the same. This idea, however, ignores two problems. First, as shown in Figure 1, a regressor trained at , is suboptimal for hypotheses of higher IoUs. It actually degrades bounding boxes of IoU larger than 0.85. Second, as shown in Figure 2, the distribution of bounding boxes changes significantly after each iteration. While the regressor is optimal for the initial distribution it can be quite suboptimal after that. Due to these problems, iterative BBox requires a fair amount of human engineering, in the form of proposal accumulation, box voting, etc. [10, 11, 18], and has somewhat unreliable gains. Usually, there is no benefit beyond applying twice.
来改进边界框 。这称为迭代边界框回归,记作 iterative BBox。它可以按图 3(b)的推理架构实现,其中所有检测头都相同。然而,这一想法忽略了两个问题。第一,如图 1 所示,在 下训练的回归器 ,对更高 IoU 的假设是次优的。它实际上会把 IoU 大于 0.85 的边界框改坏。第二,如图 2 所示,边界框的分布在每次迭代后都会显著变化。回归器虽然对初始分布是最优的,之后却可能相当次优。由于这些问题,iterative BBox 需要相当多的人工设计,例如提议累积、框投票等 [10, 11, 18],而且收益不太稳定。通常,把 应用两次以上并没有好处。
3.2. Detection Quality
The classifier assigns an image patch to one of classes, where class 0 contains background and the remaining the objects to detect. Given a training set , it is learned by minimizing a classification cross-entropy loss , where is the class label of patch . Since a bounding box usually includes an object and some amount of background, it is difficult to determine if a detection is positive or negative. This is usually addressed by the IoU metric. If the IoU is above a threshold , the patch is considered an example of the class. Thus, the class label of a hypothesis is a function of ,
分类器 把图像块 分到 类中的一类,其中第 0 类是背景,其余是要检测的物体。给定训练集 ,它通过最小化分类交叉熵损失 来学习,其中 是图像块 的类别标签。由于边界框通常既包含物体,也包含一定背景,要判断一次检测是正还是负并不容易。这通常用 IoU 度量来处理。若 IoU 高于阈值 ,该图像块就被看作该类的一个样本。因此,假设 的类别标签是 的函数,
where is the class label of the ground truth object . This IoU threshold defines the quality of a detector.
其中 是真值物体 的类别标签。这一 IoU 阈值 定义了检测器的品质。
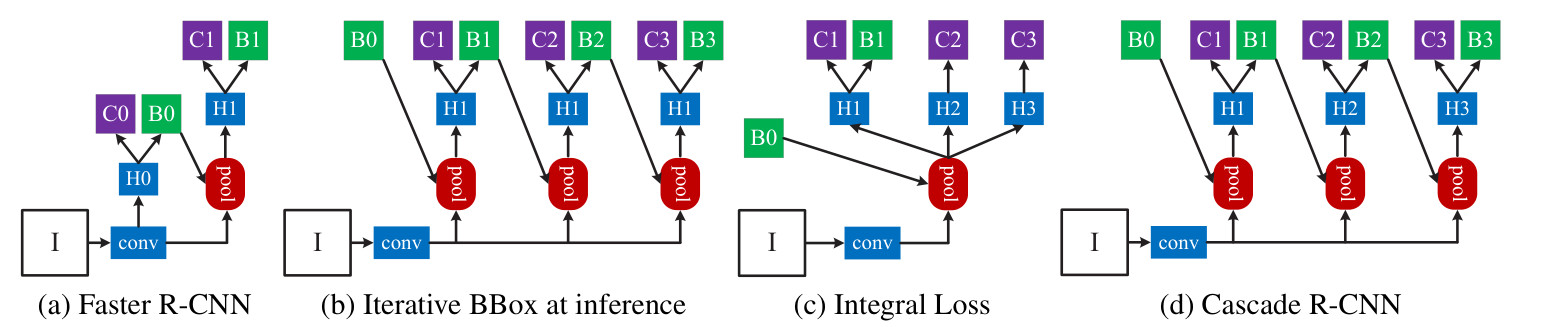
Figure 3. The architectures of different frameworks. “I” is input image, “conv” backbone convolutions, “pool” region-wise feature extraction, “H” network head, “B” bounding box, and “C” classification. “B0” is proposals in all architectures.
图 3. 不同框架的架构。“I”是输入图像,“conv”是骨干卷积,“pool”是区域特征提取,“H”是网络头,“B”是边界框,“C”是分类。在所有架构中,“B0”都是提议。
Object detection is challenging because, no matter threshold, the detection setting is highly adversarial. When is high, the positives contain less background, but it is difficult to assemble enough positive training examples. When is low, a richer and more diversified positive training set is available, but the trained detector has little incentive to reject close false positives. In general, it is very difficult to ask a single classifier to perform uniformly well over all IoU levels. At inference, since the majority of the hypotheses produced by a proposal detector, e.g. RPN [30] or selective search [33], have low quality, the detector must be more discriminant for lower quality hypotheses. A standard compromise between these conflicting requirements is to settle on . This, however, is a relatively low threshold, leading to low quality detections that most humans consider close false positives, as shown in Figure 1 (a).
目标检测之所以困难,是因为无论阈值如何选取,检测的设定都相当对抗。当 较高时,正样本中的背景更少,但很难凑够足够的正训练样本。当 较低时,可以得到更丰富、更多样的正训练集,但训练出的检测器几乎没有动力去拒绝近假阳性。一般而言,很难要求单个分类器在所有 IoU 水平上都表现均衡。在推理时,由于提议检测器(例如 RPN [30] 或选择性搜索 [33])产生的假设大多数质量较低,检测器必须对较低质量的假设更有判别力。在这些相互冲突的要求之间,标准的折中是取 。然而,这仍是一个相对较低的阈值,会带来多数人看来属于近假阳性的低质量检测,如图 1(a)所示。
A naïve solution is to develop an ensemble of classifiers, with the architecture of Figure 3 (c), optimized with a loss that targets various quality levels,
一个朴素的办法是发展一组分类器集成,采用图 3(c)的架构,并用面向多种品质水平的损失来优化,
where is a set of IoU thresholds. This is closely related to the integral loss of [38], where , designed to fit the evaluation metric of the COCO challenge. By definition, the classifiers need to be ensembled at inference. This solution fails to address the problem that the different losses of (4) operate on different numbers of positives. As shown in the first figure of Figure 4, the set of positive samples decreases quickly with . This is particularly problematic because the high quality classifiers are prone to overfitting. In addition, those high quality classifiers are required to process proposals of overwhelming low quality at inference, for which they are not optimized. Due to all this, the ensemble of (4) fails to achieve higher accuracy at most quality levels, and the architecture has very little gain over that of Figure 3 (a).
其中 是一组 IoU 阈值。这与 [38] 的积分损失密切相关,那里取 ,目的是贴合 COCO 挑战赛的评价指标。按定义,这些分类器在推理时需要做集成。这一方案没有解决(4)中不同损失作用在不同数量的正样本上这一问题。如图 4 的第一幅图所示,正样本集合随 迅速减少。这一点尤其成问题,因为高质量分类器容易过拟合。此外,这些高质量分类器在推理时还要处理大量低质量提议,而它们并非为此优化。由于这一切,(4)的集成在大多数品质水平上都不能取得更高精度,该架构相对图 3(a)几乎没有收益。
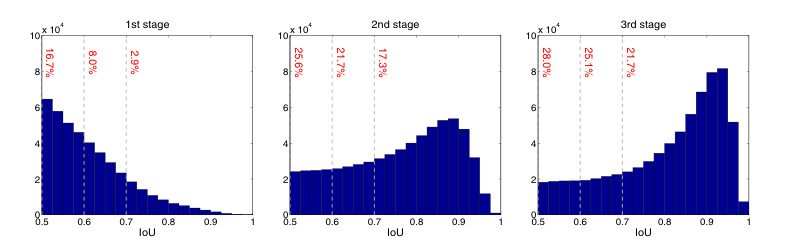
Figure 4. The IoU histogram of training samples. The distribution at 1st stage is the output of RPN. The red numbers are the positive percentage higher than the corresponding IoU threshold.
图 4. 训练样本的 IoU 直方图。第一阶段的分布是 RPN 的输出。红色数字是高于相应 IoU 阈值的正样本比例。
4. Cascade R-CNN
In this section we introduce the proposed Cascade R-CNN object detection architecture of Figure 3 (d).
本节介绍所提出的 Cascade R-CNN 目标检测架构,如图 3(d)所示。
4.1. Cascaded Bounding Box Regression
As seen in Figure 1 (c), it is very difficult to ask a single regressor to perform perfectly uniformly at all quality levels. The difficult regression task can be decomposed into a sequence of simpler steps, inspired by the works of cascade pose regression [6] and face alignment [2, 35]. In the Cascade R-CNN, it is framed as a cascaded regression problem, with the architecture of Figure 3 (d). This relies on a cascade of specialized regressors
正如图 1(c)所示,很难要求单个回归器在所有品质水平上都表现得完全均匀。这个困难的回归任务可以分解成一串更简单的步骤,其启发来自级联姿态回归 [6] 和人脸对齐 [2, 35]。在 Cascade R-CNN 中,它被写成一个级联回归问题,架构如图 3(d)所示。这依赖于一串专门化的回归器
where is the total number of cascade stages. Note that each regressor in the cascade is optimized w.r.t. the sample distribution arriving at the corresponding stage, instead of the initial distribution of . This cascade improves hypotheses progressively.
其中 是级联阶段的总数。需要注意的是,级联中的每个回归器 都针对到达该阶段的样本分布 来优化,而不是针对初始分布 。这一级联逐步改进假设。
It differs from the iterative BBox architecture of Figure 3 (b) in several ways. First, while iterative BBox is a post-processing procedure used to improve bounding boxes, cascaded regression is a resampling procedure that changes the distribution of hypotheses to be processed by the different stages. Second, because it is used at both training and inference, there is no discrepancy between training and inference distributions. Third, the multiple specialized regressors are optimized for the resampled distributions of the different stages. This opposes to the single of (2), which is only optimal for the initial distribution. These differences enable more precise localization than iterative BBox, with no further human engineering.
它与图 3(b)的 iterative BBox 架构有几处不同。第一,iterative BBox 是用来改进边界框的后处理程序,而级联回归是一种重采样程序,会改变各阶段所处理的假设分布。第二,因为它在训练和推理时都使用,训练分布与推理分布之间没有偏差。第三,多个专门化的回归器 是针对不同阶段经过重采样的分布来优化的。这与(2)中那个只对初始分布最优的单个 相对。这些差异使得定位比 iterative BBox 更精确,而且无需额外的人工设计。
As discussed in Section 3.1, in (1) needs to be normalized for effective multi-task learning. After each regression stage, their statistics will evolve sequentially, as displayed in Figure 2. At training, the corresponding statistics are used to normalize at each stage.
如第 3.1 节所述,(1)中的 需要归一化,才能有效进行多任务学习。在每个回归阶段之后,这些统计量会依次演变,如图 2 所示。训练时,每一级都用相应的统计量来归一化 。
4.2. Cascaded Detection
As shown in the left of Figure 4, the distribution of the initial hypotheses, e.g. RPN proposals, is heavily tilted towards low quality. This inevitably induces ineffective learning of higher quality classifiers. The Cascade R-CNN addresses the problem by relying on cascade regression as a resampling mechanism. This is motivated by the fact that in Figure 1 (c) nearly all curves are above the diagonal gray line, i.e. a bounding box regressor trained for a certain tends to produce bounding boxes of higher IoU. Hence, starting from a set of examples , cascade regression successively resamples an example distribution of higher IoU. In this manner, it is possible to keep the set of positive examples of the successive stages at a roughly constant size, even when the detector quality (IoU threshold) is increased. This is illustrated in Figure 4, where the distribution tilts more heavily towards high quality examples after each resampling step. Two consequences ensue. First, there is no overfitting, since positive examples are plentiful at all levels. Second, the detectors of the deeper stages are optimized for higher IoU thresholds. Note that, some outliers are sequentially removed by increasing IoU thresholds, as illustrated in Figure 2, enabling a better trained sequence of specialized detectors.
如图 4 左侧所示,初始假设(例如 RPN 提议)的分布严重偏向低质量。这不可避免地会使更高品质分类器的学习变得低效。Cascade R-CNN 通过把级联回归当作一种重采样机制来应对这一问题。其依据是:在图 1(c)中,几乎所有曲线都位于对角灰线上方,也就是说,为某一 训练的边界框回归器,往往会产出更高 IoU 的边界框。因此,从一组样本 出发,级联回归会依次重采样出更高 IoU 的样本分布 。这样一来,即使检测器品质(IoU 阈值)提高,后续各阶段的正样本集合仍能大致保持恒定规模。图 4 说明了这一点:每次重采样之后,分布都更明显地偏向高质量样本。由此产生两个结果。第一,不会过拟合,因为各个水平上都有充足的正样本。第二,更深阶段的检测器是为更高的 IoU 阈值优化的。需要注意的是,如图 2 所示,一些离群点会随着 IoU 阈值提高而被依次去除,从而能更好地训练出一串专门化的检测器。
At each stage , the R-CNN includes a classifier and a regressor optimized for IoU threshold , where . This is learned by minimizing the loss
在每一阶段 ,R-CNN 包含一个分类器 和一个回归器 ,它们针对 IoU 阈值 优化,其中 。这通过最小化如下损失来学习
where , is the ground truth object for , the trade-off coefficient, the indicator function, and is the label of given by (3). Unlike the integral loss of (4), this guarantees a sequence of effectively trained detectors of increasing quality. At inference, the quality of the hypotheses is sequentially improved, by applications of the same cascade procedure, and higher quality detectors are only required to operate on higher quality hypotheses. This enables high quality object detection, as suggested by Figure 1 (c) and (d).
其中 , 是 对应的真值物体, 是折中系数, 是指示函数, 则是由(3)按 给出的 的标签。与(4)的积分损失不同,这保证能有效训练出一串品质逐步提高的检测器。推理时,通过应用同一套级联程序,假设的质量被依次提高,更高品质的检测器只需在更高品质的假设上工作。如图 1(c)和(d)所示,这使高质量目标检测成为可能。
5. Experimental Results
The Cascade R-CNN was evaluated mainly on MS-COCO 2017 [22], which contains 118k images for training, 5k for validation (val) and 20k for testing without provided annotations (test-dev). The COCO-style Average Precision (AP) averages AP across IoU thresholds from 0.5 to 0.95 with an interval of 0.05. These metrics measure the detection performance of various qualities. All models were trained on COCO training set, and evaluated on val set. Final results were also reported on test-dev set.
Cascade R-CNN 主要在 MS-COCO 2017 [22] 上评估,该数据集约有 118k 张训练图像、5k 张验证图像(val),以及约 20k 张不提供标注的测试图像(test-dev)。COCO 式平均精度(AP)是在从 0.5 到 0.95、间隔为 0.05 的 IoU 阈值上对 AP 取平均。这些指标衡量不同品质下的检测性能。所有模型都在 COCO 训练集上训练,并在 val 集上评估。最终结果也在 test-dev 集上报告。
5.1. Implementation Details
All regressors are class agnostic for simplicity. All cascade detection stages in Cascade R-CNN have the same architecture, which is the head of the baseline detection network. In total, Cascade R-CNN have four stages, one RPN and three for detection with , unless otherwise noted. The sampling of the first detection stage follows [13, 30]. In the following stages, resampling is implemented by simply using the regressed outputs from the previous stage, as in Section 4.2. No data augmentation was used except standard horizontal image flipping. Inference was performed on a single image scale, with no further bells and whistles. All baseline detectors were reimplemented with Caffe [20], on the same codebase for fair comparison.
为简单起见,所有回归器都是类别无关的。Cascade R-CNN 中所有级联检测阶段的架构相同,都是基线检测网络的头部。除非另有说明,Cascade R-CNN 一共有四个阶段:一个 RPN,以及三个检测阶段,取 。第一检测阶段的采样遵循 [13, 30]。在后续阶段,重采样只需使用上一阶段的回归输出,如第 4.2 节所述。除标准的水平翻转外,没有使用其他数据增强。推理在单一图像尺度上进行,不再使用其他花哨技巧。所有基线检测器都用 Caffe [20] 在同一代码库中重新实现,以便公平比较。
5.1.1 Baseline Networks
To test the versatility of the Cascade R-CNN, experiments were performed with three popular baseline detectors: Faster R-CNN with backbone VGG-Net [32], R-FCN [4] and FPN [23] with ResNet backbone [18]. These baselines have a wide range of detection performances. Unless noted, their default settings were used. End-to-end training was used instead of multi-step training.
为检验 Cascade R-CNN 的通用性,实验使用了三种流行的基线检测器:以 VGG-Net [32] 为骨干的 Faster R-CNN、R-FCN [4],以及以 ResNet [18] 为骨干的 FPN [23]。这些基线的检测性能跨度较大。除非另有说明,均使用它们的默认设置。训练采用端到端方式,而不是多步训练。
Faster R-CNN: The network head has two fully connected layers. To reduce parameters, we used [15] to prune less important connections. 2048 units were retained per fully connected layer and dropout layers were removed. Training started with a learning rate of 0.002, reduced by a factor of 10 at 60k and 90k iterations, and stopped at 100k iterations, on 2 synchronized GPUs, each holding 4 images per iteration. 128 RoIs were used per image.
Faster R-CNN:网络头有两个全连接层。为减少参数,我们用 [15] 剪掉较不重要的连接。每个全连接层保留 2048 个单元,并去掉 dropout 层。训练的初始学习率为 0.002,在 60k 和 90k 次迭代时降为原来的 1/10,并在 100k 次迭代时停止;使用 2 块同步 GPU,每块每个迭代持有 4 张图像。每张图像使用 128 个 RoI。
R-FCN: R-FCN adds a convolutional, a bounding box regression, and a classification layer to the ResNet. All heads of the Cascade R-CNN have this structure. Online hard negative mining [31] was not used. Training started with a learning rate of 0.003, which was decreased by a factor of 10 at 160k and 240k iterations, and stopped at 280k iterations, on 4 synchronized GPUs, each holding one image per iteration. 256 RoIs were used per image.
R-FCN:R-FCN 在 ResNet 上增加一个卷积层、一个边界框回归层和一个分类层。Cascade R-CNN 的所有检测头都采用这一结构。没有使用在线难负样本挖掘 [31]。训练的初始学习率为 0.003,在 160k 和 240k 次迭代时降为原来的 1/10,并在 280k 次迭代时停止;使用 4 块同步 GPU,每块每个迭代持有一张图像。每张图像使用 256 个 RoI。
FPN: Since no source code was publicly available for FPN, our implementation details could be different. RoIAlign [16] was used for a stronger baseline. This is denoted as FPN+ and was used in all ablation studies. As usual, ResNet-50 was used for ablation studies, and ResNet-101 for final detection. Training used a learning rate of 0.005 for 120k iterations and 0.0005 for the next 60k iterations, on 8 synchronized GPUs, each holding one image per iteration. 256 RoIs were used per image.
FPN:由于当时没有公开的 FPN 源码,我们的实现细节可能有所不同。为得到更强的基线,使用了 RoIAlign [16]。这记作 FPN+,并用于所有消融实验。与通常做法一样,消融实验使用 ResNet-50,最终检测使用 ResNet-101。训练在 8 块同步 GPU 上进行,每块每个迭代持有一张图像,学习率 0.005 训练 120k 次迭代,随后 60k 次迭代使用 0.0005。每张图像使用 256 个 RoI。
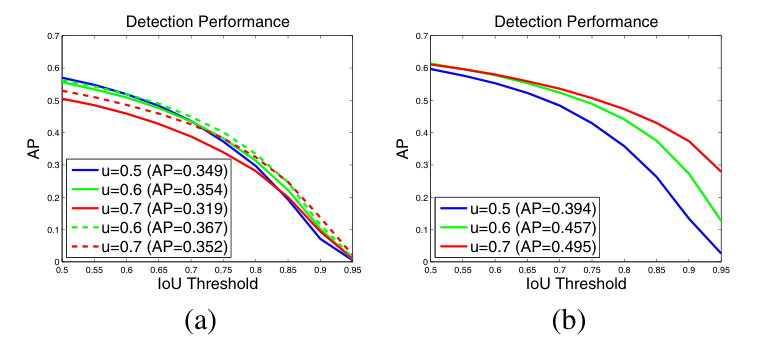
Figure 5. (a) is detection performance of individually trained detectors, with their own proposals (solid curves) or Cascade R-CNN stage proposals (dashed curves), and (b) is by adding ground truth to the proposal set.
图 5.(a)是单独训练的检测器的检测性能,分别使用它们自己的提议(实线)或 Cascade R-CNN 各阶段的提议(虚线);(b)是在提议集合中加入真值后的结果。
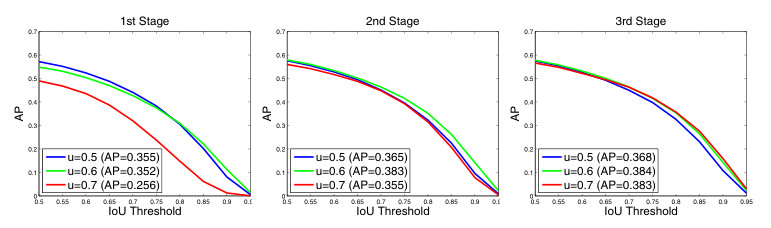
Figure 6. The detection performance of all Cascade R-CNN detectors at all cascade stages.
图 6. 所有 Cascade R-CNN 检测器在各个级联阶段上的检测性能。
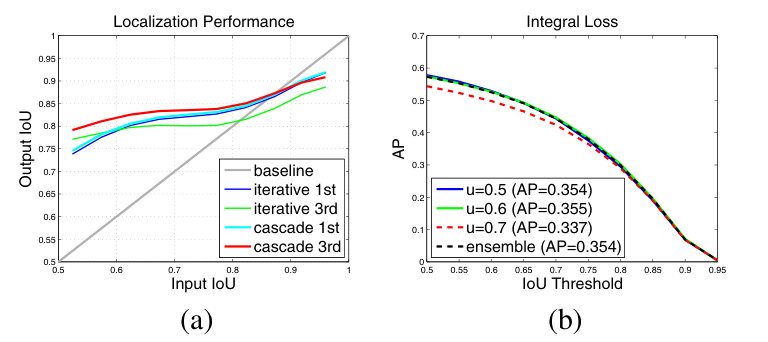
Figure 7. (a) is the localization comparison, and (b) is the detection performance of individual classifiers in the integral loss detector.
图 7.(a)是定位比较;(b)是积分损失检测器中各个分类器的检测性能。
5.2. Quality Mismatch
Figure 5 (a) shows the AP curves of three individually trained detectors of increasing IoU thresholds of . The detector of outperforms the detector of at low IoU levels, but underperforms it at higher levels. However, the detector of underperforms the other two. To understand why this happens, we changed the quality of the proposals at inference. Figure 5 (b) shows the results obtained when ground truth bounding boxes were added to the set of proposals. While all detectors improve, the detector of has the largest gains, achieving the best performance at almost all IoU levels. These results suggest two conclusions. First, is not a good choice for precise detection, simply more robust to low quality proposals. Second, highly precise detection requires hypotheses that match the detector quality.
图 5(a)给出了以逐步提高的 IoU 阈值 单独训练的三个检测器的 AP 曲线。 的检测器在低 IoU 水平上优于 的检测器,但在更高水平上则不如后者。然而, 的检测器比另外两个都差。为理解原因,我们在推理时改变了提议的质量。图 5(b)给出了把真值边界框加入提议集合后的结果。所有检测器都有所提升,但 的检测器收益最大,几乎在所有 IoU 水平上都取得最好成绩。这些结果引出两点结论。第一, 并不是精确检测的好选择,它只是对低质量提议更稳健。第二,高度精确的检测,需要与检测器品质相匹配的假设。
Next, the original detector proposals were replaced by the Cascade R-CNN proposals of higher quality ( and used the 2nd and 3rd stage proposals, respectively). Figure 5 (a) also suggests that the performance of the two detectors is significantly improved when the testing proposals closer match the detector quality.
接下来,原来检测器的提议被更高质量的 Cascade R-CNN 提议替换( 和 分别使用第 2 和第 3 阶段的提议)。图 5(a)也表明,当测试提议与检测器品质更接近时,这两个检测器的性能会显著提高。
Testing all Cascade R-CNN detectors at all cascade stages produced similar observations. Figure 6 shows that each detector was improved when used more precise hypotheses, while higher quality detector had larger gain. For example, the detector of performed poorly for the low quality proposals of the 1st stage, but much better for the more precise hypotheses available at the deeper cascade stages. In addition, the jointly trained detectors of Figure 6 outperformed the individually trained detectors of Figure 5 (a), even when the same proposals were used. This indicates that the detectors are better trained within the Cascade R-CNN framework.
在所有级联阶段上测试所有 Cascade R-CNN 检测器,也得到了类似观察。图 6 表明,每个检测器在使用更精确的假设时都会提高,而更高品质的检测器收益更大。例如, 的检测器在第 1 阶段的低质量提议上表现较差,但在更深级联阶段所能得到的更精确假设上则好得多。此外,即使使用相同的提议,图 6 中联合训练的检测器也优于图 5(a)中单独训练的检测器。这表明,检测器在 Cascade R-CNN 框架内能够得到更好的训练。
Table 1. The comparison with iterative BBox and integral loss.
| AP | AP | AP | AP | AP | AP | |
|---|---|---|---|---|---|---|
| FPN+ baseline | 34.9 | 57.0 | 51.9 | 43.6 | 29.7 | 7.1 |
| Iterative BBox | 35.4 | 57.2 | 52.1 | 44.2 | 30.4 | 8.1 |
| Integral Loss | 35.4 | 57.3 | 52.5 | 44.4 | 29.9 | 6.9 |
| Cascade R-CNN | 38.9 | 57.8 | 53.4 | 46.9 | 35.8 | 15.8 |
表 1. 与 iterative BBox 和积分损失的比较。
| AP | AP | AP | AP | AP | AP | |
|---|---|---|---|---|---|---|
| FPN+ 基线 | 34.9 | 57.0 | 51.9 | 43.6 | 29.7 | 7.1 |
| Iterative BBox | 35.4 | 57.2 | 52.1 | 44.2 | 30.4 | 8.1 |
| 积分损失 | 35.4 | 57.3 | 52.5 | 44.4 | 29.9 | 6.9 |
| Cascade R-CNN | 38.9 | 57.8 | 53.4 | 46.9 | 35.8 | 15.8 |
5.3. Comparison with Iterative BBox and Integral Loss
In this section, we compare the Cascade R-CNN to iterative BBox and the integral loss detector. Iterative BBox was implemented by applying the FPN+ baseline iteratively, three times. The integral loss detector also has three classification heads, with .
本节将 Cascade R-CNN 与 iterative BBox 以及积分损失检测器进行比较。Iterative BBox 的实现方式,是把 FPN+ 基线迭代应用三次。积分损失检测器同样有三个分类头,取 。
Localization: The localization performances of cascade regression and iterative BBox are compared in Figure 7 (a). The use of a single regressor degrades localization for hypotheses of high IoU. This effect accumulates when the regressor is applied iteratively, as in iterative BBox, and performance actually drops. Note the very poor performance of iterative BBox after 3 iterations. On the contrary, the cascade regressor has better performance at later stages, outperforming iterative BBox at almost all IoU levels.
定位:级联回归与 iterative BBox 的定位性能在图 7(a)中比较。使用单个回归器会损害高 IoU 假设的定位。当该回归器像 iterative BBox 那样被迭代应用时,这一效应会累积,性能实际上会下降。注意 iterative BBox 在 3 次迭代后的表现非常差。相反,级联回归器在更后的阶段表现更好,几乎在所有 IoU 水平上都超过 iterative BBox。
Integral Loss: The detection performances of all classifiers in the integral loss detector, sharing a single regressor, are shown in Figure 7 (b). The classifier of is the best at all IoU levels, while the classifier of is the worst. The ensemble of all classifiers shows no visible gain.
积分损失:积分损失检测器中共享单个回归器的所有分类器,其检测性能如图 7(b)所示。 的分类器在所有 IoU 水平上都最好,而 的分类器最差。所有分类器的集成没有可见的收益。
Table 1 shows, both iterative BBox and integral loss detector improve the baseline detector marginally. The cascade R-CNN has the best performance for all evaluation metrics. The gains are mild for low IoU thresholds but significant for the higher ones.
如表 1 所示,iterative BBox 和积分损失检测器都只是略微改进了基线检测器。Cascade R-CNN 在所有评价指标上都最好。在低 IoU 阈值上的收益较为温和,但在更高阈值上则相当显著。
5.4. Ablation Experiments
A couple of ablation experiments were run to analyze the proposed Cascade R-CNN.
我们做了若干消融实验,以分析所提出的 Cascade R-CNN。
Table 2. The stage performance of Cascade R-CNN. indicates the ensemble result, which is the average of the three classifier probabilities, given the 3rd stage proposals.
| test stage | AP | AP | AP | AP | AP | AP |
|---|---|---|---|---|---|---|
| 1 | 35.5 | 57.2 | 52.4 | 44.1 | 30.5 | 8.1 |
| 2 | 38.3 | 57.9 | 53.4 | 46.4 | 35.2 | 14.2 |
| 3 | 38.3 | 56.6 | 52.2 | 46.3 | 35.7 | 15.9 |
| 38.5 | 58.2 | 53.8 | 46.7 | 35.0 | 14.0 | |
| 38.9 | 57.8 | 53.4 | 46.9 | 35.8 | 15.8 | |
| FPN+ baseline | 34.9 | 57.0 | 51.9 | 43.6 | 29.7 | 7.1 |
表 2. Cascade R-CNN 的分阶段性能。 表示集成结果,即在第 3 阶段提议上对三个分类器概率取平均。
| 测试阶段 | AP | AP | AP | AP | AP | AP |
|---|---|---|---|---|---|---|
| 1 | 35.5 | 57.2 | 52.4 | 44.1 | 30.5 | 8.1 |
| 2 | 38.3 | 57.9 | 53.4 | 46.4 | 35.2 | 14.2 |
| 3 | 38.3 | 56.6 | 52.2 | 46.3 | 35.7 | 15.9 |
| 38.5 | 58.2 | 53.8 | 46.7 | 35.0 | 14.0 | |
| 38.9 | 57.8 | 53.4 | 46.9 | 35.8 | 15.8 | |
| FPN+ 基线 | 34.9 | 57.0 | 51.9 | 43.6 | 29.7 | 7.1 |
Table 3. The ablation experiments. “IoU” means increasing IoU thresholds, and “stat” exploiting sequential regression statistics.
| IoU | stat | AP | AP | AP | AP | AP | AP |
|---|---|---|---|---|---|---|---|
| 36.8 | 57.8 | 52.9 | 45.4 | 32.0 | 10.7 | ||
| ✓ | 38.5 | 58.4 | 54.1 | 47.1 | 35.0 | 13.1 | |
| ✓ | 37.5 | 57.8 | 53.1 | 45.5 | 33.3 | 13.1 | |
| ✓ | ✓ | 38.9 | 57.8 | 53.4 | 46.9 | 35.8 | 15.8 |
表 3. 消融实验。“IoU”表示提高 IoU 阈值,“stat”表示利用序列回归统计量。
| IoU | stat | AP | AP | AP | AP | AP | AP |
|---|---|---|---|---|---|---|---|
| 36.8 | 57.8 | 52.9 | 45.4 | 32.0 | 10.7 | ||
| ✓ | 38.5 | 58.4 | 54.1 | 47.1 | 35.0 | 13.1 | |
| ✓ | 37.5 | 57.8 | 53.1 | 45.5 | 33.3 | 13.1 | |
| ✓ | ✓ | 38.9 | 57.8 | 53.4 | 46.9 | 35.8 | 15.8 |
Table 4. The impact of the number of stages in Cascade R-CNN.
| # stages | test stage | AP | AP | AP | AP | AP | AP |
|---|---|---|---|---|---|---|---|
| 1 | 1 | 34.9 | 57.0 | 51.9 | 43.6 | 29.7 | 7.1 |
| 2 | 38.2 | 58.0 | 53.6 | 46.7 | 34.6 | 13.6 | |
| 3 | 38.9 | 57.8 | 53.4 | 46.9 | 35.8 | 15.8 | |
| 4 | 38.9 | 57.4 | 53.2 | 46.8 | 36.0 | 16.0 | |
| 4 | 38.6 | 57.2 | 52.8 | 46.2 | 35.5 | 16.3 |
表 4. Cascade R-CNN 中阶段数目的影响。
| 阶段数 | 测试阶段 | AP | AP | AP | AP | AP | AP |
|---|---|---|---|---|---|---|---|
| 1 | 1 | 34.9 | 57.0 | 51.9 | 43.6 | 29.7 | 7.1 |
| 2 | 38.2 | 58.0 | 53.6 | 46.7 | 34.6 | 13.6 | |
| 3 | 38.9 | 57.8 | 53.4 | 46.9 | 35.8 | 15.8 | |
| 4 | 38.9 | 57.4 | 53.2 | 46.8 | 36.0 | 16.0 | |
| 4 | 38.6 | 57.2 | 52.8 | 46.2 | 35.5 | 16.3 |
Stage-wise Comparison: Table 2 summarizes stage performance. Note that the 1st stage already outperforms the baseline detector, due to the benefits of multi-stage multi-task learning. Deeper cascade stages prefer higher quality localization, encouraging to learn features conducive to it. This benefits earlier cascade stages by features sharing across stages. The 2nd stage improves performance substantially, and the 3rd is equivalent to the 2nd. This differs from the integral loss detector, where the higher IoU classifier is relatively weak. While the former (later) stage is better at low (high) IoU metrics, the ensemble of all classifiers is the best overall.
分阶段比较:表 2 汇总了各阶段性能。需要注意的是,由于多阶段多任务学习的益处,第 1 阶段就已经超过了基线检测器。更深的级联阶段更偏好更高品质的定位,从而鼓励学习有利于定位的特征。通过跨阶段的特征共享,这也会惠及更早的级联阶段。第 2 阶段显著提高了性能,第 3 阶段与第 2 阶段相当。这与积分损失检测器不同,后者中更高 IoU 的分类器相对较弱。尽管较前(较后)的阶段在低(高)IoU 指标上更好,所有分类器的集成在总体上最好。
IoU Thresholds: A preliminary Cascade R-CNN was trained using the same IoU threshold for all heads. In this case, the stages differ only in the hypotheses they receive. Each stage is trained with the corresponding hypotheses, i.e. accounting for the distributions of Figure 2. The first row of Table 3 shows that the cascade improves on the baseline detector. This suggests the importance of optimizing stages for the corresponding sample distributions. The second row shows that, by increasing the stage threshold , the detector can be made more selective against close false positives and specialized for more precise hypotheses, leading to additional gains. This supports the conclusions of Section 4.2.
IoU 阈值:我们训练了一个初步的 Cascade R-CNN,所有检测头都使用相同的 IoU 阈值 。在这种情况下,各阶段的差别只在于它们接收到的假设。每一级都用相应的假设来训练,也就是考虑图 2 中的分布。表 3 的第一行表明,级联已经改进了基线检测器。这说明,针对相应的样本分布来优化各阶段是重要的。第二行表明,通过提高阶段阈值 ,检测器可以对近假阳性更加挑剔,并专门适应更精确的假设,从而带来额外收益。这支持了第 4.2 节的结论。
Regression Statistics: Exploiting the progressively updated regression statistics, of Figure 2, helps the effective multi-task learning of classification and regression. Its benefit is noted by comparing the models with/without it in Table 3. The learning is not sensitive to these statistics.
回归统计量:利用图 2 中逐步更新的回归统计量,有助于分类与回归的有效多任务学习。其益处可通过比较表 3 中有无该项的模型看出。学习对这些统计量并不敏感。
Number of Stages: The impact of the number of stages is summarized in Table 4. Adding a second detection stage significantly improves the baseline detector. Three detection stages still produce non-trivial improvement, but the addition of a 4th stage () led to a slight performance decrease. Note, however, that while the overall AP performance degrades, the four-stage cascade has the best performance for high IoU levels. The three-stage cascade achieves the best trade-off.
阶段数目:阶段数目的影响汇总于表 4。增加第二个检测阶段会显著改进基线检测器。三个检测阶段仍能带来不可忽视的提高,但再增加第 4 阶段()却使性能略有下降。不过需要注意的是,尽管总体 AP 有所下降,四阶段级联在高 IoU 水平上表现最好。三阶段级联达到了最好的折中。
5.5. Comparison with the state-of-the-art
The Cascade R-CNN, based on FPN+ and ResNet-101 backbone, is compared to state-of-the-art single-model object detectors in Table 5. The settings are as described in Section 5.1.1, but a total of 280k training iterations were run and the learning rate dropped at 160k and 240k iterations. The number of RoIs was also increased to 512. The first group of detectors on Table 5 are one-stage detectors, the second group two-stage, and the last group multi-stage (3-stages+RPN for the Cascade R-CNN). All the compared state-of-the-art detectors were trained with . It is noted that our FPN+ implementation is better than the original FPN [23], providing a very strong baseline. In addition, the extension from FPN+ to Cascade R-CNN improved performance by 4 points. The Cascade R-CNN also outperformed all single-model detectors by a large margin, under all evaluation metrics. This includes the single-model entries of the COCO challenge winners (Faster R-CNN+++ [18], and G-RMI [19]), and the very recent Deformable R-FCN [5], RetinaNet [24] and Mask R-CNN [16]. Compared to the best multi-stage detector on COCO, AttractioNet [11], although it used many enhancements, the vanilla Cascade R-CNN still outperforms it by 7.1 points. Note that, unlike Mask R-CNN, no segmentation information is exploited in the Cascade R-CNN. Finally, the vanilla single-model Cascade R-CNN also surpasses the heavily engineered ensemble detectors that won the COCO challenge in 2015 and 2016 (AP 37.4 and 41.6, respectively).
以 FPN+ 和 ResNet-101 为骨干的 Cascade R-CNN,在表 5 中与当时最先进的单模型目标检测器进行比较。设置如第 5.1.1 节所述,但总共训练了 280k 次迭代,并在 160k 和 240k 次迭代时降低学习率。RoI 数目也增加到 512。表 5 中第一组是单阶段检测器,第二组是两阶段,最后一组是多阶段(Cascade R-CNN 为 3 个检测阶段加 RPN)。所有对比的最先进检测器都用 训练。需要指出的是,我们的 FPN+ 实现优于原来的 FPN [23],提供了一个很强的基线。此外,从 FPN+ 扩展到 Cascade R-CNN,性能提高了约 4 个点。Cascade R-CNN 还在所有评价指标上以较大幅度超过了所有单模型检测器。这包括 COCO 挑战赛获胜者的单模型条目(Faster R-CNN+++ [18] 和 G-RMI [19]),以及当时很新的 Deformable R-FCN [5]、RetinaNet [24] 和 Mask R-CNN [16]。与 COCO 上最好的多阶段检测器 AttractioNet [11] 相比,尽管后者使用了许多增强,普通的 Cascade R-CNN 仍高出 7.1 个点。需要注意的是,与 Mask R-CNN 不同,Cascade R-CNN 没有利用分割信息。最后,这一普通的单模型 Cascade R-CNN 也超过了 2015 年和 2016 年赢得 COCO 挑战赛、经过大量工程化的集成检测器(AP 分别为 37.4 和 41.6)。
5.6. Generalization Capacity
Three-stage Cascade R-CNN of all three baseline detectors are compared in Table 6. All settings are as above, with the changes of Section 5.5 for FPN+.
表 6 比较了所有三种基线检测器上的三阶段 Cascade R-CNN。所有设置同上,FPN+ 则采用第 5.5 节中的改动。
Detection Performance: Again, our implementations are better than the original detectors [30, 4, 23]. Still, the Cascade R-CNN improves on these baselines consistently by points, independently of their strength. These gains are also consistent on val and test-dev. These results suggest that the Cascade R-CNN is widely applicable across detector architectures.
检测性能:同样,我们的实现优于原来的检测器 [30, 4, 23]。尽管如此,Cascade R-CNN 仍能在这些基线上稳定提高 个点,而且与它们的强弱无关。这些收益在 val 和 test-dev 上也一致。这些结果表明,Cascade R-CNN 可以广泛用于不同的检测器架构。
Parameter and Timing: The number of the Cascade R-CNN parameters increases with the number of cascade stages. The increase is linear in the parameter number of the baseline detector heads. In addition, because the computational cost of a detection head is usually small when compared to the RPN, the computational overhead of the Cascade R-CNN is small, at both training and testing.
参数量与耗时:Cascade R-CNN 的参数量随级联阶段数增加。增加量与基线检测头的参数量成线性关系。此外,由于检测头的计算代价通常远小于 RPN,Cascade R-CNN 在训练和测试时的计算开销都很小。
5.7. Results on PASCAL VOC
The Cascade R-CNN was further experimented on PASCAL VOC dataset [8]. Following [30, 25], the models were trained on VOC2007 and VOC2012 trainval and tested on VOC2007 test. Faster R-CNN (with AlexNet and VGG-Net) and R-FCN (with ResNet) were tested. The training details were similar to Section 5.1.1, and AlexNet were also pruned. Since the goal of this paper is to explore high quality detection, we used the COCO metrics for evaluation. The detection results in Table 7 show that the Cascade R-CNN also has significant improvements over multiple detection architectures on PASCAL VOC. These reinforce our belief on the robustness of the Cascade R-CNN.
Cascade R-CNN 还在 PASCAL VOC 数据集 [8] 上做了进一步实验。遵循 [30, 25],模型在 VOC2007 和 VOC2012 的 trainval 上训练,并在 VOC2007 test 上测试。测试了 Faster R-CNN(分别使用 AlexNet 和 VGG-Net)以及 R-FCN(使用 ResNet)。训练细节与第 5.1.1 节类似,AlexNet 同样做了剪枝。由于本文的目标是探索高质量检测,我们使用 COCO 指标来评估。表 7 的检测结果表明,Cascade R-CNN 在 PASCAL VOC 上对多种检测架构也有显著改进。这进一步支撑了我们对 Cascade R-CNN 稳健性的看法。
The annotations of PASCAL VOC were transformed to COCO format, and COCO toolbox was used for evaluation. The results are different from the original VOC evaluation.
PASCAL VOC 的标注被转换成 COCO 格式,并使用 COCO 工具箱进行评估。结果与原来的 VOC 评估不同。
Table 5. The state-of-the-art single-model detectors on COCO test-dev. The entries denoted by “*” used bells and whistles at inference.
| backbone | AP | AP | AP | AP | AP | AP | |
|---|---|---|---|---|---|---|---|
| YOLOv2 [29] | DarkNet-19 | 21.6 | 44.0 | 19.2 | 5.0 | 22.4 | 35.5 |
| SSD513 [25] | ResNet-101 | 31.2 | 50.4 | 33.3 | 10.2 | 34.5 | 49.8 |
| RetinaNet [24] | ResNet-101 | 39.1 | 59.1 | 42.3 | 21.8 | 42.7 | 50.2 |
| Faster R-CNN+++ [18]* | ResNet-101 | 34.9 | 55.7 | 37.4 | 15.6 | 38.7 | 50.9 |
| Faster R-CNN w FPN [23] | ResNet-101 | 36.2 | 59.1 | 39.0 | 18.2 | 39.0 | 48.2 |
| Faster R-CNN w FPN+ (ours) | ResNet-101 | 38.8 | 61.1 | 41.9 | 21.3 | 41.8 | 49.8 |
| Faster R-CNN by G-RMI [19] | Inception-ResNet-v2 | 34.7 | 55.5 | 36.7 | 13.5 | 38.1 | 52.0 |
| Deformable R-FCN [5]* | Aligned-Inception-ResNet | 37.5 | 58.0 | 40.8 | 19.4 | 40.1 | 52.5 |
| Mask R-CNN [16] | ResNet-101 | 38.2 | 60.3 | 41.7 | 20.1 | 41.1 | 50.2 |
| AttractioNet [11]* | VGG16+Wide ResNet | 35.7 | 53.4 | 39.3 | 15.6 | 38.0 | 52.7 |
| Cascade R-CNN | ResNet-101 | 42.8 | 62.1 | 46.3 | 23.7 | 45.5 | 55.2 |
表 5. COCO test-dev 上当时最先进的单模型检测器。标有“*”的条目在推理时使用了额外技巧。
| 骨干网络 | AP | AP | AP | AP | AP | AP | |
|---|---|---|---|---|---|---|---|
| YOLOv2 [29] | DarkNet-19 | 21.6 | 44.0 | 19.2 | 5.0 | 22.4 | 35.5 |
| SSD513 [25] | ResNet-101 | 31.2 | 50.4 | 33.3 | 10.2 | 34.5 | 49.8 |
| RetinaNet [24] | ResNet-101 | 39.1 | 59.1 | 42.3 | 21.8 | 42.7 | 50.2 |
| Faster R-CNN+++ [18]* | ResNet-101 | 34.9 | 55.7 | 37.4 | 15.6 | 38.7 | 50.9 |
| Faster R-CNN w FPN [23] | ResNet-101 | 36.2 | 59.1 | 39.0 | 18.2 | 39.0 | 48.2 |
| Faster R-CNN w FPN+(本文) | ResNet-101 | 38.8 | 61.1 | 41.9 | 21.3 | 41.8 | 49.8 |
| Faster R-CNN by G-RMI [19] | Inception-ResNet-v2 | 34.7 | 55.5 | 36.7 | 13.5 | 38.1 | 52.0 |
| Deformable R-FCN [5]* | Aligned-Inception-ResNet | 37.5 | 58.0 | 40.8 | 19.4 | 40.1 | 52.5 |
| Mask R-CNN [16] | ResNet-101 | 38.2 | 60.3 | 41.7 | 20.1 | 41.1 | 50.2 |
| AttractioNet [11]* | VGG16+Wide ResNet | 35.7 | 53.4 | 39.3 | 15.6 | 38.0 | 52.7 |
| Cascade R-CNN | ResNet-101 | 42.8 | 62.1 | 46.3 | 23.7 | 45.5 | 55.2 |
Table 6. Detailed comparison on multiple popular baseline object detectors. All speeds are reported per image on a single Titan Xp GPU.
| backbone | cascade | train speed | test speed | model size | val (5k) AP | AP | AP | AP | AP | AP | test-dev (20k) AP | AP | AP | AP | AP | AP | |
|---|---|---|---|---|---|---|---|---|---|---|---|---|---|---|---|---|---|
| Faster R-CNN | VGG | ✗ | 0.12s | 0.075s | 278M | 23.6 | 43.9 | 23.0 | 8.0 | 26.2 | 35.5 | 23.5 | 43.9 | 22.6 | 8.1 | 25.1 | 34.7 |
| Faster R-CNN | VGG | ✓ | 0.14s | 0.115s | 704M | 27.0 | 44.2 | 27.7 | 8.6 | 29.1 | 42.2 | 26.9 | 44.3 | 27.8 | 8.3 | 28.2 | 41.1 |
| R-FCN | ResNet-50 | ✗ | 0.19s | 0.07s | 133M | 27.0 | 48.7 | 26.9 | 9.8 | 30.9 | 40.3 | 27.1 | 49.0 | 26.9 | 10.4 | 29.7 | 39.2 |
| R-FCN | ResNet-50 | ✓ | 0.24s | 0.075s | 184M | 31.1 | 49.8 | 32.8 | 10.4 | 34.4 | 48.5 | 30.9 | 49.9 | 32.6 | 10.5 | 33.1 | 46.9 |
| R-FCN | ResNet-101 | ✗ | 0.23s | 0.075s | 206M | 30.3 | 52.2 | 30.8 | 12.0 | 34.7 | 44.3 | 30.5 | 52.9 | 31.2 | 12.0 | 33.9 | 43.8 |
| R-FCN | ResNet-101 | ✓ | 0.29s | 0.083s | 256M | 33.3 | 52.0 | 35.2 | 11.8 | 37.2 | 51.1 | 33.3 | 52.6 | 35.2 | 12.1 | 36.2 | 49.3 |
| FPN+ | ResNet-50 | ✗ | 0.30s | 0.095s | 165M | 36.5 | 58.6 | 39.2 | 20.8 | 40.0 | 47.8 | 36.5 | 59.0 | 39.2 | 20.3 | 38.8 | 46.4 |
| FPN+ | ResNet-50 | ✓ | 0.33s | 0.115s | 272M | 40.3 | 59.4 | 43.7 | 22.9 | 43.7 | 54.1 | 40.6 | 59.9 | 44.0 | 22.6 | 42.7 | 52.1 |
| FPN+ | ResNet-101 | ✗ | 0.38s | 0.115s | 238M | 38.5 | 60.6 | 41.7 | 22.1 | 41.9 | 51.1 | 38.8 | 61.1 | 41.9 | 21.3 | 41.8 | 49.8 |
| FPN+ | ResNet-101 | ✓ | 0.41s | 0.14s | 345M | 42.7 | 61.6 | 46.6 | 23.8 | 46.2 | 57.4 | 42.8 | 62.1 | 46.3 | 23.7 | 45.5 | 55.2 |
表 6. 在多种流行基线目标检测器上的详细比较。所有速度均在单块 Titan Xp GPU 上按每张图像报告。
| 骨干网络 | 级联 | 训练速度 | 测试速度 | 模型大小 | val(5k)AP | AP | AP | AP | AP | AP | test-dev(20k)AP | AP | AP | AP | AP | AP | |
|---|---|---|---|---|---|---|---|---|---|---|---|---|---|---|---|---|---|
| Faster R-CNN | VGG | ✗ | 0.12s | 0.075s | 278M | 23.6 | 43.9 | 23.0 | 8.0 | 26.2 | 35.5 | 23.5 | 43.9 | 22.6 | 8.1 | 25.1 | 34.7 |
| Faster R-CNN | VGG | ✓ | 0.14s | 0.115s | 704M | 27.0 | 44.2 | 27.7 | 8.6 | 29.1 | 42.2 | 26.9 | 44.3 | 27.8 | 8.3 | 28.2 | 41.1 |
| R-FCN | ResNet-50 | ✗ | 0.19s | 0.07s | 133M | 27.0 | 48.7 | 26.9 | 9.8 | 30.9 | 40.3 | 27.1 | 49.0 | 26.9 | 10.4 | 29.7 | 39.2 |
| R-FCN | ResNet-50 | ✓ | 0.24s | 0.075s | 184M | 31.1 | 49.8 | 32.8 | 10.4 | 34.4 | 48.5 | 30.9 | 49.9 | 32.6 | 10.5 | 33.1 | 46.9 |
| R-FCN | ResNet-101 | ✗ | 0.23s | 0.075s | 206M | 30.3 | 52.2 | 30.8 | 12.0 | 34.7 | 44.3 | 30.5 | 52.9 | 31.2 | 12.0 | 33.9 | 43.8 |
| R-FCN | ResNet-101 | ✓ | 0.29s | 0.083s | 256M | 33.3 | 52.0 | 35.2 | 11.8 | 37.2 | 51.1 | 33.3 | 52.6 | 35.2 | 12.1 | 36.2 | 49.3 |
| FPN+ | ResNet-50 | ✗ | 0.30s | 0.095s | 165M | 36.5 | 58.6 | 39.2 | 20.8 | 40.0 | 47.8 | 36.5 | 59.0 | 39.2 | 20.3 | 38.8 | 46.4 |
| FPN+ | ResNet-50 | ✓ | 0.33s | 0.115s | 272M | 40.3 | 59.4 | 43.7 | 22.9 | 43.7 | 54.1 | 40.6 | 59.9 | 44.0 | 22.6 | 42.7 | 52.1 |
| FPN+ | ResNet-101 | ✗ | 0.38s | 0.115s | 238M | 38.5 | 60.6 | 41.7 | 22.1 | 41.9 | 51.1 | 38.8 | 61.1 | 41.9 | 21.3 | 41.8 | 49.8 |
| FPN+ | ResNet-101 | ✓ | 0.41s | 0.14s | 345M | 42.7 | 61.6 | 46.6 | 23.8 | 46.2 | 57.4 | 42.8 | 62.1 | 46.3 | 23.7 | 45.5 | 55.2 |
Table 7. Detection results on PASCAL VOC 2007 test.
| Faster R-CNN | Faster R-CNN | Faster R-CNN | Faster R-CNN | R-FCN | R-FCN | R-FCN | R-FCN | |
|---|---|---|---|---|---|---|---|---|
| backbone | AlexNet | AlexNet | VGG | VGG | ResNet-50 | ResNet-50 | ResNet-101 | ResNet-101 |
| cascade | ✗ | ✓ | ✗ | ✓ | ✗ | ✓ | ✗ | ✓ |
| AP | 29.4 | 38.9 | 42.9 | 51.2 | 44.8 | 51.8 | 49.4 | 54.2 |
| AP | 63.2 | 66.5 | 76.4 | 79.1 | 77.5 | 78.5 | 79.8 | 79.6 |
| AP | 23.7 | 40.5 | 44.1 | 56.3 | 46.8 | 57.1 | 53.2 | 59.2 |
表 7. PASCAL VOC 2007 test 上的检测结果。
| Faster R-CNN | Faster R-CNN | Faster R-CNN | Faster R-CNN | R-FCN | R-FCN | R-FCN | R-FCN | |
|---|---|---|---|---|---|---|---|---|
| 骨干网络 | AlexNet | AlexNet | VGG | VGG | ResNet-50 | ResNet-50 | ResNet-101 | ResNet-101 |
| 级联 | ✗ | ✓ | ✗ | ✓ | ✗ | ✓ | ✗ | ✓ |
| AP | 29.4 | 38.9 | 42.9 | 51.2 | 44.8 | 51.8 | 49.4 | 54.2 |
| AP | 63.2 | 66.5 | 76.4 | 79.1 | 77.5 | 78.5 | 79.8 | 79.6 |
| AP | 23.7 | 40.5 | 44.1 | 56.3 | 46.8 | 57.1 | 53.2 | 59.2 |
6. Conclusion
In this paper, we proposed a multi-stage object detection framework, the Cascade R-CNN, for the design of high quality object detectors. This architecture was shown to avoid the problems of overfitting at training and quality mismatch at inference. The solid and consistent detection improvements of the Cascade R-CNN on the challenging COCO and the popular PASCAL VOC datasets suggest the modeling and understanding of various concurring factors are required to advance object detection. The Cascade R-CNN was shown to be applicable to many object detection architectures. We believe that it can be useful to many future object detection research efforts.
本文提出了一种多阶段目标检测框架 Cascade R-CNN,用于设计高质量目标检测器。这一架构被证明能够避免训练时的过拟合以及推理时的质量错配。Cascade R-CNN 在有挑战性的 COCO 和常用的 PASCAL VOC 数据集上取得了扎实而稳定的检测提升,这表明,要推进目标检测,需要把多种同时起作用的因素纳入建模和理解。实验还表明,Cascade R-CNN 可以用于许多目标检测架构。我们相信,它可以对今后的许多目标检测研究有所帮助。
Acknowledgment
This work was funded by NSF Awards IIS-1208522 and IIS-1637941, ONR award UCSD-SUBK-N141-076, and a GPU donation from NVIDIA. We also would like to thank Kaiming He for valuable discussions.
本工作由 NSF Awards IIS-1208522 和 IIS-1637941、ONR award UCSD-SUBK-N141-076 以及 NVIDIA 捐赠的 GPU 资助。我们也感谢 Kaiming He 的宝贵讨论。
References
[1] Z. Cai, Q. Fan, R. S. Feris, and N. Vasconcelos. A unified multi-scale deep convolutional neural network for fast object detection. In ECCV, pages 354–370, 2016. 2, 3
[2] X. Cao, Y. Wei, F. Wen, and J. Sun. Face alignment by explicit shape regression. In CVPR, pages 2887–2894, 2012. 4
[3] J. Dai, K. He, and J. Sun. Instance-aware semantic segmentation via multi-task network cascades. In CVPR, pages 3150–3158, 2016. 3
[4] J. Dai, Y. Li, K. He, and J. Sun. R-FCN: object detection via region-based fully convolutional networks. In NIPS, pages 379–387, 2016. 2, 3, 5, 7
[5] J. Dai, H. Qi, Y. Xiong, Y. Li, G. Zhang, H. Hu, and Y. Wei. Deformable convolutional networks. In ICCV, 2017. 7, 8
[6] P. Dollár, P. Welinder, and P. Perona. Cascaded pose regression. In CVPR, pages 1078–1085, 2010. 4
[7] C. Elkan. The foundations of cost-sensitive learning. In IJCAI, pages 973–978, 2001. 2
[8] M. Everingham, L. J. V. Gool, C. K. I. Williams, J. M. Winn, and A. Zisserman. The pascal visual object classes (VOC) challenge. International Journal of Computer Vision, 88(2):303–338, 2010. 8
[9] P. F. Felzenszwalb, R. B. Girshick, D. A. McAllester, and D. Ramanan. Object detection with discriminatively trained part-based models. IEEE Trans. Pattern Anal. Mach. Intell., 32(9):1627–1645, 2010. 2
[10] S. Gidaris and N. Komodakis. Object detection via a multi-region and semantic segmentation-aware CNN model. In ICCV, pages 1134–1142, 2015. 3
[11] S. Gidaris and N. Komodakis. Attend refine repeat: Active box proposal generation via in-out localization. In BMVC, 2016. 3, 7, 8
[12] S. Gidaris and N. Komodakis. Locnet: Improving localization accuracy for object detection. In CVPR, pages 789–798, 2016. 3
[13] R. B. Girshick. Fast R-CNN. In ICCV, pages 1440–1448, 2015. 1, 2, 3, 5
[14] R. B. Girshick, J. Donahue, T. Darrell, and J. Malik. Rich feature hierarchies for accurate object detection and semantic segmentation. In CVPR, pages 580–587, 2014. 1, 2
[15] S. Han, J. Pool, J. Tran, and W. J. Dally. Learning both weights and connections for efficient neural network. In NIPS, pages 1135–1143, 2015. 5
[16] K. He, G. Gkioxari, P. Dollár, and R. Girshick. Mask r-cnn. In ICCV, 2017. 3, 5, 7, 8
[17] K. He, X. Zhang, S. Ren, and J. Sun. Spatial pyramid pooling in deep convolutional networks for visual recognition. In ECCV, pages 346–361, 2014. 2
[18] K. He, X. Zhang, S. Ren, and J. Sun. Deep residual learning for image recognition. In CVPR, pages 770–778, 2016. 3, 5, 7, 8
[19] J. Huang, V. Rathod, C. Sun, M. Zhu, A. Korattikara, A. Fathi, I. Fischer, Z. Wojna, Y. Song, S. Guadarrama, and K. Murphy. Speed/accuracy trade-offs for modern convolutional object detectors. CoRR, abs/1611.10012, 2016. 7, 8
[20] Y. Jia, E. Shelhamer, J. Donahue, S. Karayev, J. Long, R. B. Girshick, S. Guadarrama, and T. Darrell. Caffe: Convolutional architecture for fast feature embedding. In MM, pages 675–678, 2014. 5
[21] H. Li, Z. Lin, X. Shen, J. Brandt, and G. Hua. A convolutional neural network cascade for face detection. In CVPR, pages 5325–5334, 2015. 3
[22] T. Lin, M. Maire, S. J. Belongie, J. Hays, P. Perona, D. Ramanan, P. Dollár, and C. L. Zitnick. Microsoft COCO: common objects in context. In ECCV, pages 740–755, 2014. 2, 5
[23] T.-Y. Lin, P. Dollár, R. Girshick, K. He, B. Hariharan, and S. Belongie. Feature pyramid networks for object detection. In CVPR, 2017. 1, 2, 3, 5, 7, 8
[24] T.-Y. Lin, P. Goyal, R. Girshick, K. He, and P. Dollár. Focal loss for dense object detection. In ICCV, 2017. 3, 7, 8
[25] W. Liu, D. Anguelov, D. Erhan, C. Szegedy, S. E. Reed, C. Fu, and A. C. Berg. SSD: single shot multibox detector. In ECCV, pages 21–37, 2016. 2, 8
[26] H. Masnadi-Shirazi and N. Vasconcelos. Cost-sensitive boosting. IEEE Trans. Pattern Anal. Mach. Intell., 33(2):294–309, 2011. 2
[27] M. Najibi, M. Rastegari, and L. S. Davis. G-CNN: an iterative grid based object detector. In CVPR, pages 2369–2377, 2016. 3
[28] W. Ouyang, K. Wang, X. Zhu, and X. Wang. Learning chained deep features and classifiers for cascade in object detection. CoRR, abs/1702.07054, 2017. 3
[29] J. Redmon, S. K. Divvala, R. B. Girshick, and A. Farhadi. You only look once: Unified, real-time object detection. In CVPR, pages 779–788, 2016. 2, 8
[30] S. Ren, K. He, R. B. Girshick, and J. Sun. Faster R-CNN: towards real-time object detection with region proposal networks. In NIPS, pages 91–99, 2015. 1, 2, 3, 4, 5, 7, 8
[31] A. Shrivastava, A. Gupta, and R. B. Girshick. Training region-based object detectors with online hard example mining. In CVPR, pages 761–769, 2016. 5
[32] K. Simonyan and A. Zisserman. Very deep convolutional networks for large-scale image recognition. CoRR, abs/1409.1556, 2014. 5
[33] J. R. R. Uijlings, K. E. A. van de Sande, T. Gevers, and A. W. M. Smeulders. Selective search for object recognition. International Journal of Computer Vision, 104(2):154–171, 2013. 4
[34] P. A. Viola and M. J. Jones. Robust real-time face detection. International Journal of Computer Vision, 57(2):137–154, 2004. 2, 3
[35] J. Yan, Z. Lei, D. Yi, and S. Li. Learn to combine multiple hypotheses for accurate face alignment. In ICCV Workshops, pages 392–396, 2013. 4
[36] B. Yang, J. Yan, Z. Lei, and S. Z. Li. CRAFT objects from images. In CVPR, pages 6043–6051, 2016. 3
[37] D. Yoo, S. Park, J. Lee, A. S. Paek, and I. Kweon. Attention-net: Aggregating weak directions for accurate object detection. In ICCV, pages 2659–2667, 2015. 3
[38] S. Zagoruyko, A. Lerer, T. Lin, P. O. Pinheiro, S. Gross, S. Chintala, and P. Dollár. A multipath network for object detection. In BMVC, 2016. 4